
If you an Elliott Wave practitioner, fundamental analyst or a technical junkie, you are likely starting to sweat. Either from extreme levels of excitement or sheer panic.
The chart below from Daneric’s Elliott Waves (great blog btw) is a good representation of the subject matter. According to this Elliott Wave analysis, the stock market is about to collapse in a massive Wave 3 of 3.
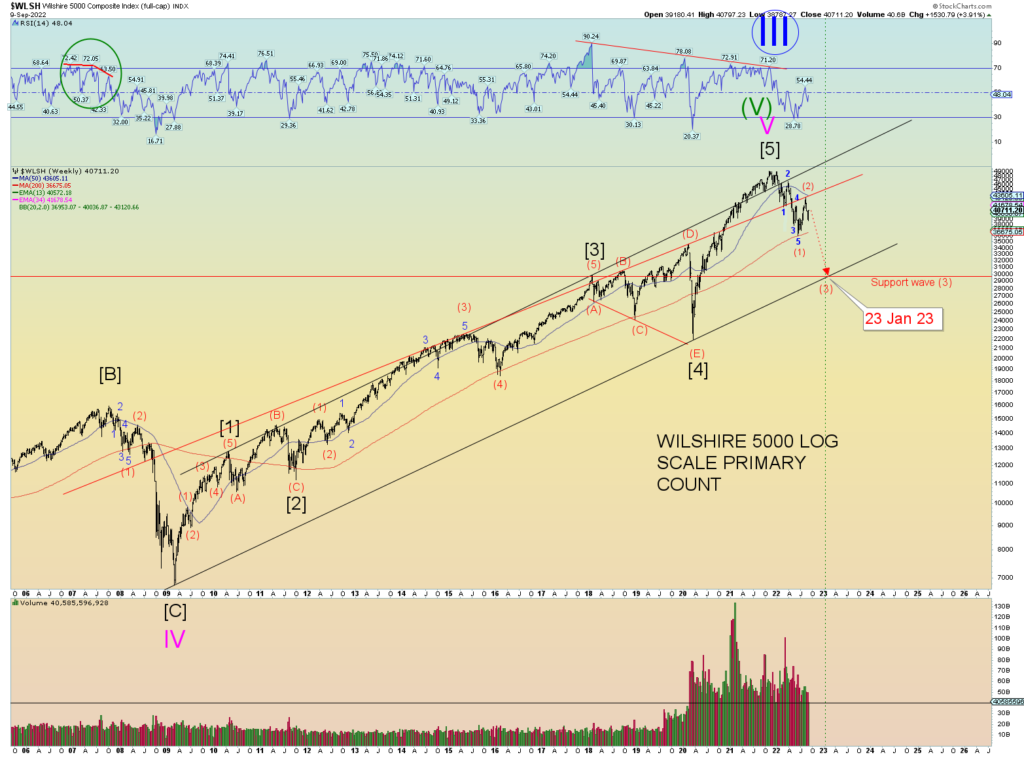
Numerous fundamental and technical data points would tend to agree with this assertion. Just today I read the following US Yield Curve Set to Invert by Most in 40 Years
Is that bad?
It looks bad. As you know, yield curve inversions tend to precede recessions and a customary stock market haircut.
Yet, there is a clear cut way to determine what the stock market will do next and it might not be what you expect. Let me start today with the following two charts.
Up/down projection cycles below is just one data point in our extensive set of TIMING tools. Please note the two long-term cycles involved, one bottoming in mid 2022 and the other one topping in early 2023. Quick note, please ignore the cyclical bottom our software has identified in mid June, there is a certain margin of error associated with it.
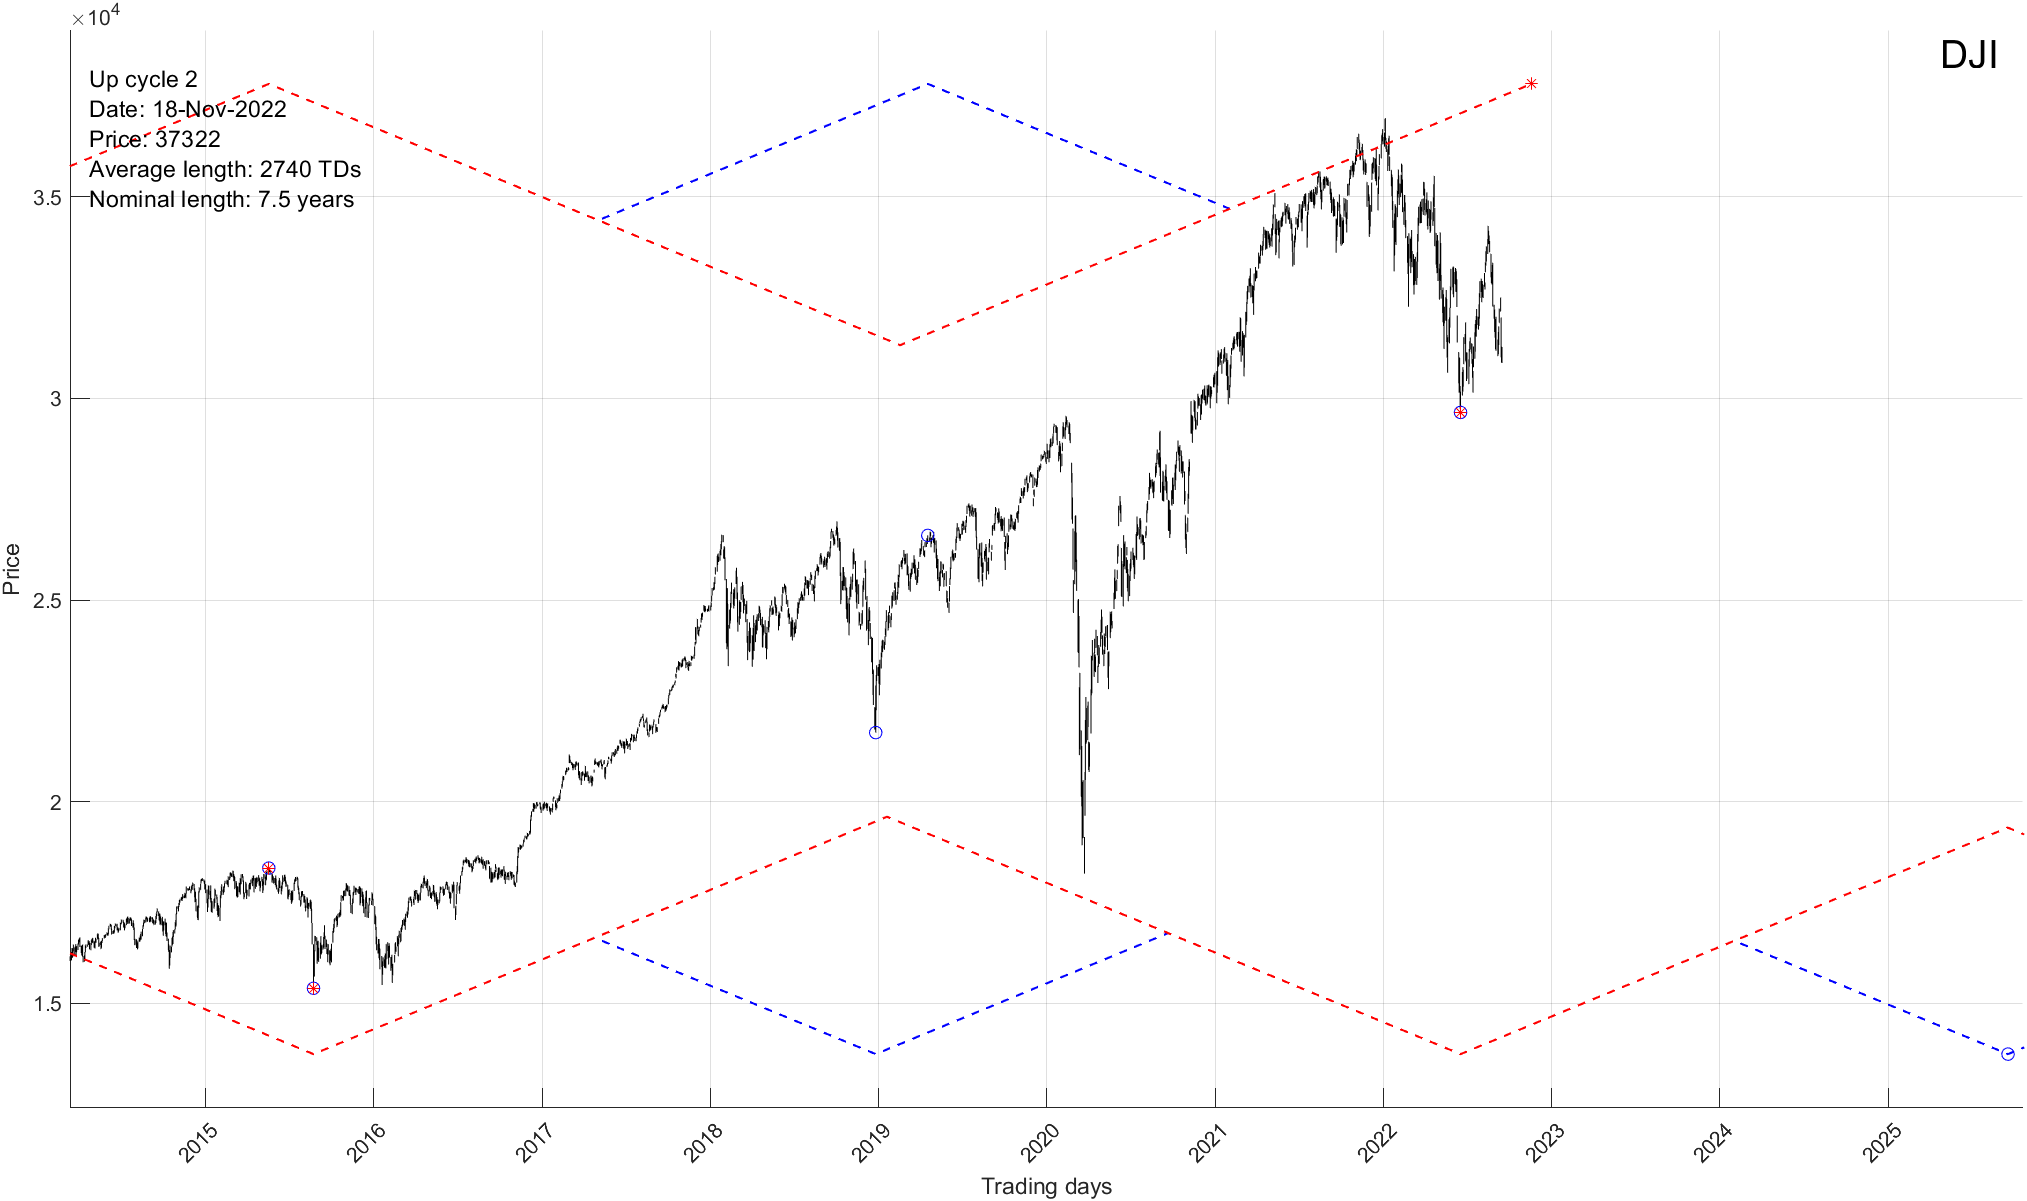
The bottom cycle in question is a constant 6.5 year cycle that is typically responsible for major bottoms. For instance, 2002, 2009 and 2015 bottoms. The upper longer-term cycle is the 7.5 year cycle that is responsible for tops associated with 2000, 2007 and 2015 tops.
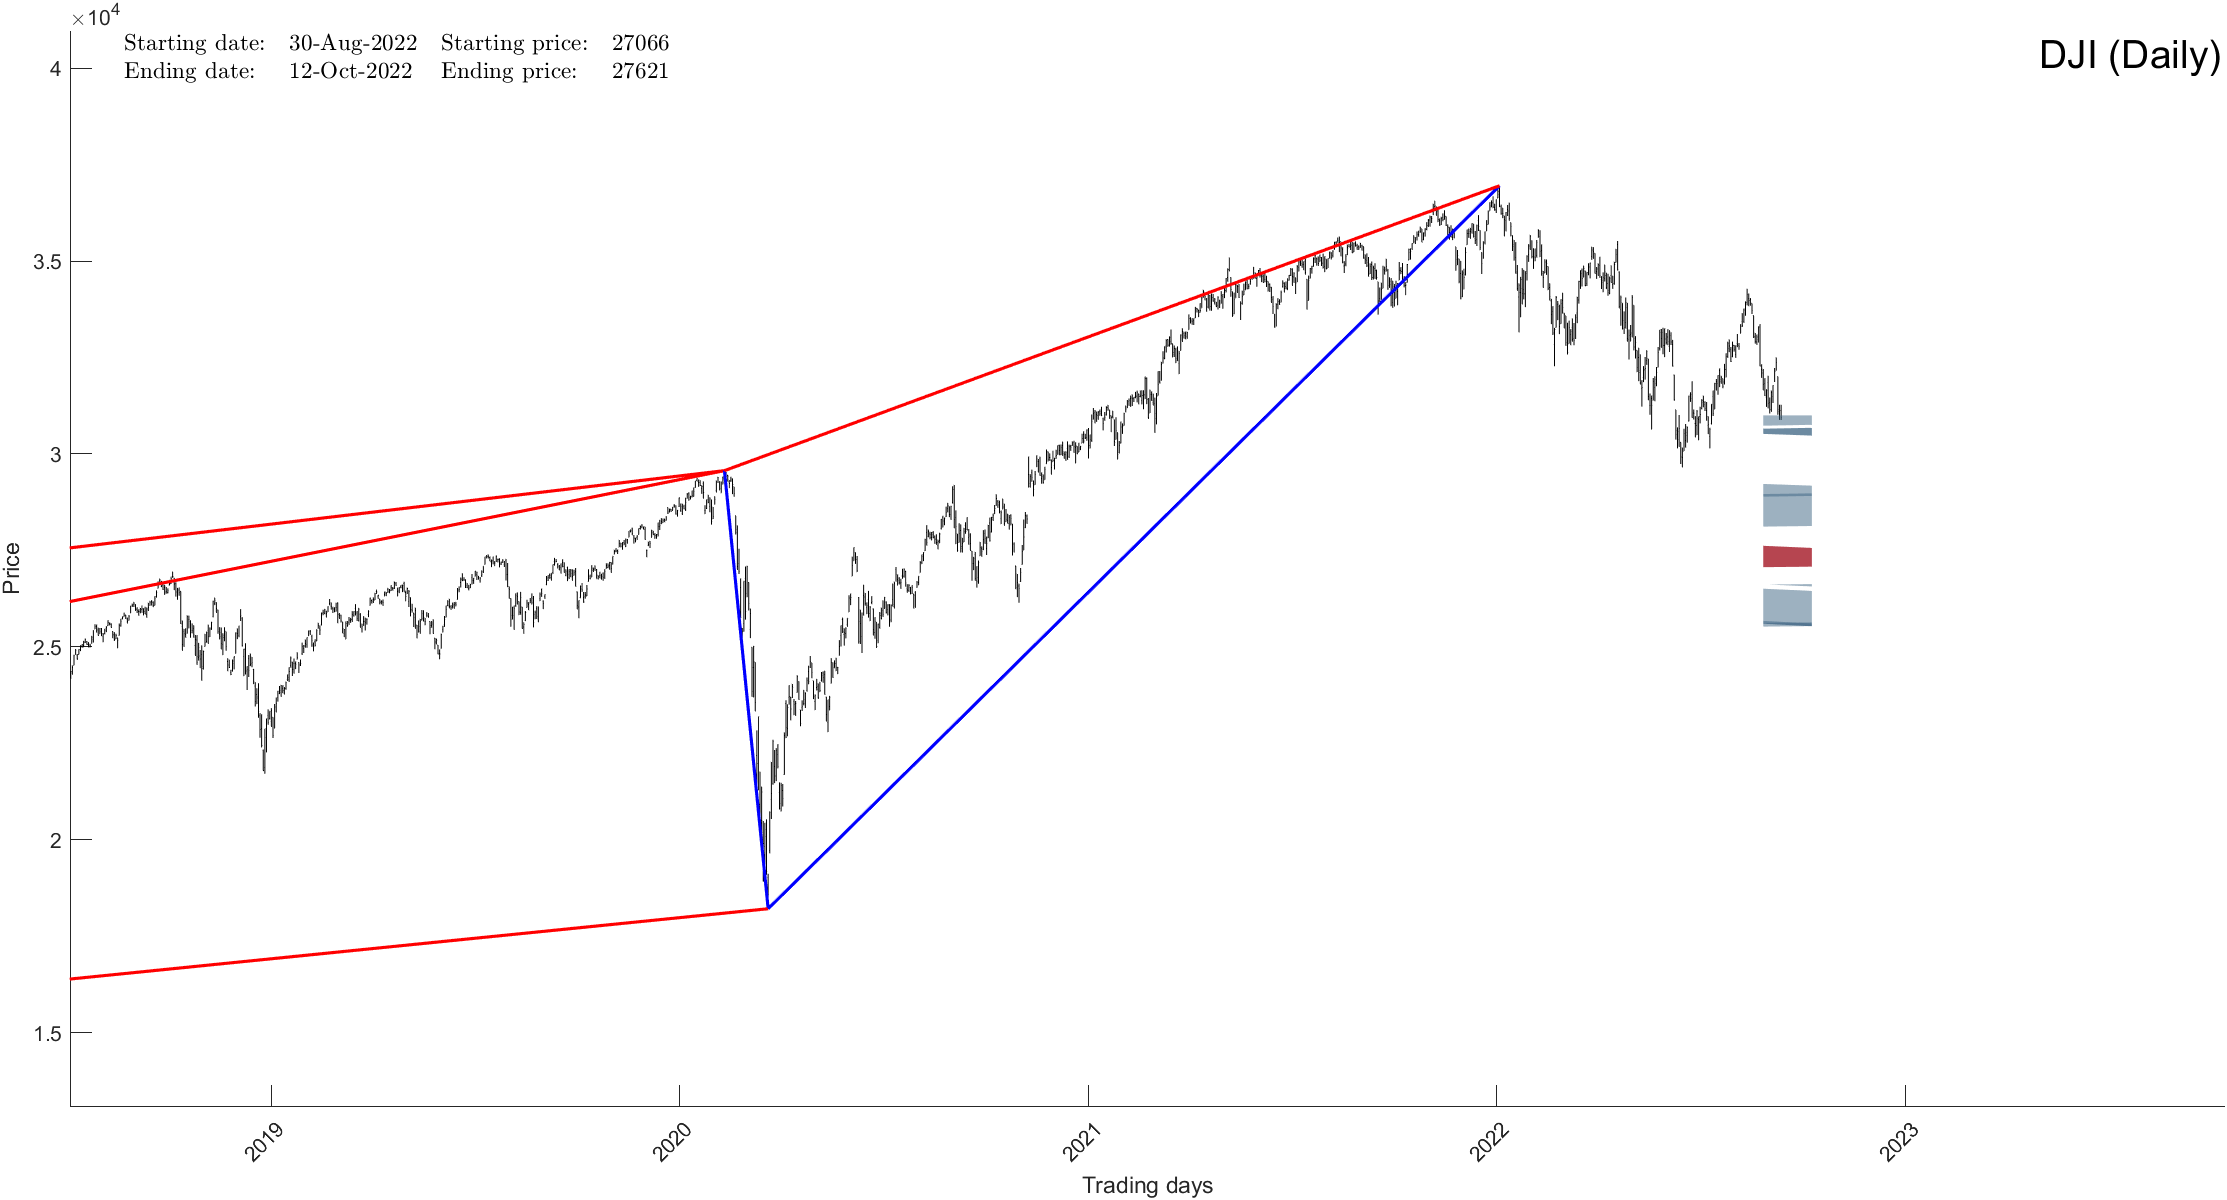
Now, the chart below makes a certain TIME/PRICE projection or rather a set of projections associated with our set of calculations described here. In short, after taking Dow Jones’s all possible geometric compositions into consideration the software identifies a major turning point. Whether it is up or down.
What does all of that mean?
Well, while it is easy to come to an analytical conclusion that might have been the case in the past, the work above shows an entirely different outcome if you base your projections on exact mathematics.
If you would be interested in learning what the charts above indicate, to the day and to within a +/-100 point resolution, please Click Here .