
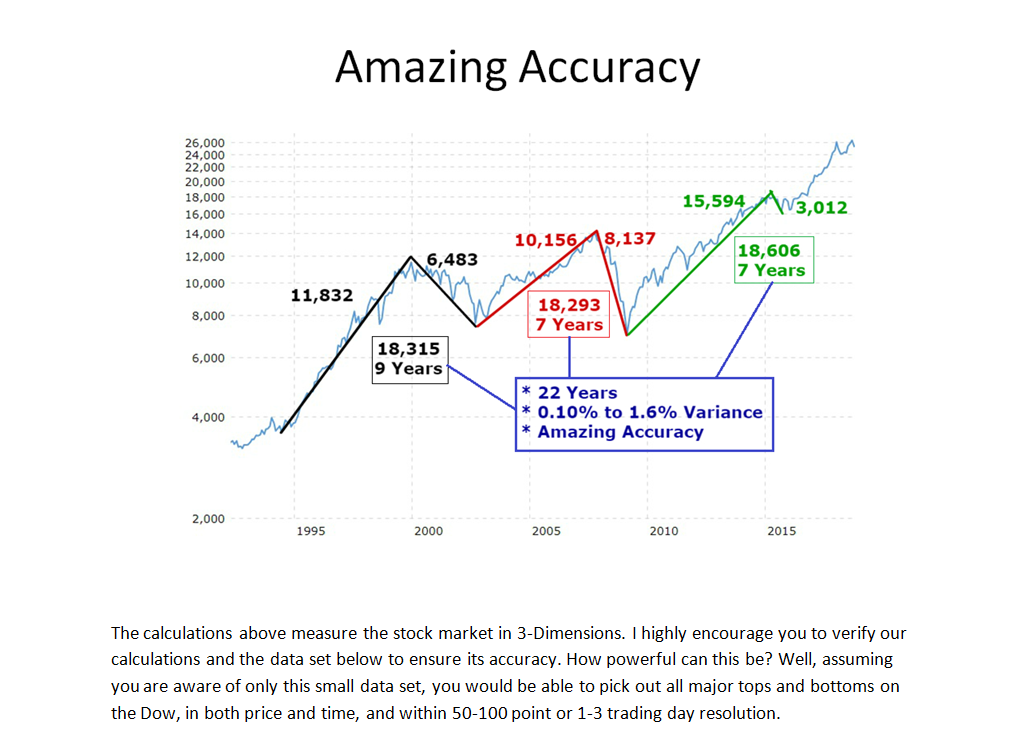
The calculations above measure the stock market in 3-Dimensions. I highly encourage you to verify our calculations and the data set below to ensure its accuracy. How powerful can this be? Well, assuming you are aware of only this small data set, you would be able to pick out all major tops and bottoms on the Dow, in both price and time, and within 50-100 point or 1-3 trading day resolution.
|
Move |
High Date |
High Price |
Low Date |
Low Price |
Change Hours |
Change In Price |
3D Value |
|
1994/2000 |
1/14/2000 |
11,895 |
11/23/1994 |
3,612 |
8,437 |
8,296 |
11,832 |
|
2000/2002 |
1/14/2000 |
11,895 |
10/10/2002 |
7,156 |
4,437 |
4,727 |
6,483 |
|
2002/2007 |
10/11/07 |
14,279 |
03/12/2003 |
7,357 |
7,470 |
6,882 |
10,156 |
|
2007/2009 |
10/11/07 |
14,279 |
3/6/2009 |
6,428 |
2,280 |
7,811 |
8,137 |
|
2009/2015 |
5/19/2015 |
18,351 |
3/6/2009 |
6,428 |
10,050 |
11,923 |
15,594 |
|
2015/2016 |
5/19/2015 |
18,351 |
8/24/2015 |
15,332 |
436 |
2,981 |
3,012 |