
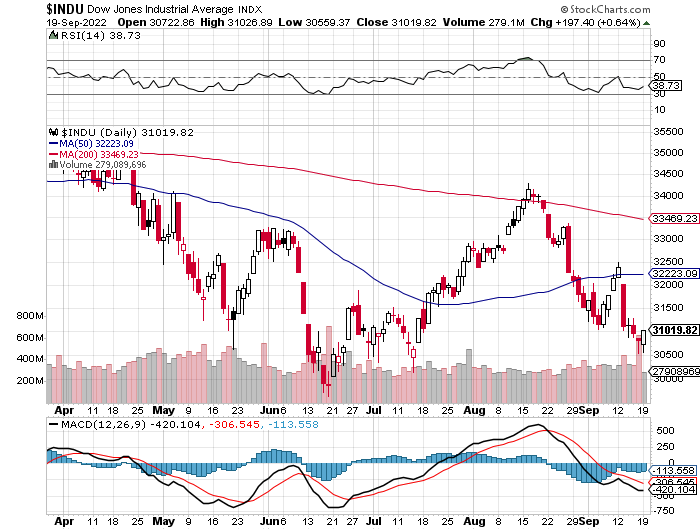
9/16/2022 – A positive day with the Dow Jones up 197 points (+0.64%) and the Nasdaq up 86 points (+0.76%)
It’s a well know fact that the FED follows 3 and 6 month Treasury rates when setting their benchmark. Last time the FED raised interest rates by 75 basis points was in late July. At that time 6 Month Treasury was at around 2.85% and today, at 3.87%. Let’s round up and say 1% higher.
That suggests the FED would have to hike as much as 1% just to catch up. Will they or won’t they is not as important as what they will say. The bulls are praying for a clear indication that the rate hikes are either nearly done or will slow. And the bears, of course, are salivating over a 1% hike with no end in sight.
What will actually happen is likely somewhere in between. Luckily, you don’t have to guess how the stock market will react. That has already been pre-determined. Allow me to explain how our work knows where the market will either top or bottom, plus, exactly WHEN it will happen.
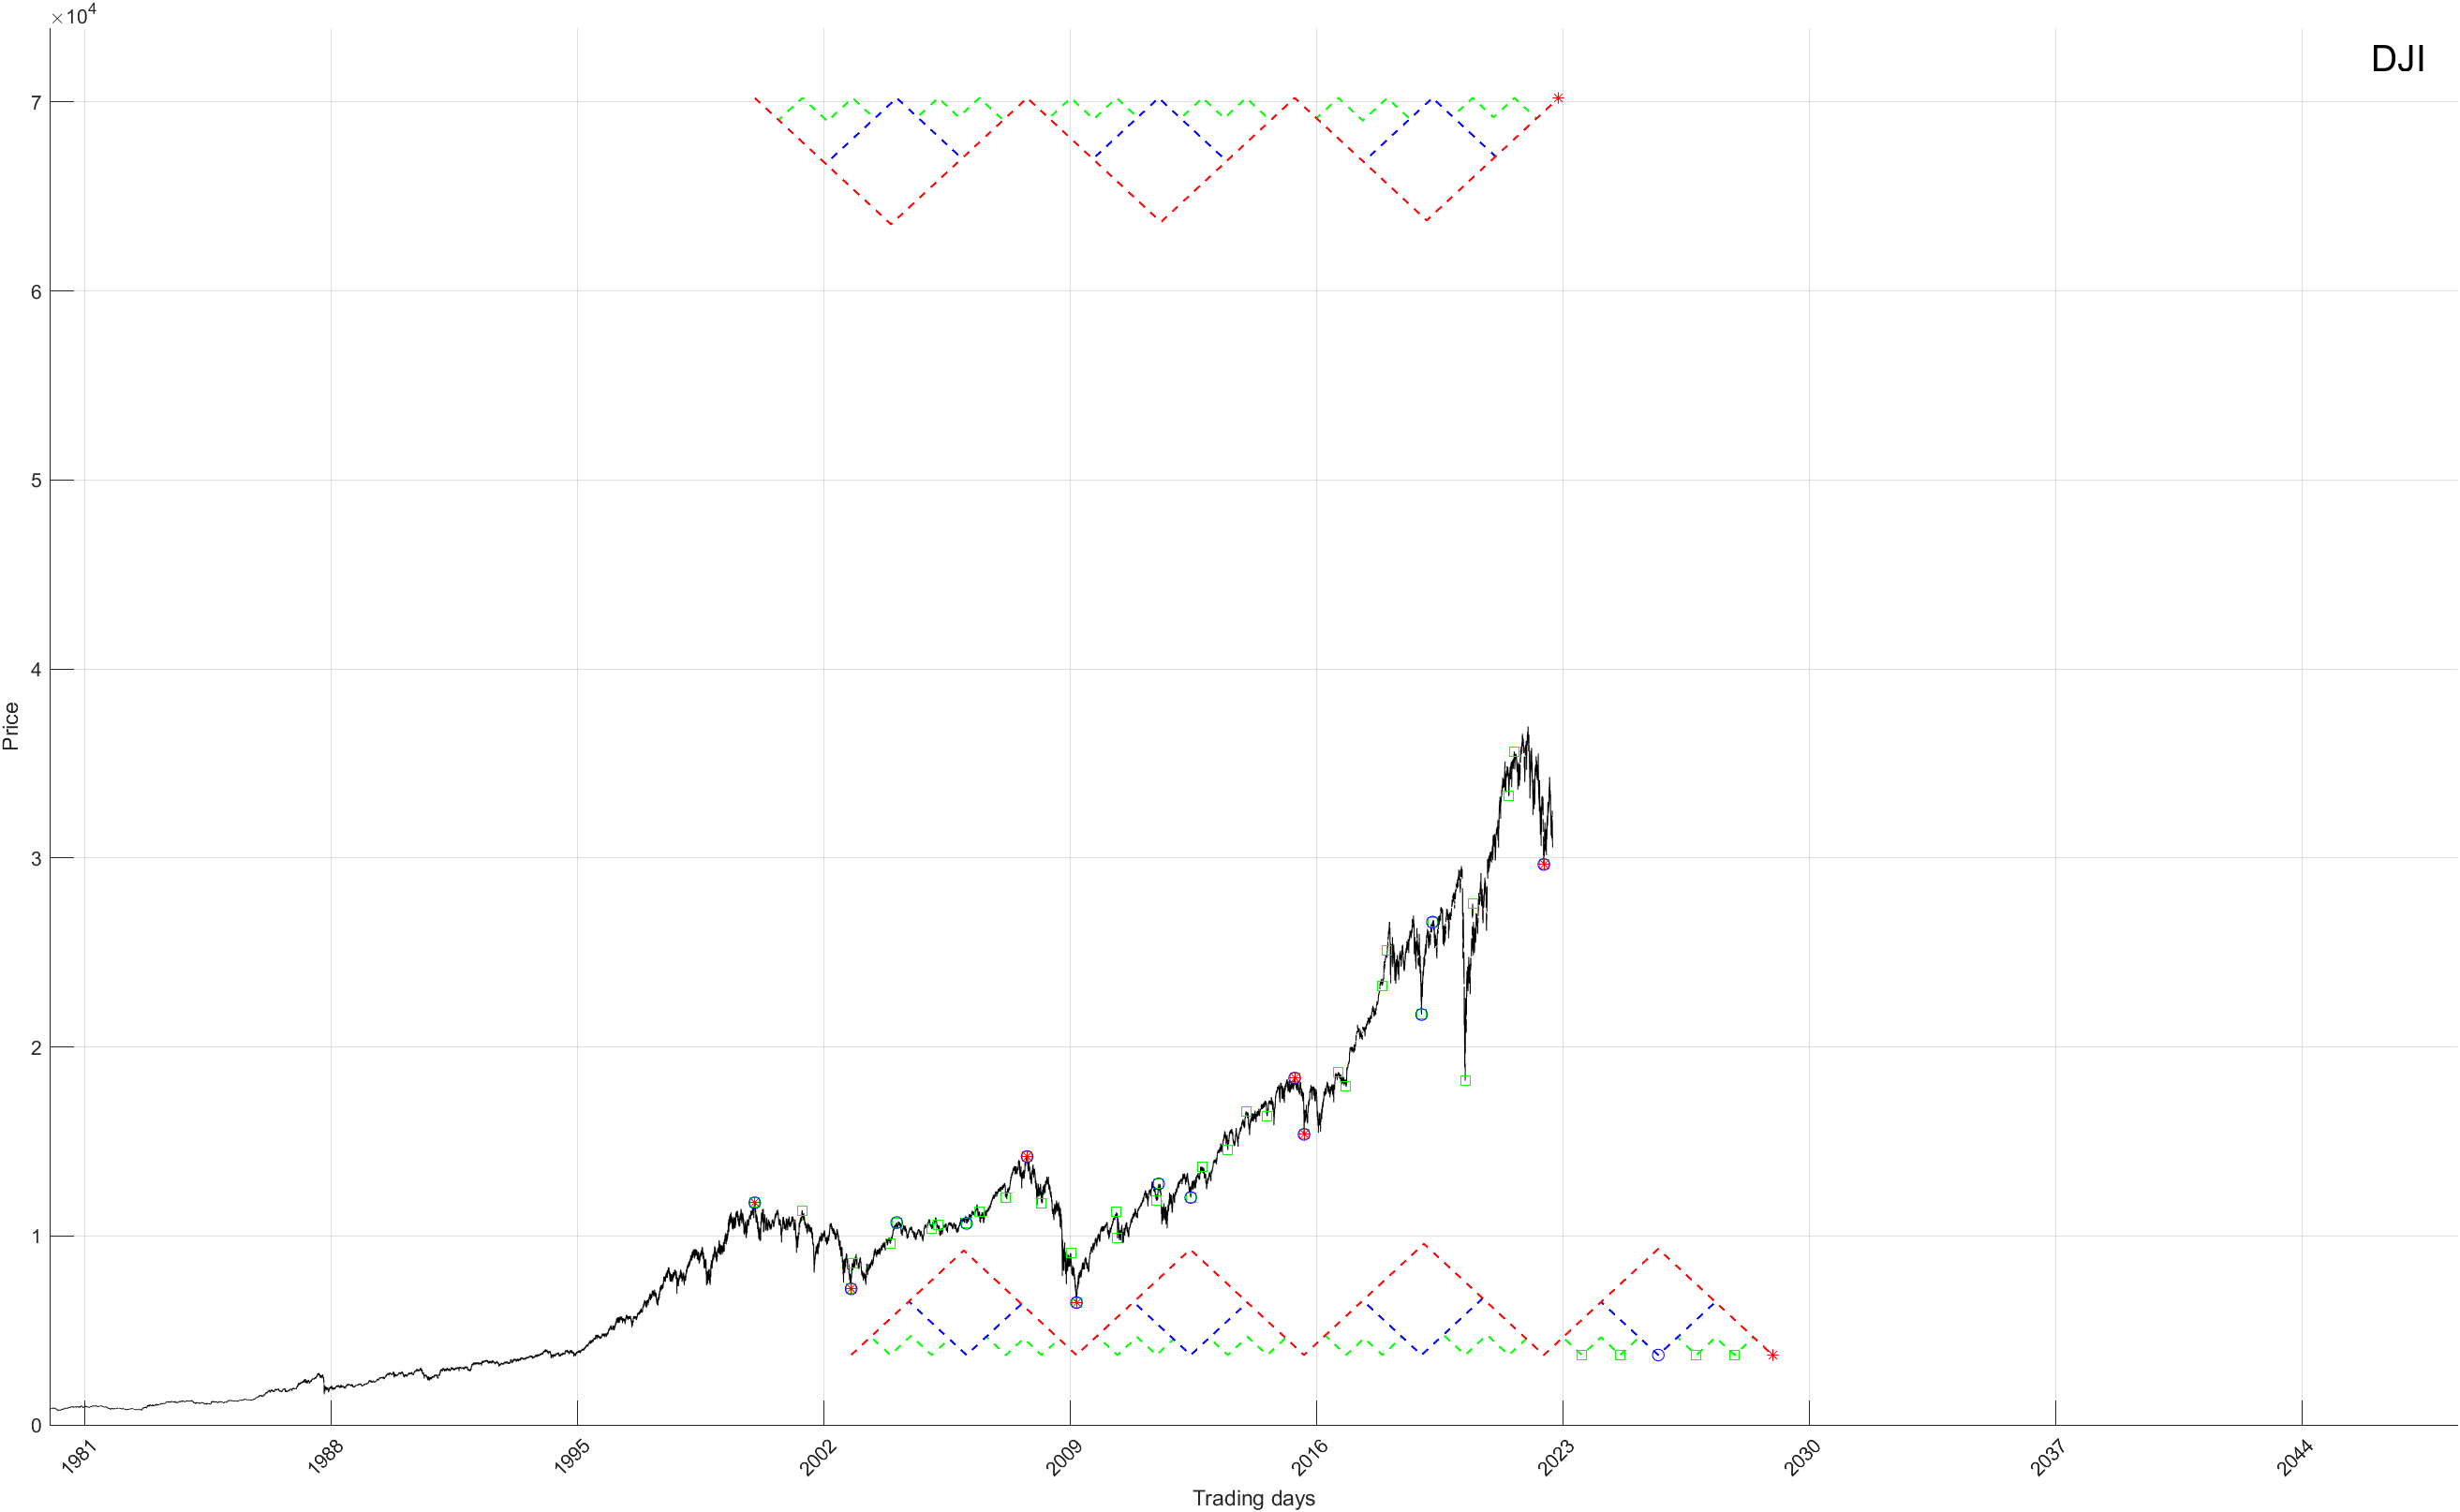
Dow’s Long-Term Cycle Composite: At least one of them. Our work suggests the stock market or individual stocks have multiple composites running its cycles at any given time. Not only that, there are up and down composites, that are responsible for all tops and bottoms, short-term and long-term. The one below gives you a pretty good idea about what happens next and/or when to anticipate major tops and bottoms.
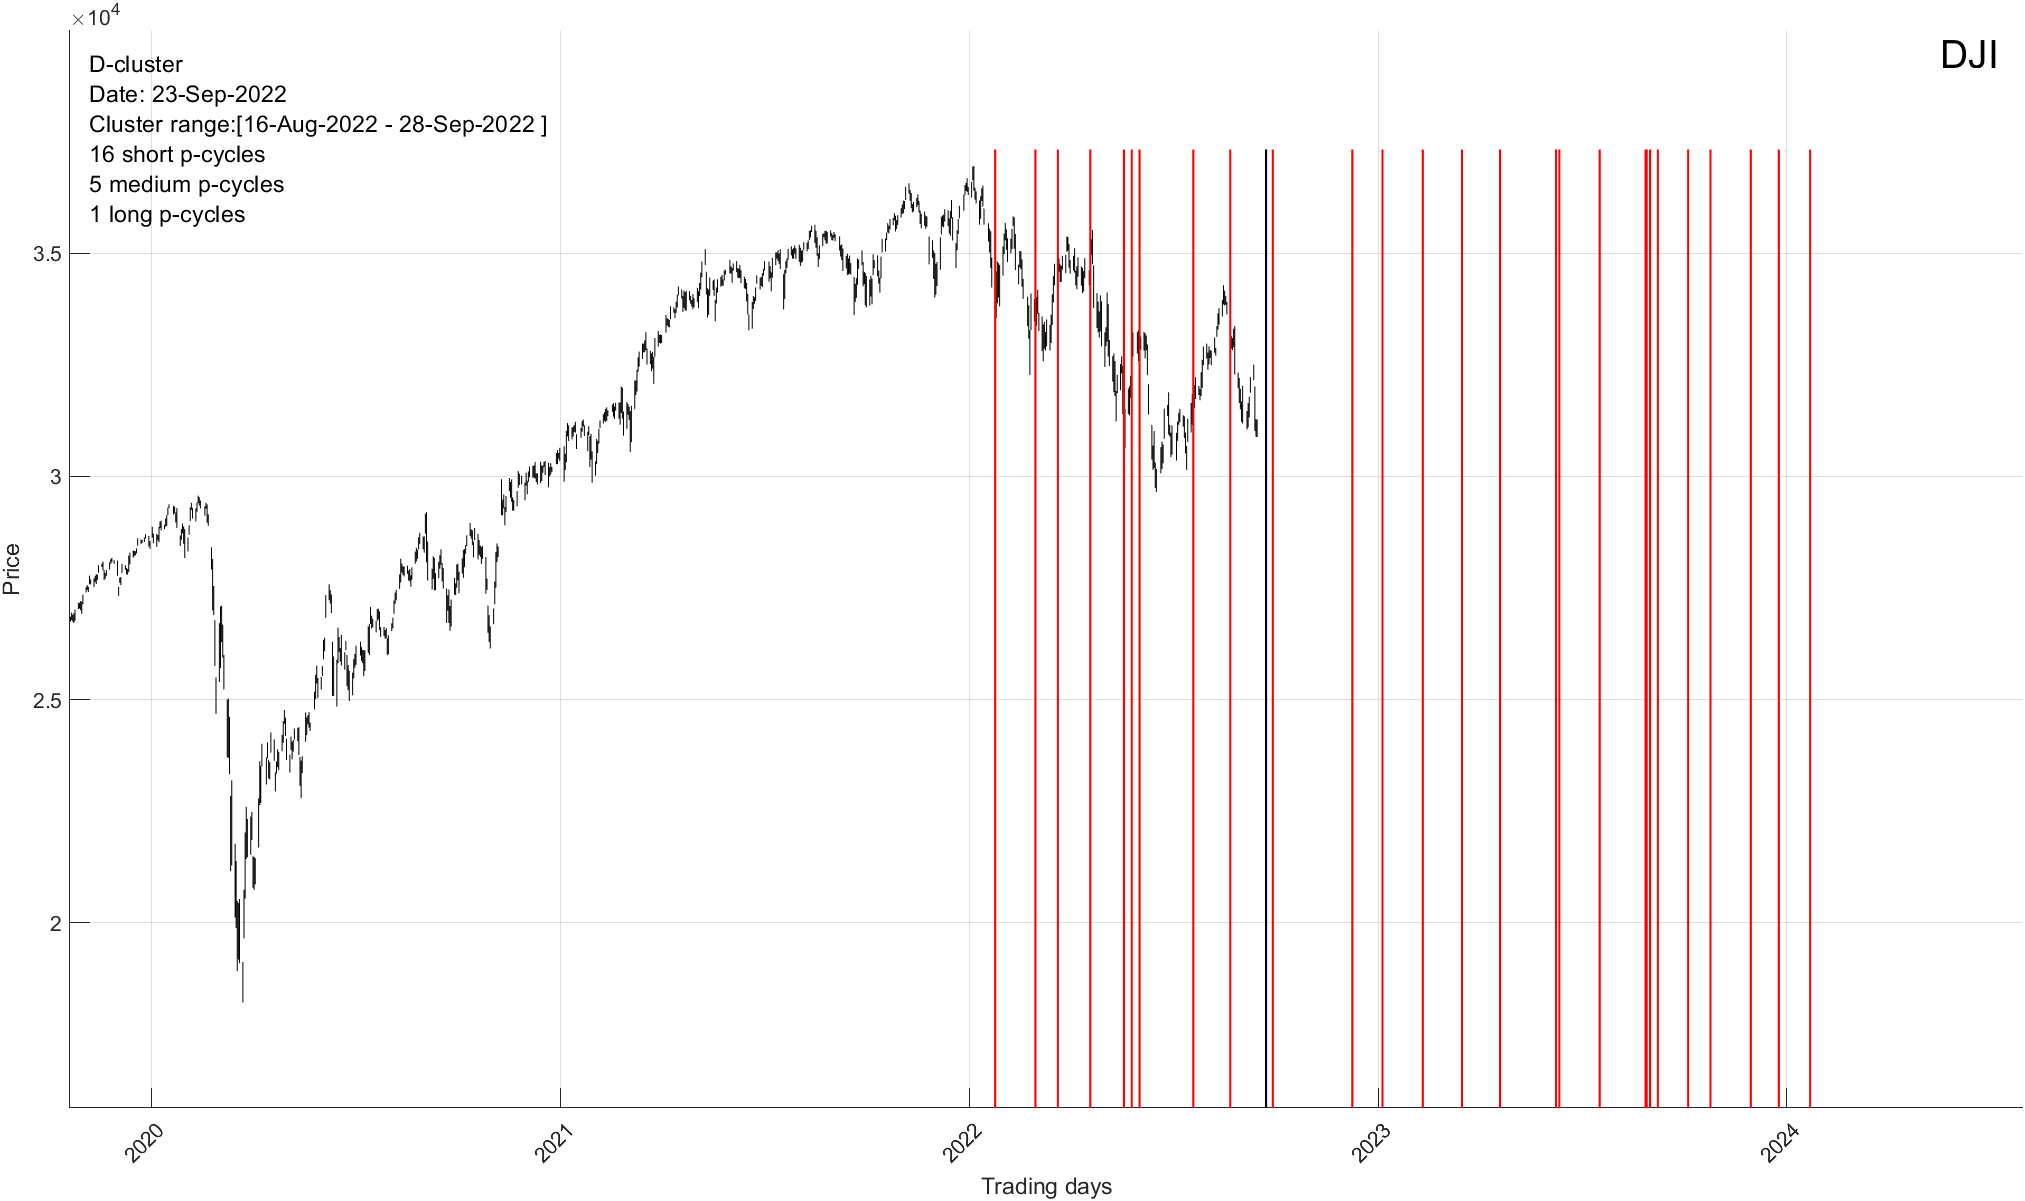
TIMING Clusters: Each line represents a timing cluster where a number of different cycles (independent of composite cycles above) come together and indicate a change in trend. This change can be long-term or short-term in nature. The next TIME cluster of interest arrives on September 19th (+/- 2 trading days). Will it spark a rally or be a dud? Find out below.
Market’s Structural Composition: As our theory suggests, the market moves in multidimensional space. When it does it traces out certain lattice structures in 3D space based on prior moves. In other words, all future movements are geometrically precise in both PRICE and TIME. For instance, dots below represent all possible future turning points. Now, most of them can be filtered out to get a 95% accurate read.
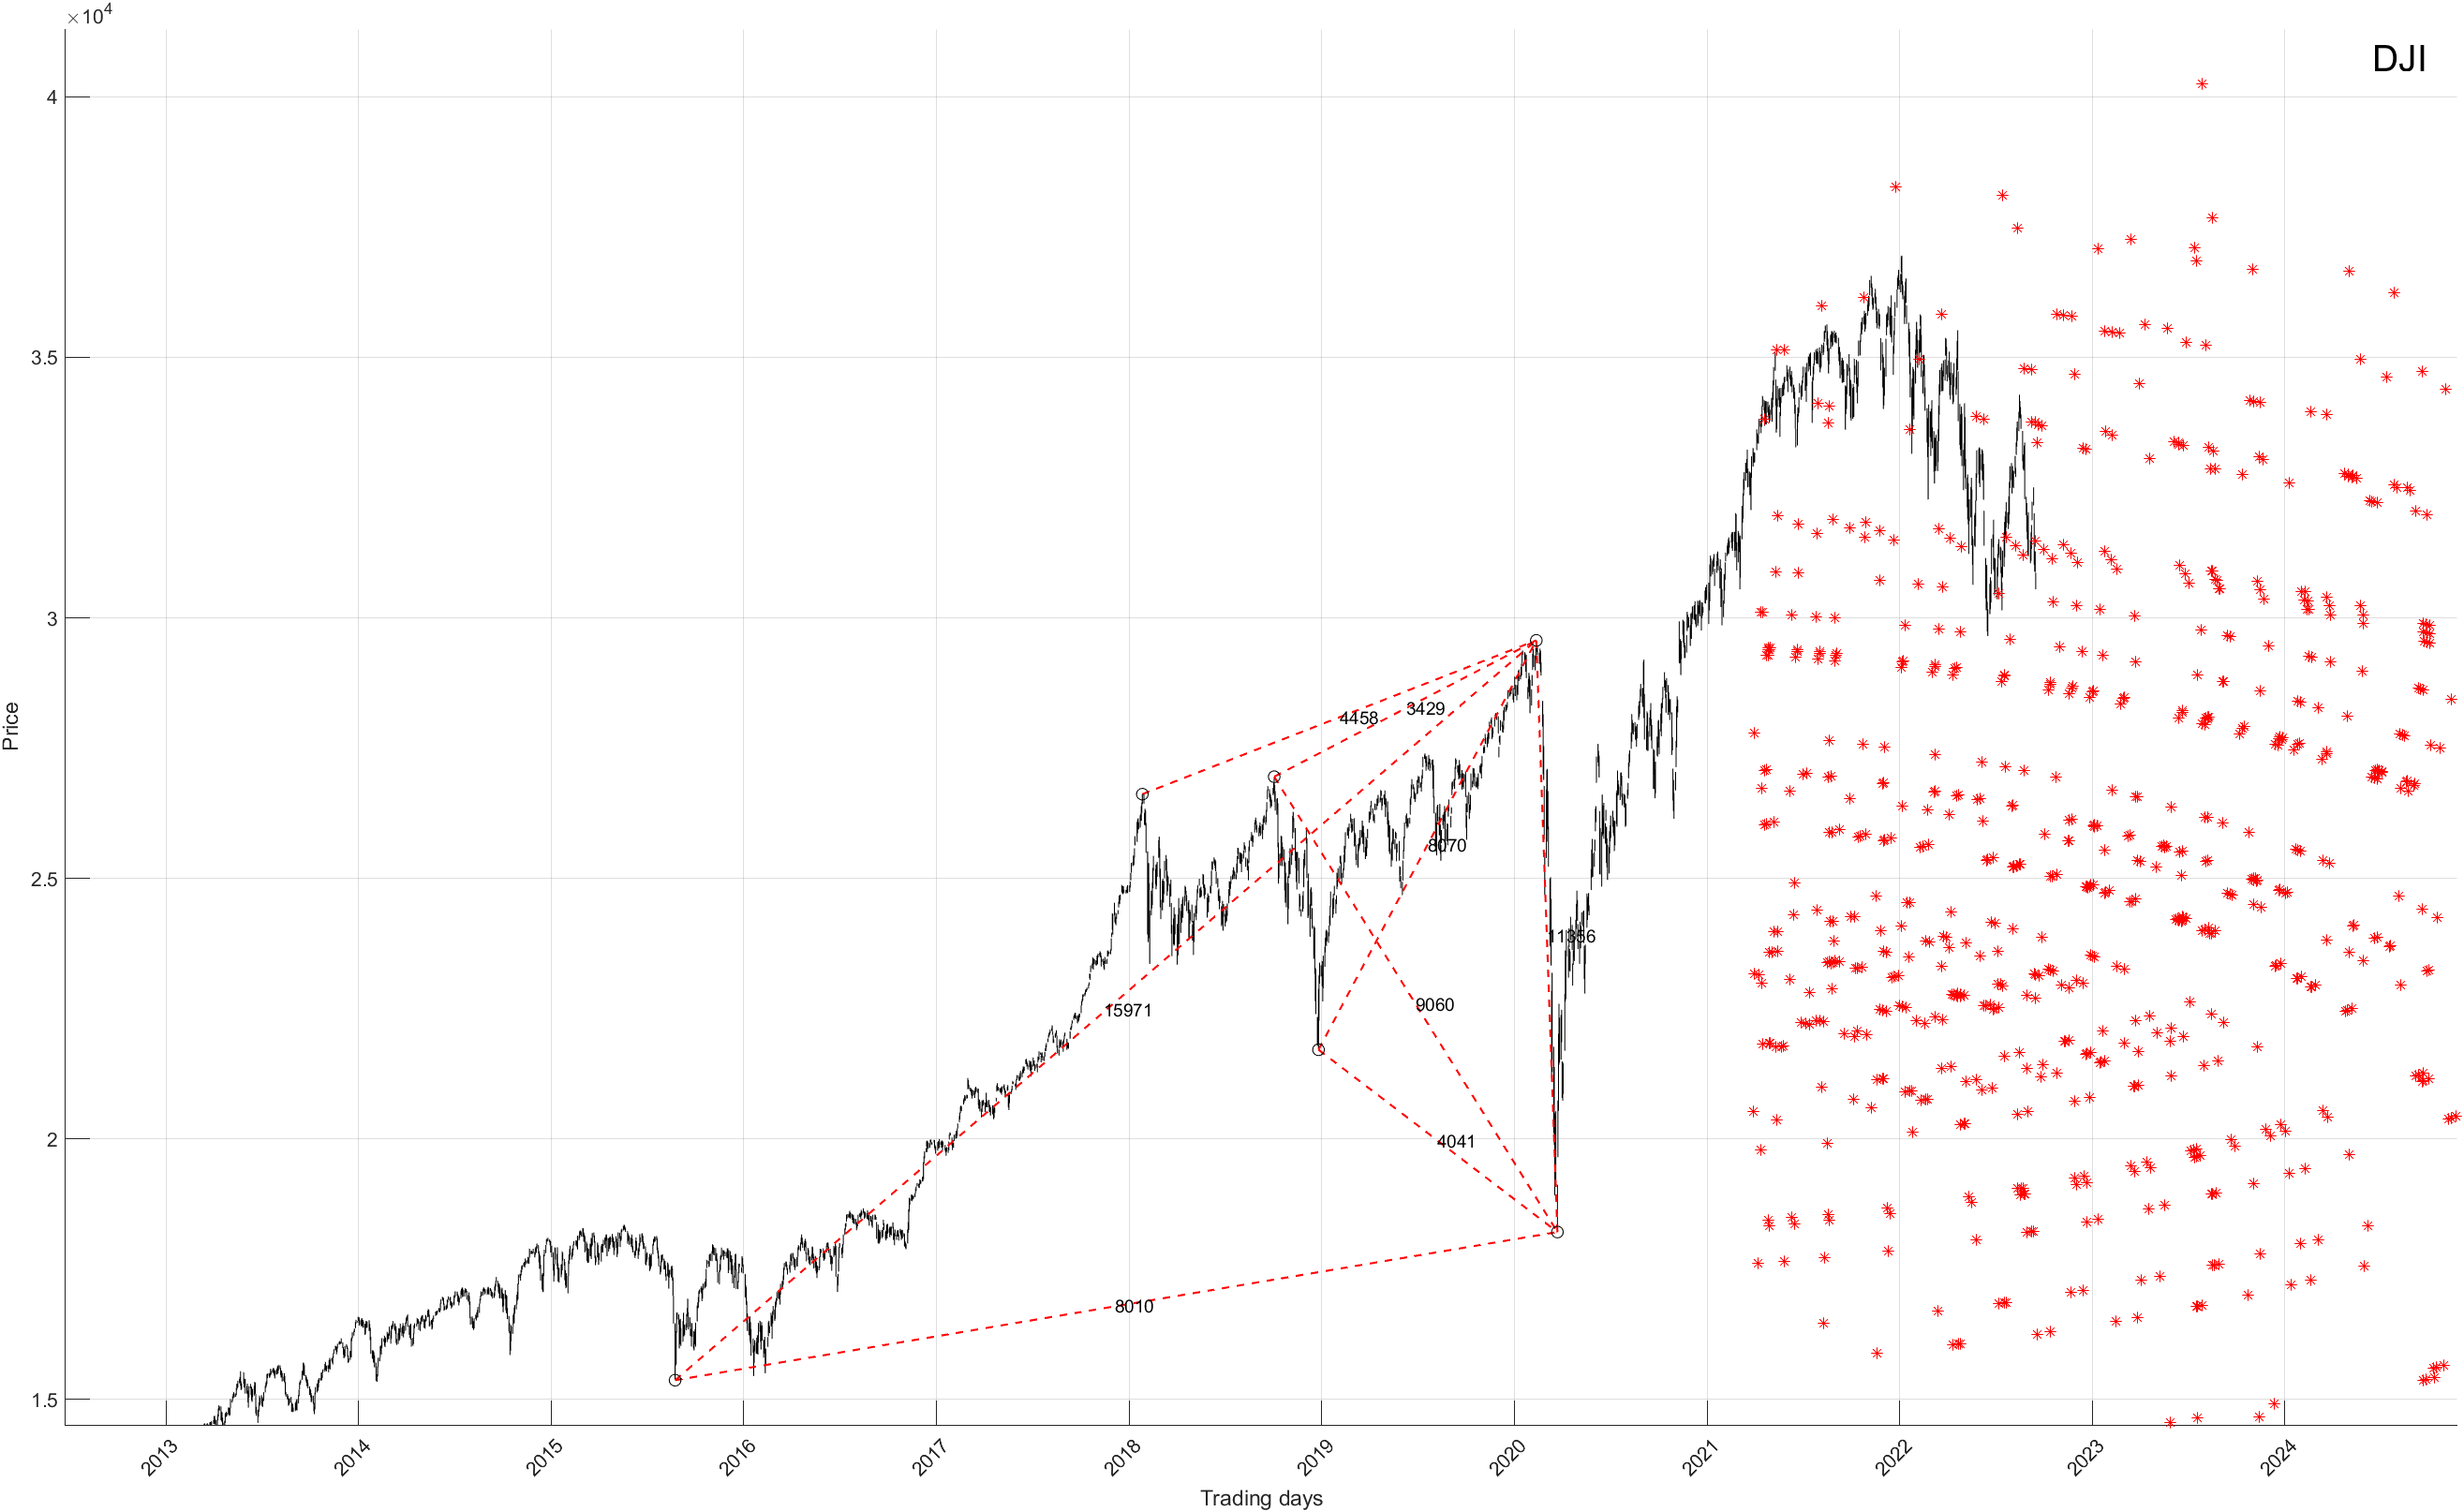
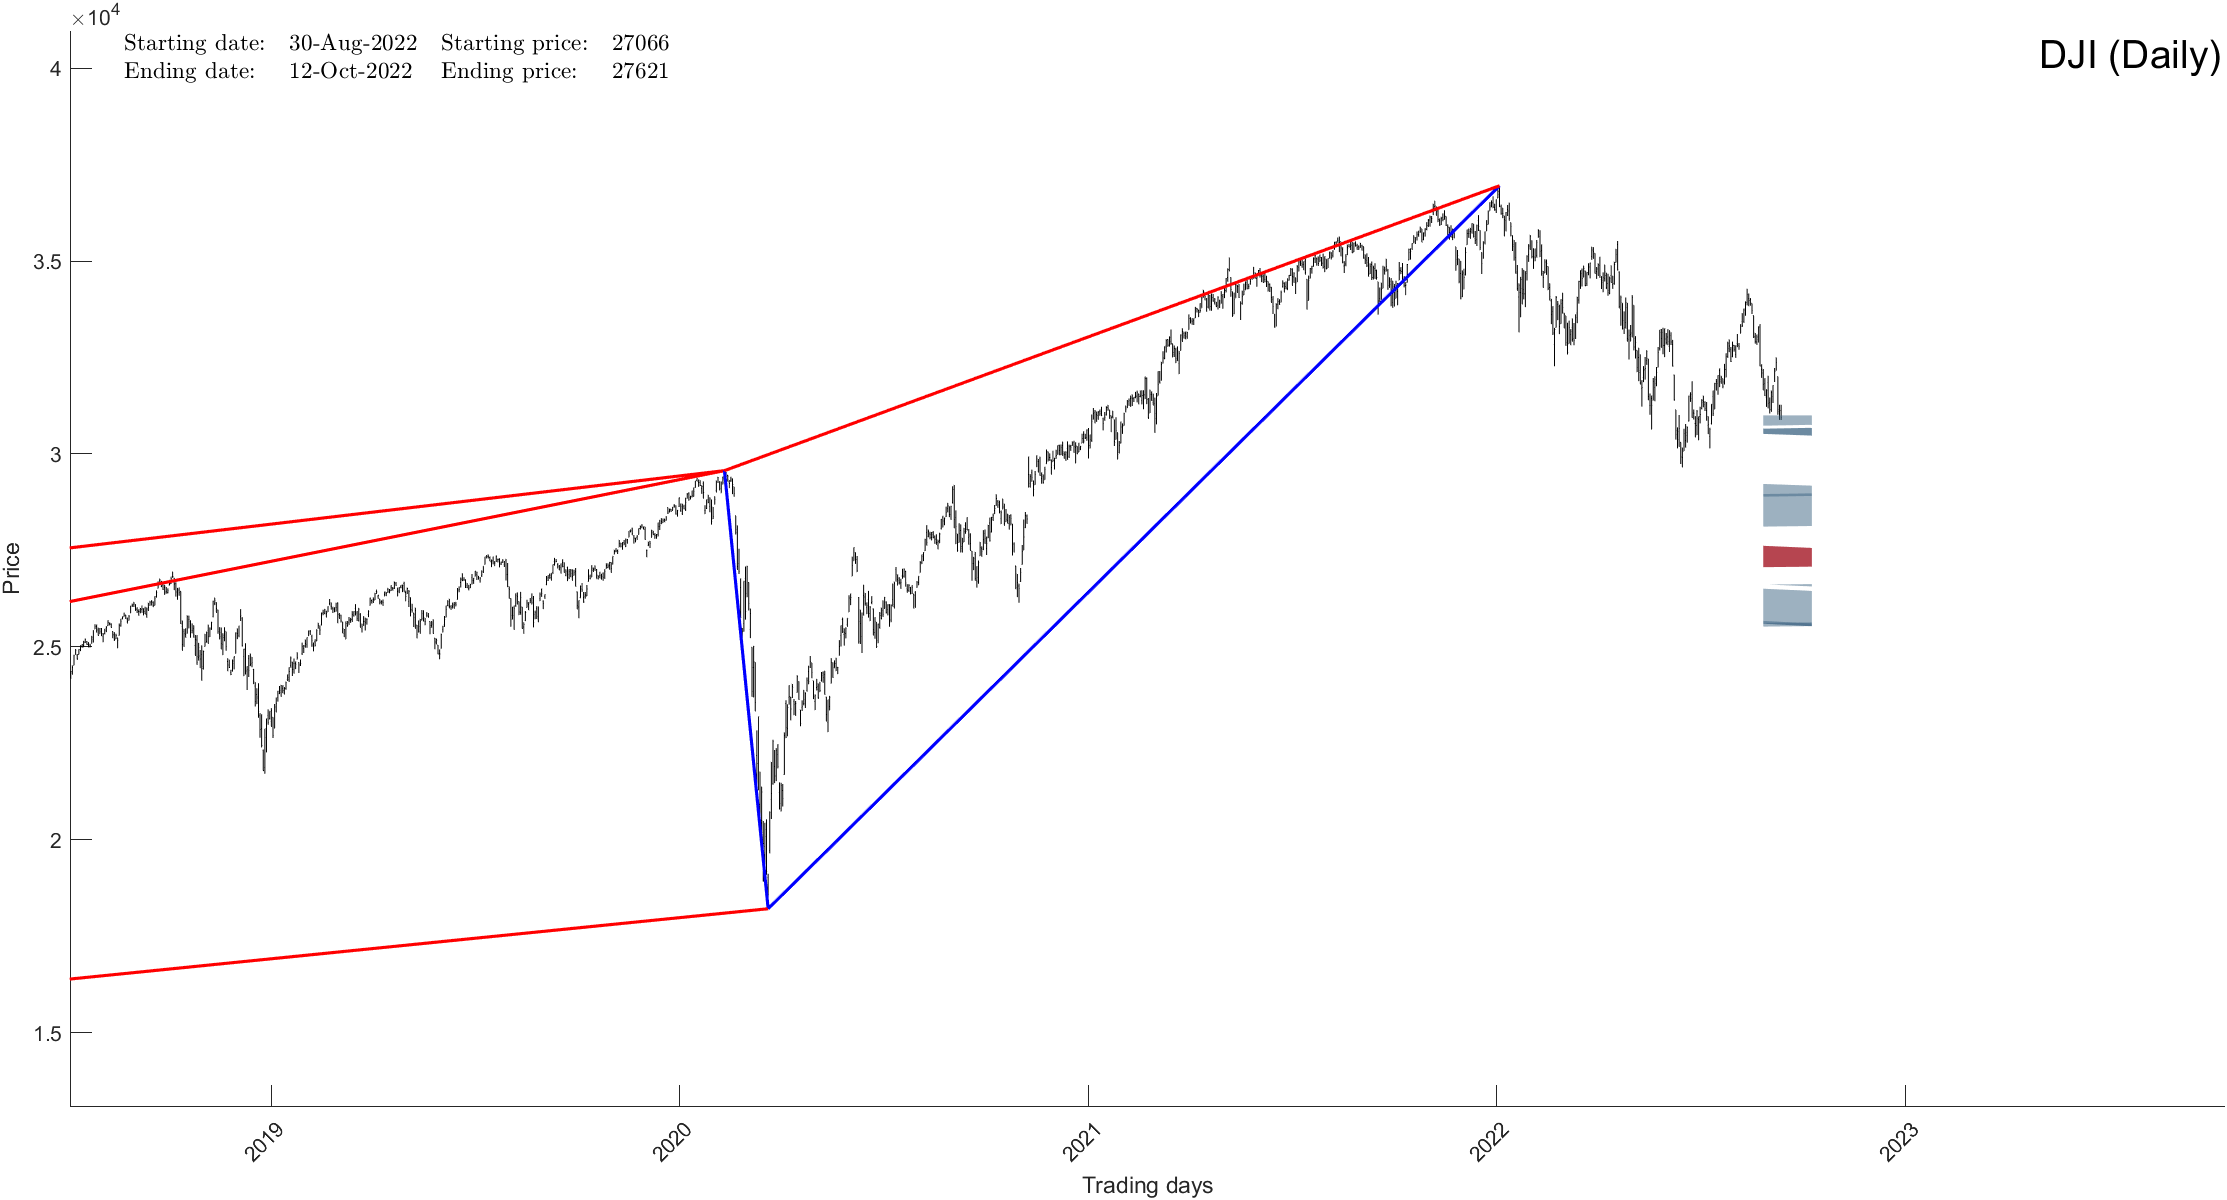
Narrowing Down The Completion Point: Taking the above into consideration our software then filters out most possibilities in order to give us the final answer. Please see the chart below. It is at this juncture that we know with near certainty what the stock market will do next in both price and time. Not only that, based on geometric/timing constructions of the stock market (or any stock) we are then able to calculate what the next move will be, up or down, and its precise PRICE/TIME.
In summary, our software and advanced mathematical calculations show us exactly where the next turning point is, in both PRICE and TIME. Sometimes to within 30 minute resolution. Not only that, it shows you the extent of the upcoming move. If you would like to find out when this next Time/Price turning point is, please CLICK HERE