If you would like to find out what the stock market will do next in both price and time, long-term and short-term, please Click Here. You can also find our MegaCap Stocks Time/Price Projections and our Fast Movers at the same link.
How To Identify Fast Moving Equities & Our Latest Find
I Guess Disney (DIS) Is Not Yet Done Being Woke
As they say, “Go Woke……Go Broke”. Yet, it appears, after a 50%+ haircut in the Disney’s stock, no one at the company has learned that lesson. Well, that might soon change.
Below is our internal report for DIS……
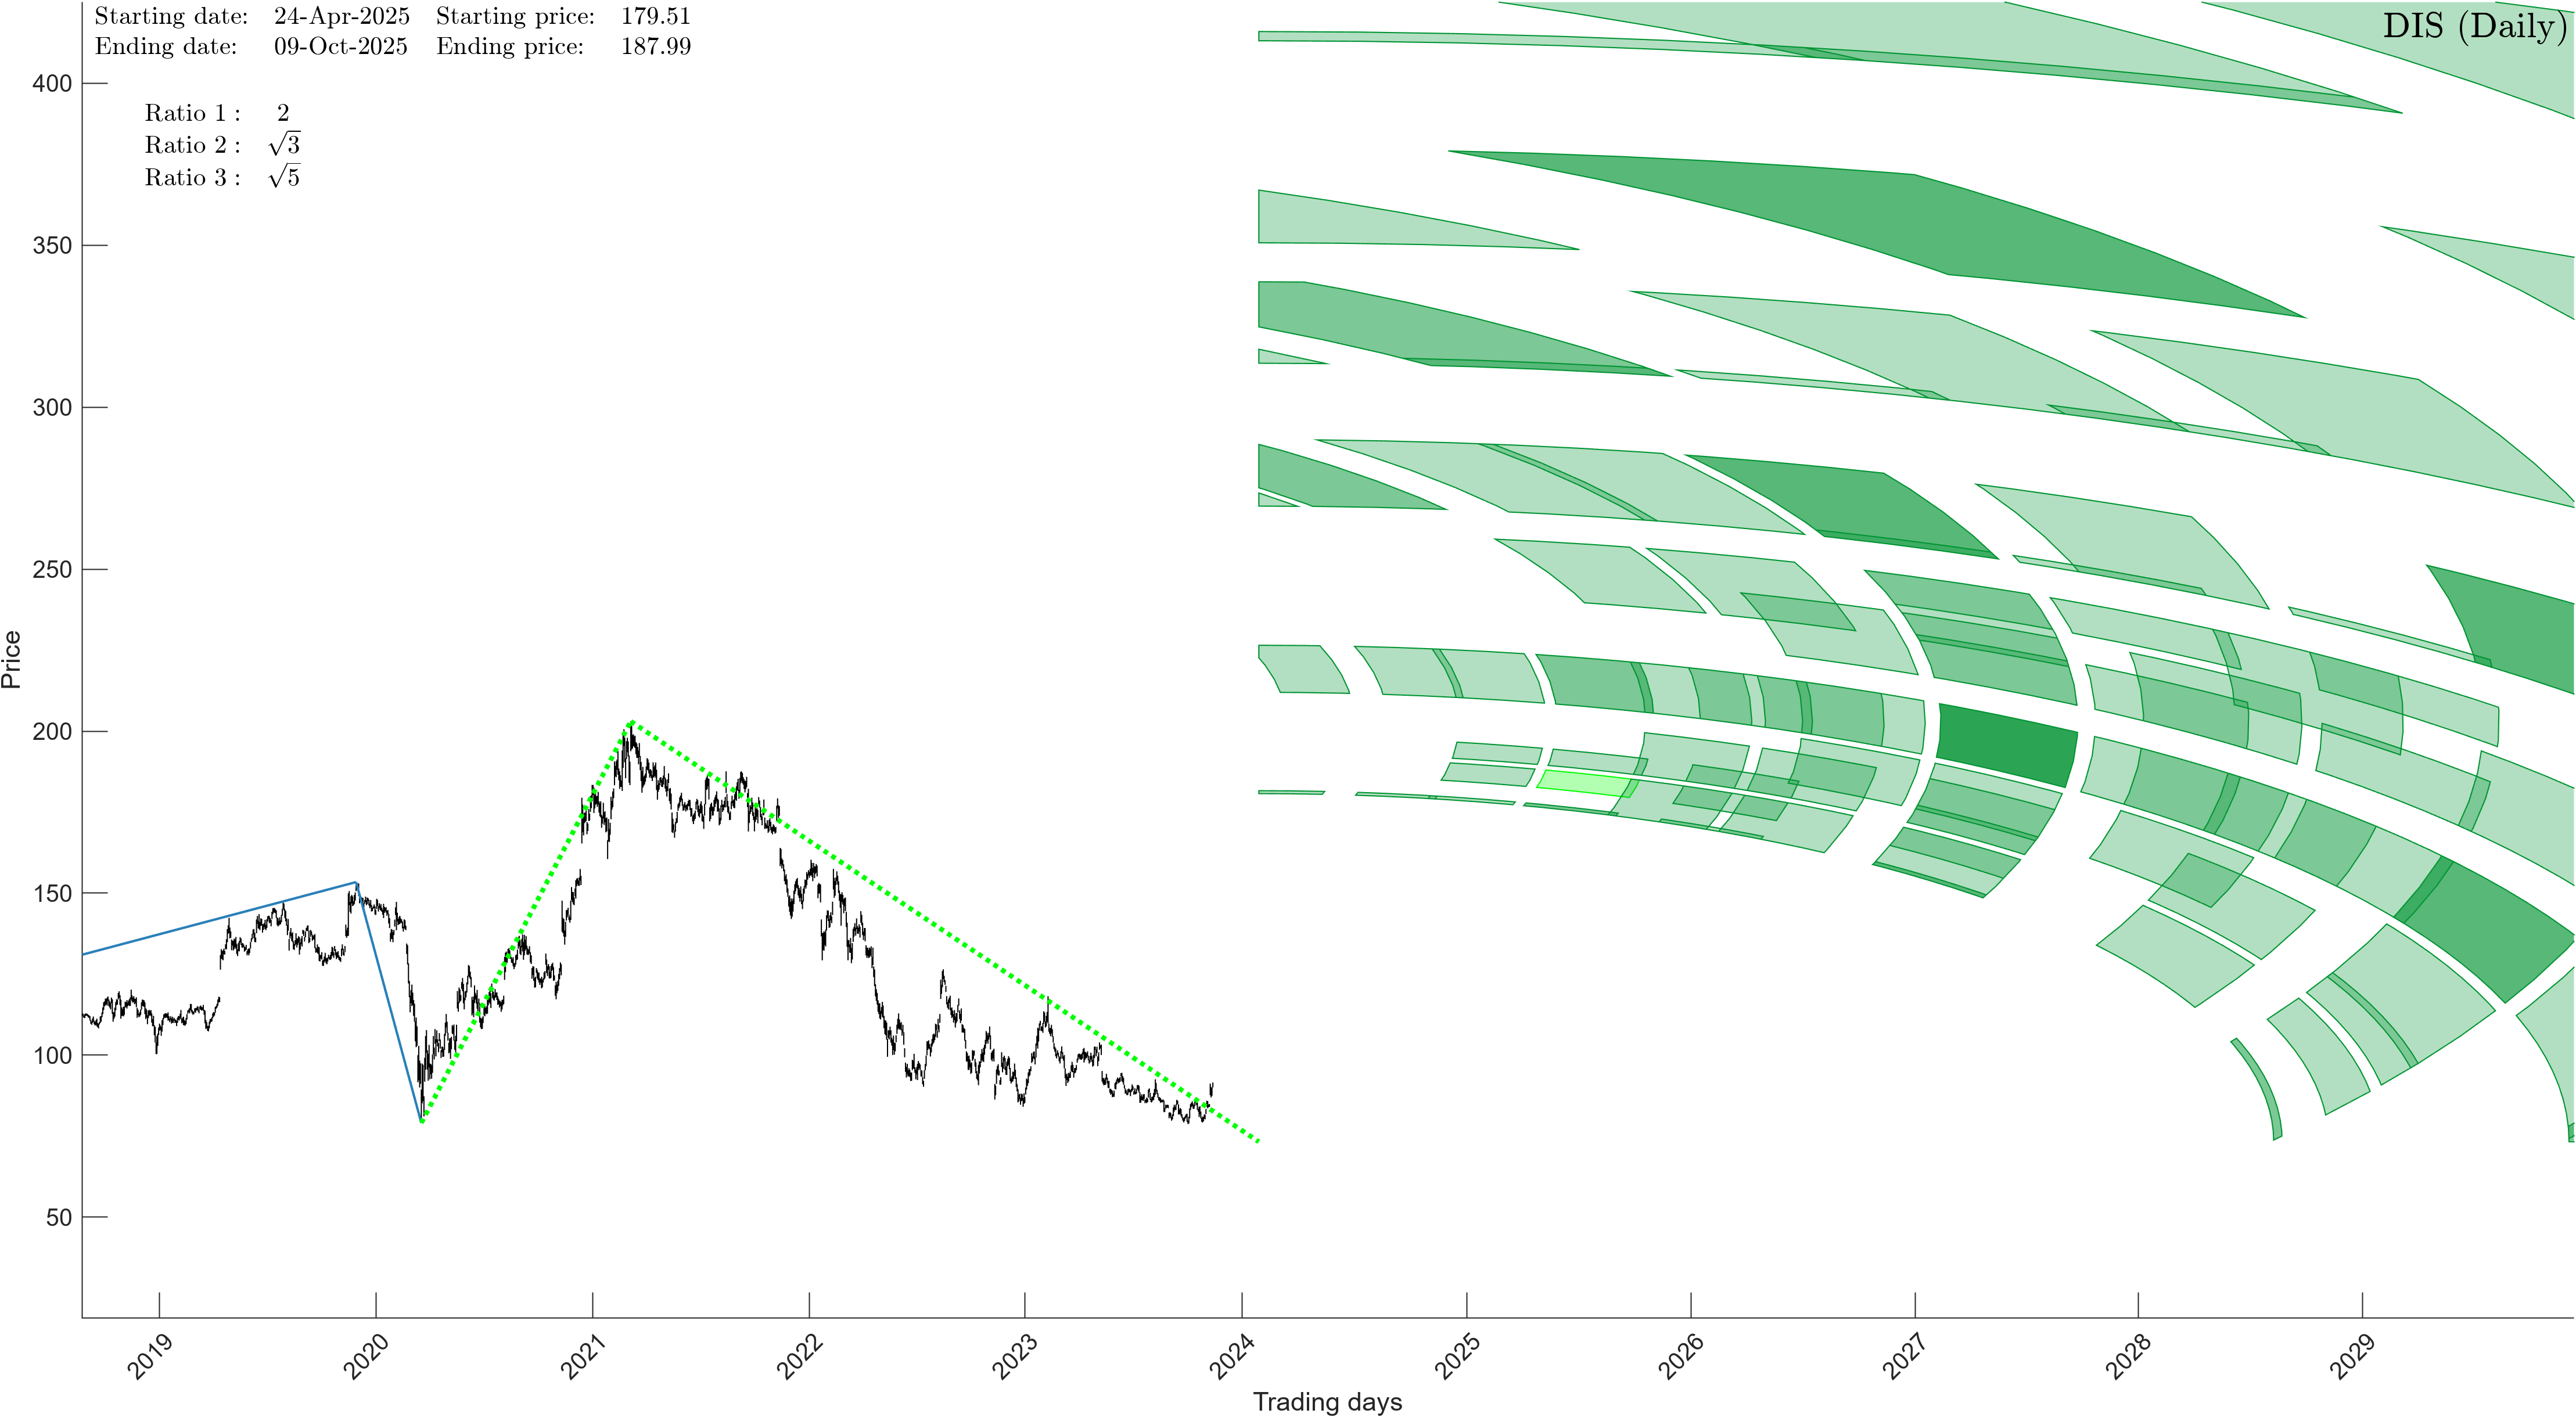
Disney Corp (DIS)
Date of Analysis: November 15th, 2023
Our mathematical and timing analysis for Disney shows the following……
Let me begin by saying that Disney’s time/price parameters are not as clear as some of the other stocks we follow. It is a bit all over the place, but we will do our best……
-
- Disney is looking for an important bottom and recent October low makes very little mathematical and/or timing sense. Meaning, we will re-visit recent lows.
- We have a powerful TIME cycle arriving in XXXX of 2024.
- Possible low PRICE variable stands at $XXXX (+/- $5) which is within the range of the prior low of $78.73. Meaning, once the low is reached in PRICE it shouldn’t be much lower than the prior October 2023 low.
- Once the bottom is put in place Disney should rally into about $XXXX by mid XXXX.
In summary, Disney’s analysis is not as clear as we would prefer. Yet, once the bottom is put in place, most likely around XXXX of 2024 and at around $XXXX, DIS should rally into $XXXX scheduled by mid 20XX.
If you would like to find out what the stock market will do next in both price and time, long-term and short-term, please Click Here. You can also find our MegaCap Stocks Time/Price Projections (such as Disney above) and our Fast Movers at the same link.
Investment Grin Of The Day
The Demise Of The Dollar Has Been Greatly Exaggerate
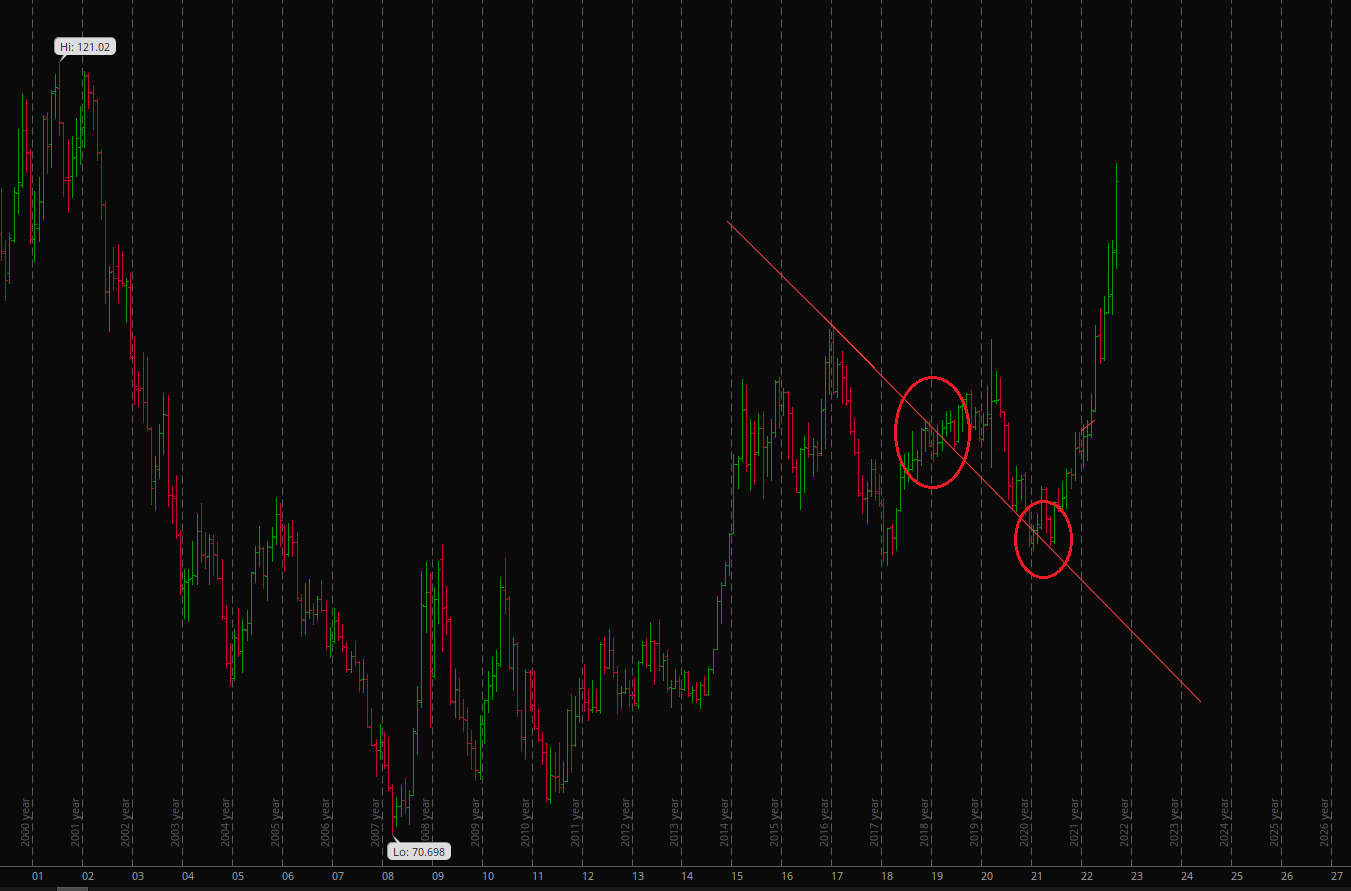
According to some the stock market cannot rally until the Buck cools off. Don’t look for a stock market bottom until a soaring dollar cools down. Here’s why.
What a bunch of nonsense. Sure, any market bounce/rally will likely coincide with the DXY selling off, but there is very little long-term correlation between the overall market and the USD. Just look at the chart above.
Speaking off, we have been following the chart above for years. There are two points of interest on the chart. The first circle in 2019 is when the market crossed an extremely important support/resistance line, line that most people are not aware of, clearly suggesting a long-term rally was coming.
The second hit on the line occurred in 2021 when this same line acted as support. I remember it very well. At that time the Dollar bears and Gold/Bitcoin enthusiasts proclaimed, once again, the dollar was about to collapse to near zero while everything else would soar. At this very same time we were looking for a bottom.
As you can see from the chart above, the DXY doesn’t have must of a resistance until it hits 120 levels. Now, we are not saying it would happen overnight, but those betting on the Dollar’s demise might want to re-consider. At least for the time being.
We will be publishing our updated dollar TIME/PRICE analysis in a matter of weeks. If you would be interested in seeing it in full, please Click Here
As Markets Bet On FED’s Mercy ….. Treasury Bills Suggest No Mercy Will Be Given
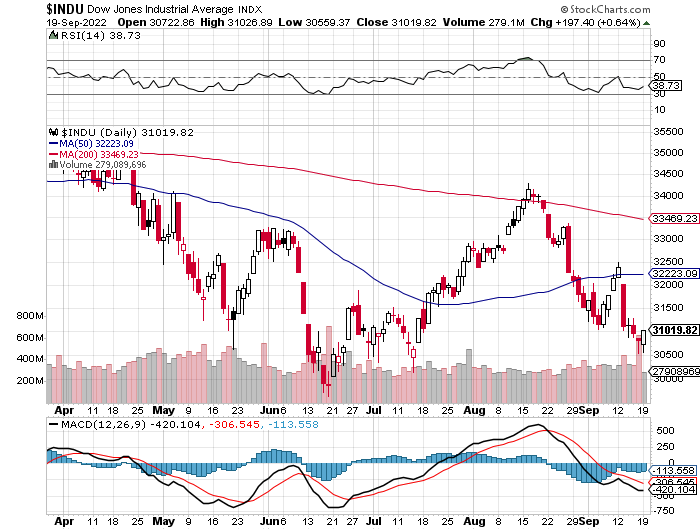
9/16/2022 – A positive day with the Dow Jones up 197 points (+0.64%) and the Nasdaq up 86 points (+0.76%)
It’s a well know fact that the FED follows 3 and 6 month Treasury rates when setting their benchmark. Last time the FED raised interest rates by 75 basis points was in late July. At that time 6 Month Treasury was at around 2.85% and today, at 3.87%. Let’s round up and say 1% higher.
That suggests the FED would have to hike as much as 1% just to catch up. Will they or won’t they is not as important as what they will say. The bulls are praying for a clear indication that the rate hikes are either nearly done or will slow. And the bears, of course, are salivating over a 1% hike with no end in sight.
What will actually happen is likely somewhere in between. Luckily, you don’t have to guess how the stock market will react. That has already been pre-determined. Allow me to explain how our work knows where the market will either top or bottom, plus, exactly WHEN it will happen.
Dow’s Long-Term Cycle Composite: At least one of them. Our work suggests the stock market or individual stocks have multiple composites running its cycles at any given time. Not only that, there are up and down composites, that are responsible for all tops and bottoms, short-term and long-term. The one below gives you a pretty good idea about what happens next and/or when to anticipate major tops and bottoms.
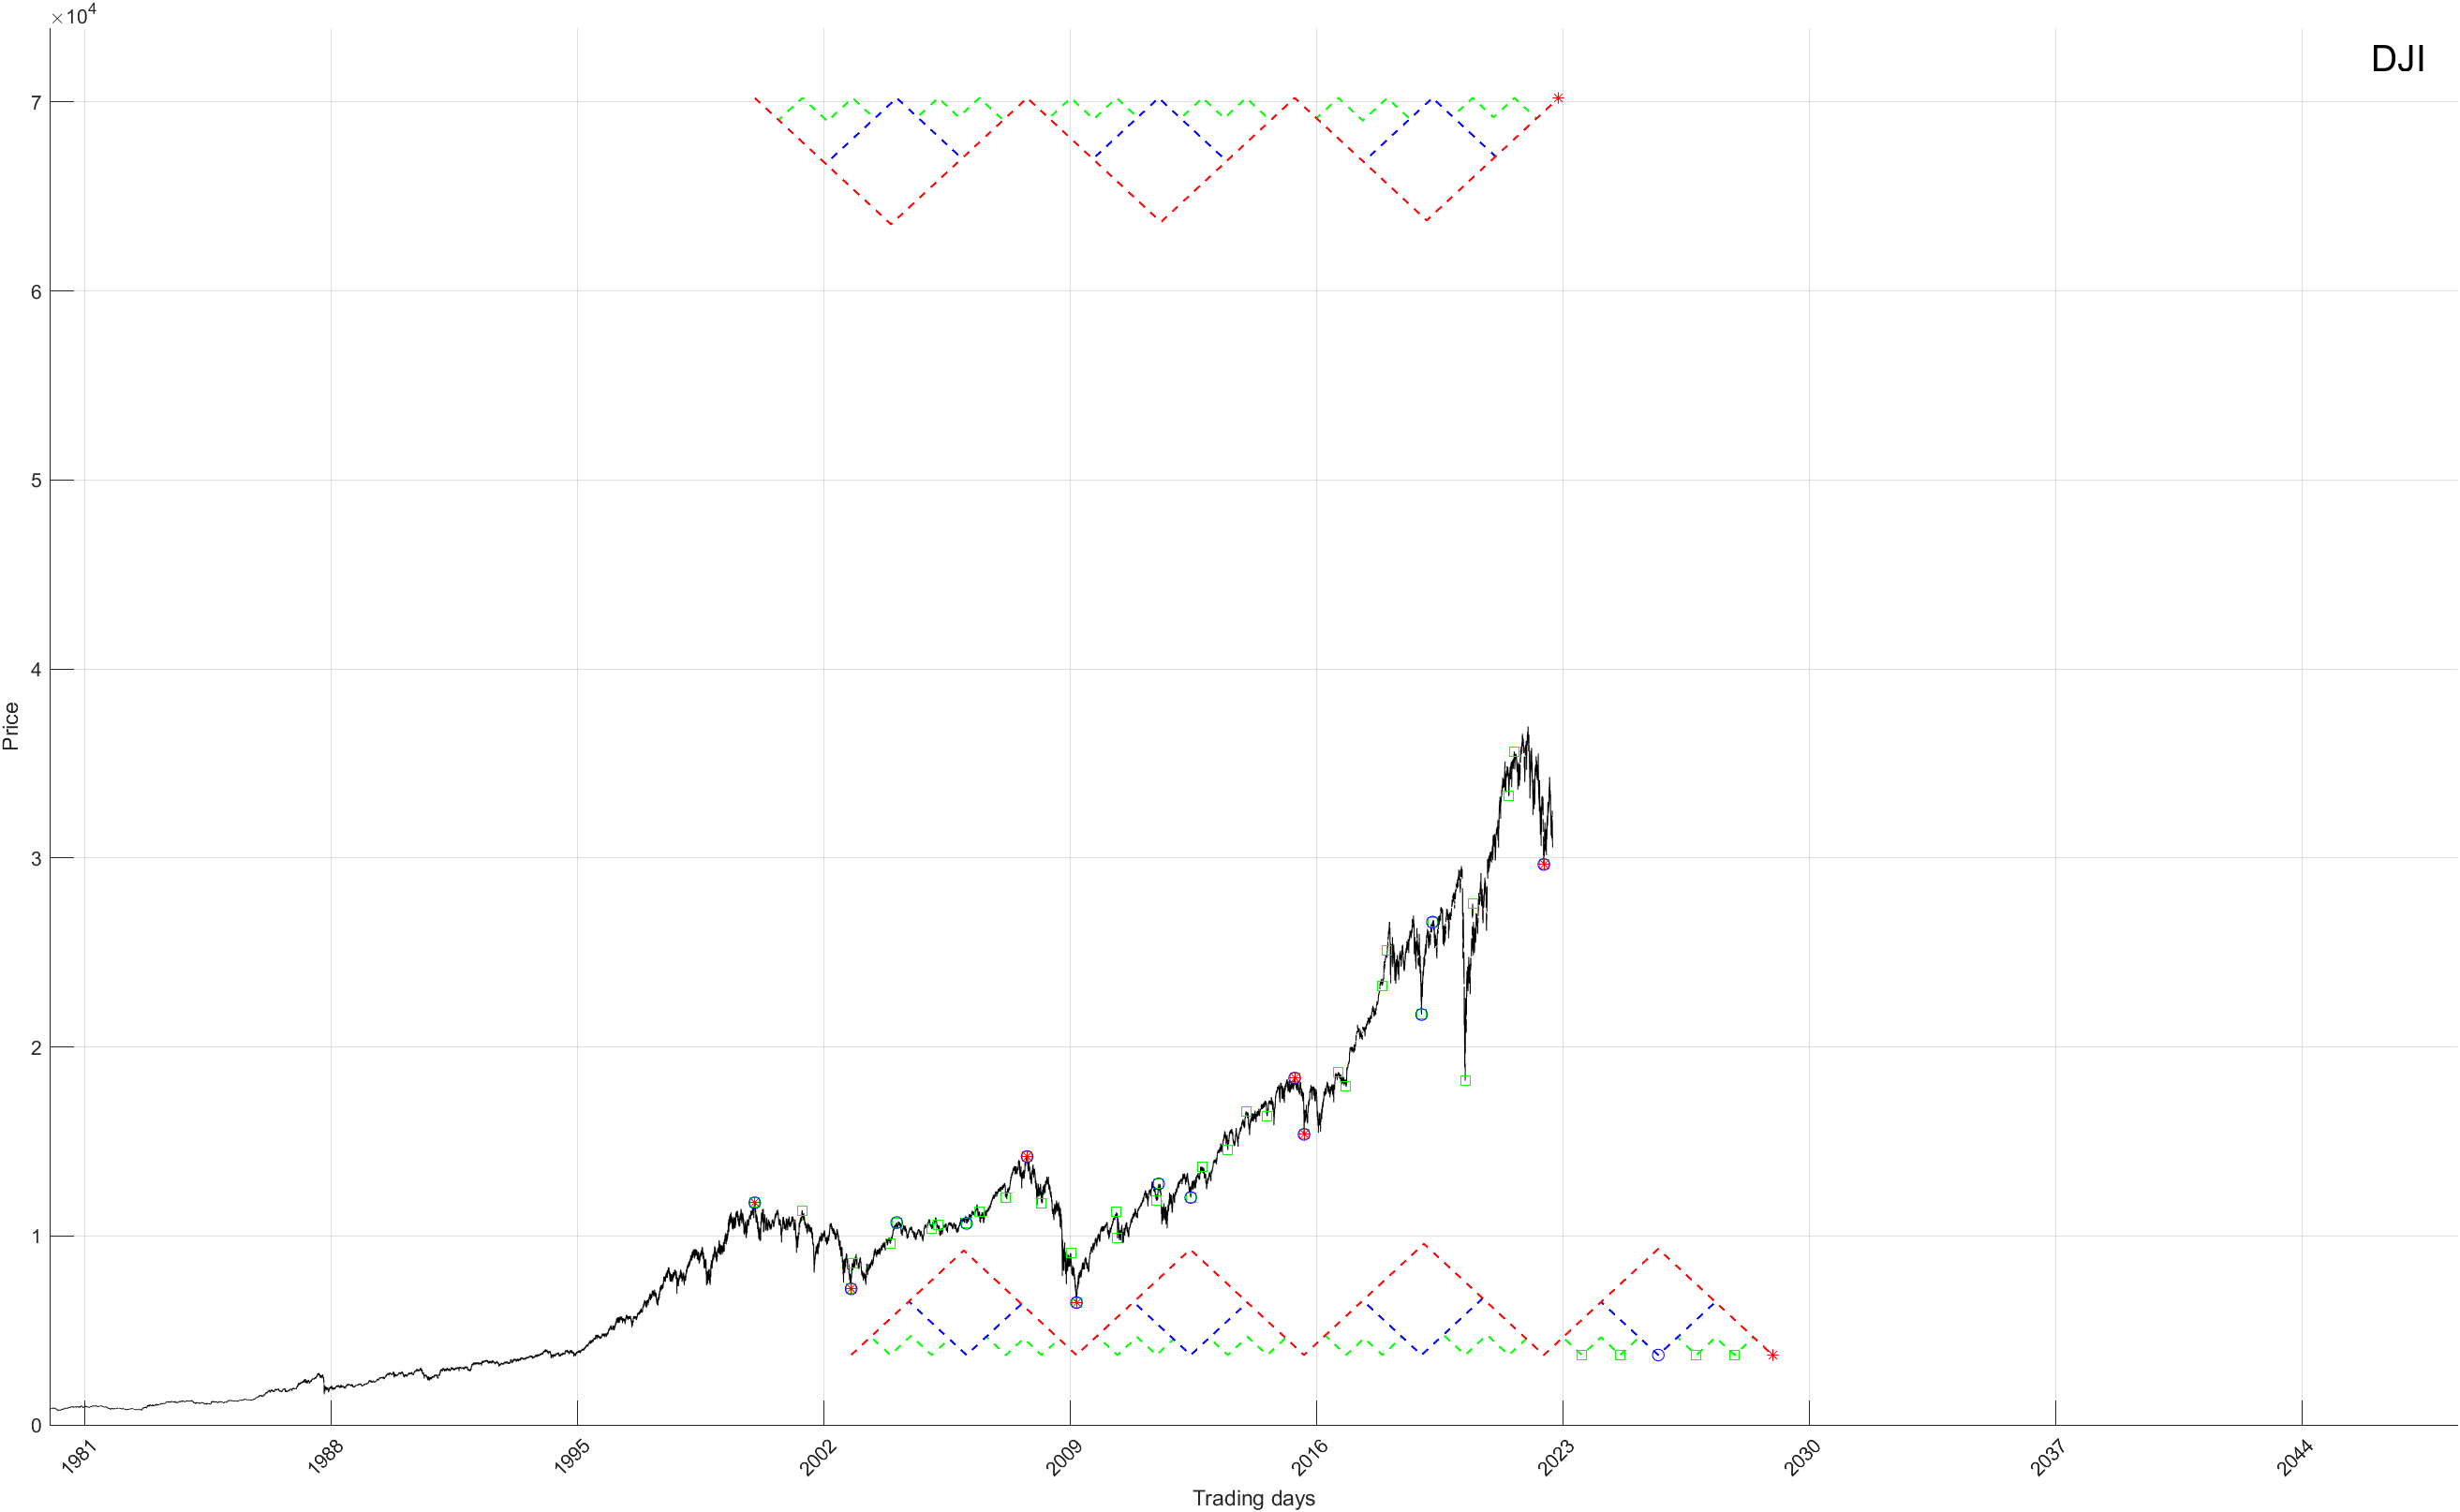
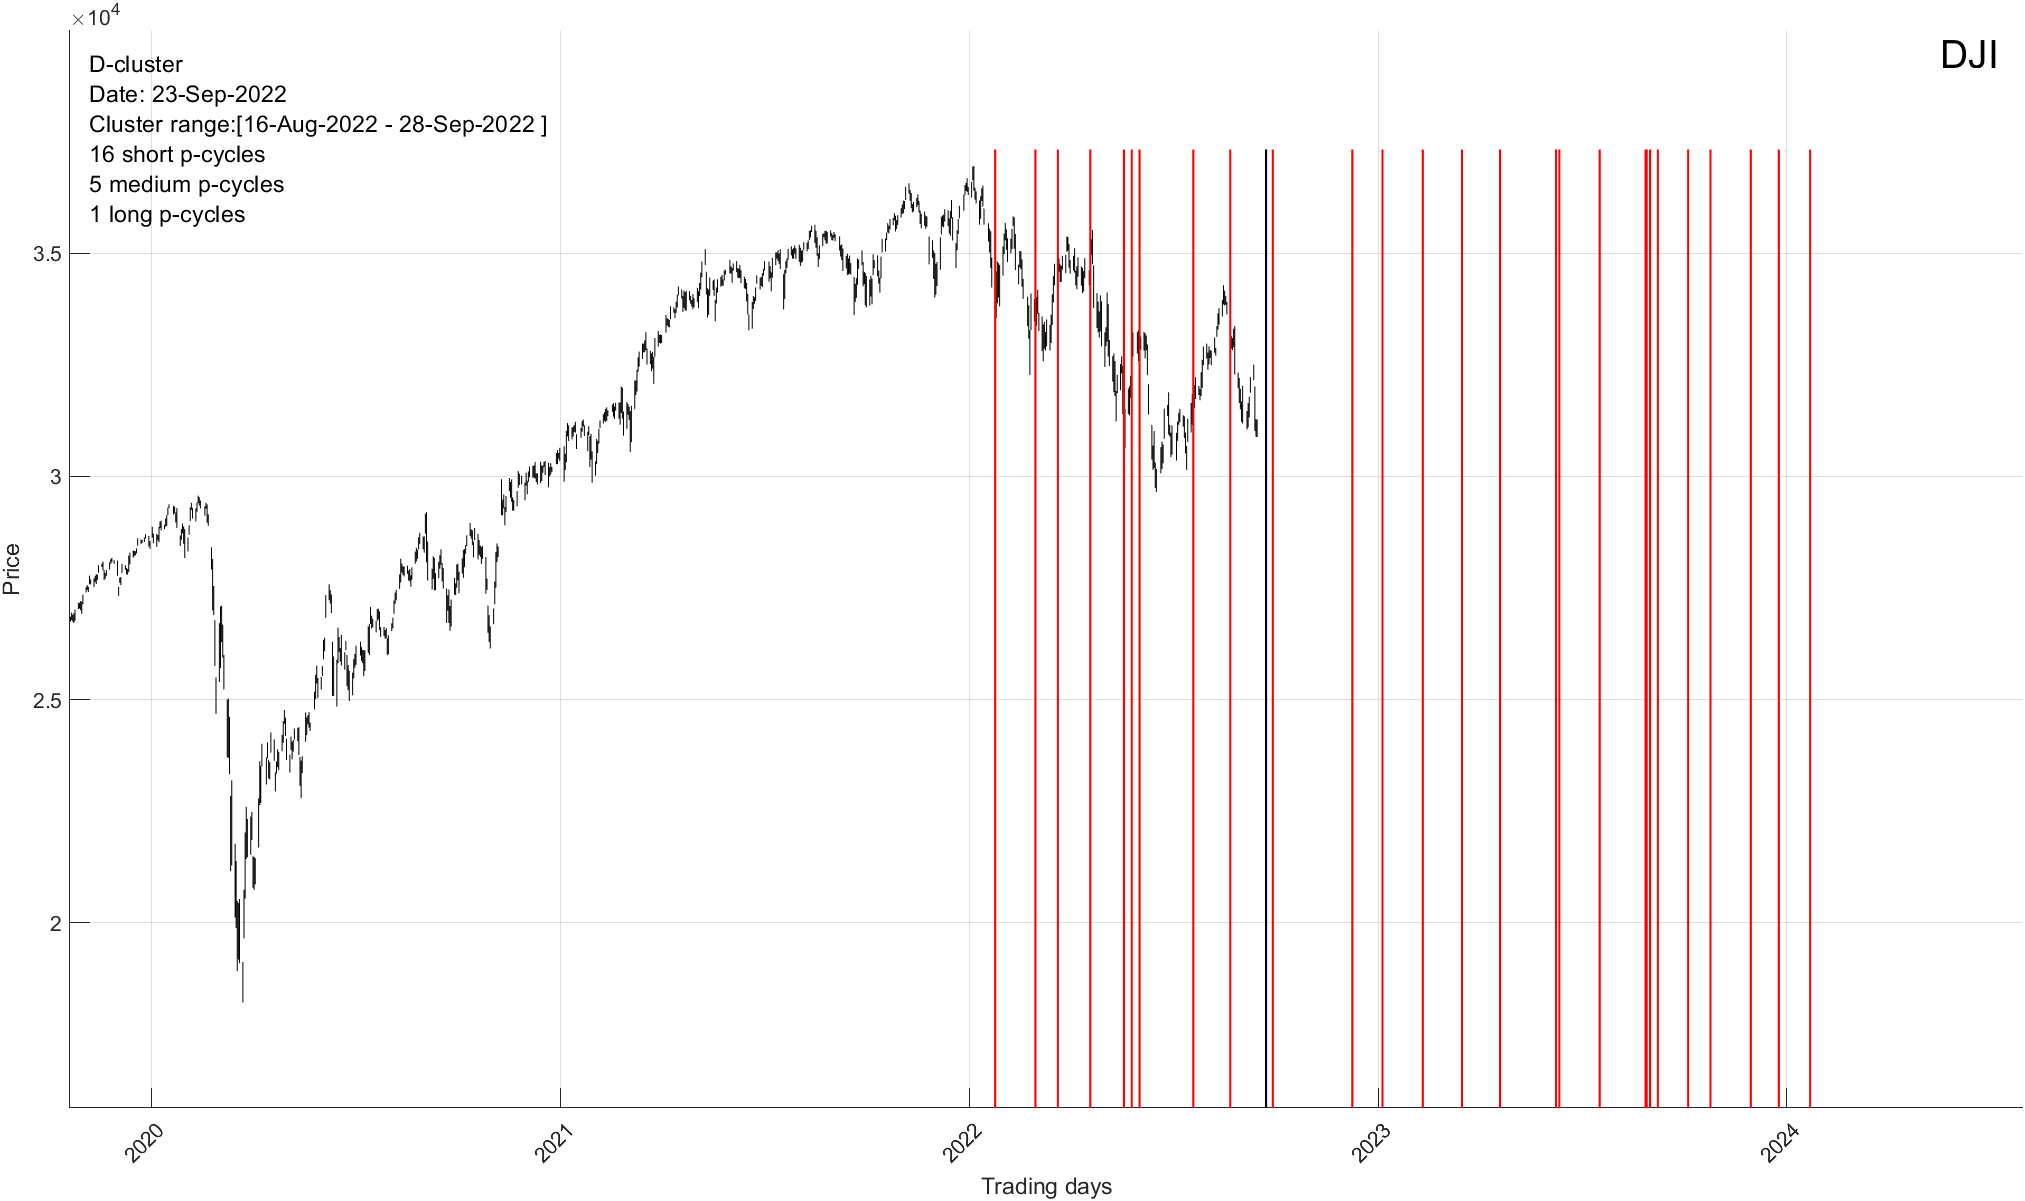
TIMING Clusters: Each line represents a timing cluster where a number of different cycles (independent of composite cycles above) come together and indicate a change in trend. This change can be long-term or short-term in nature. The next TIME cluster of interest arrives on September 19th (+/- 2 trading days). Will it spark a rally or be a dud? Find out below.
Market’s Structural Composition: As our theory suggests, the market moves in multidimensional space. When it does it traces out certain lattice structures in 3D space based on prior moves. In other words, all future movements are geometrically precise in both PRICE and TIME. For instance, dots below represent all possible future turning points. Now, most of them can be filtered out to get a 95% accurate read.
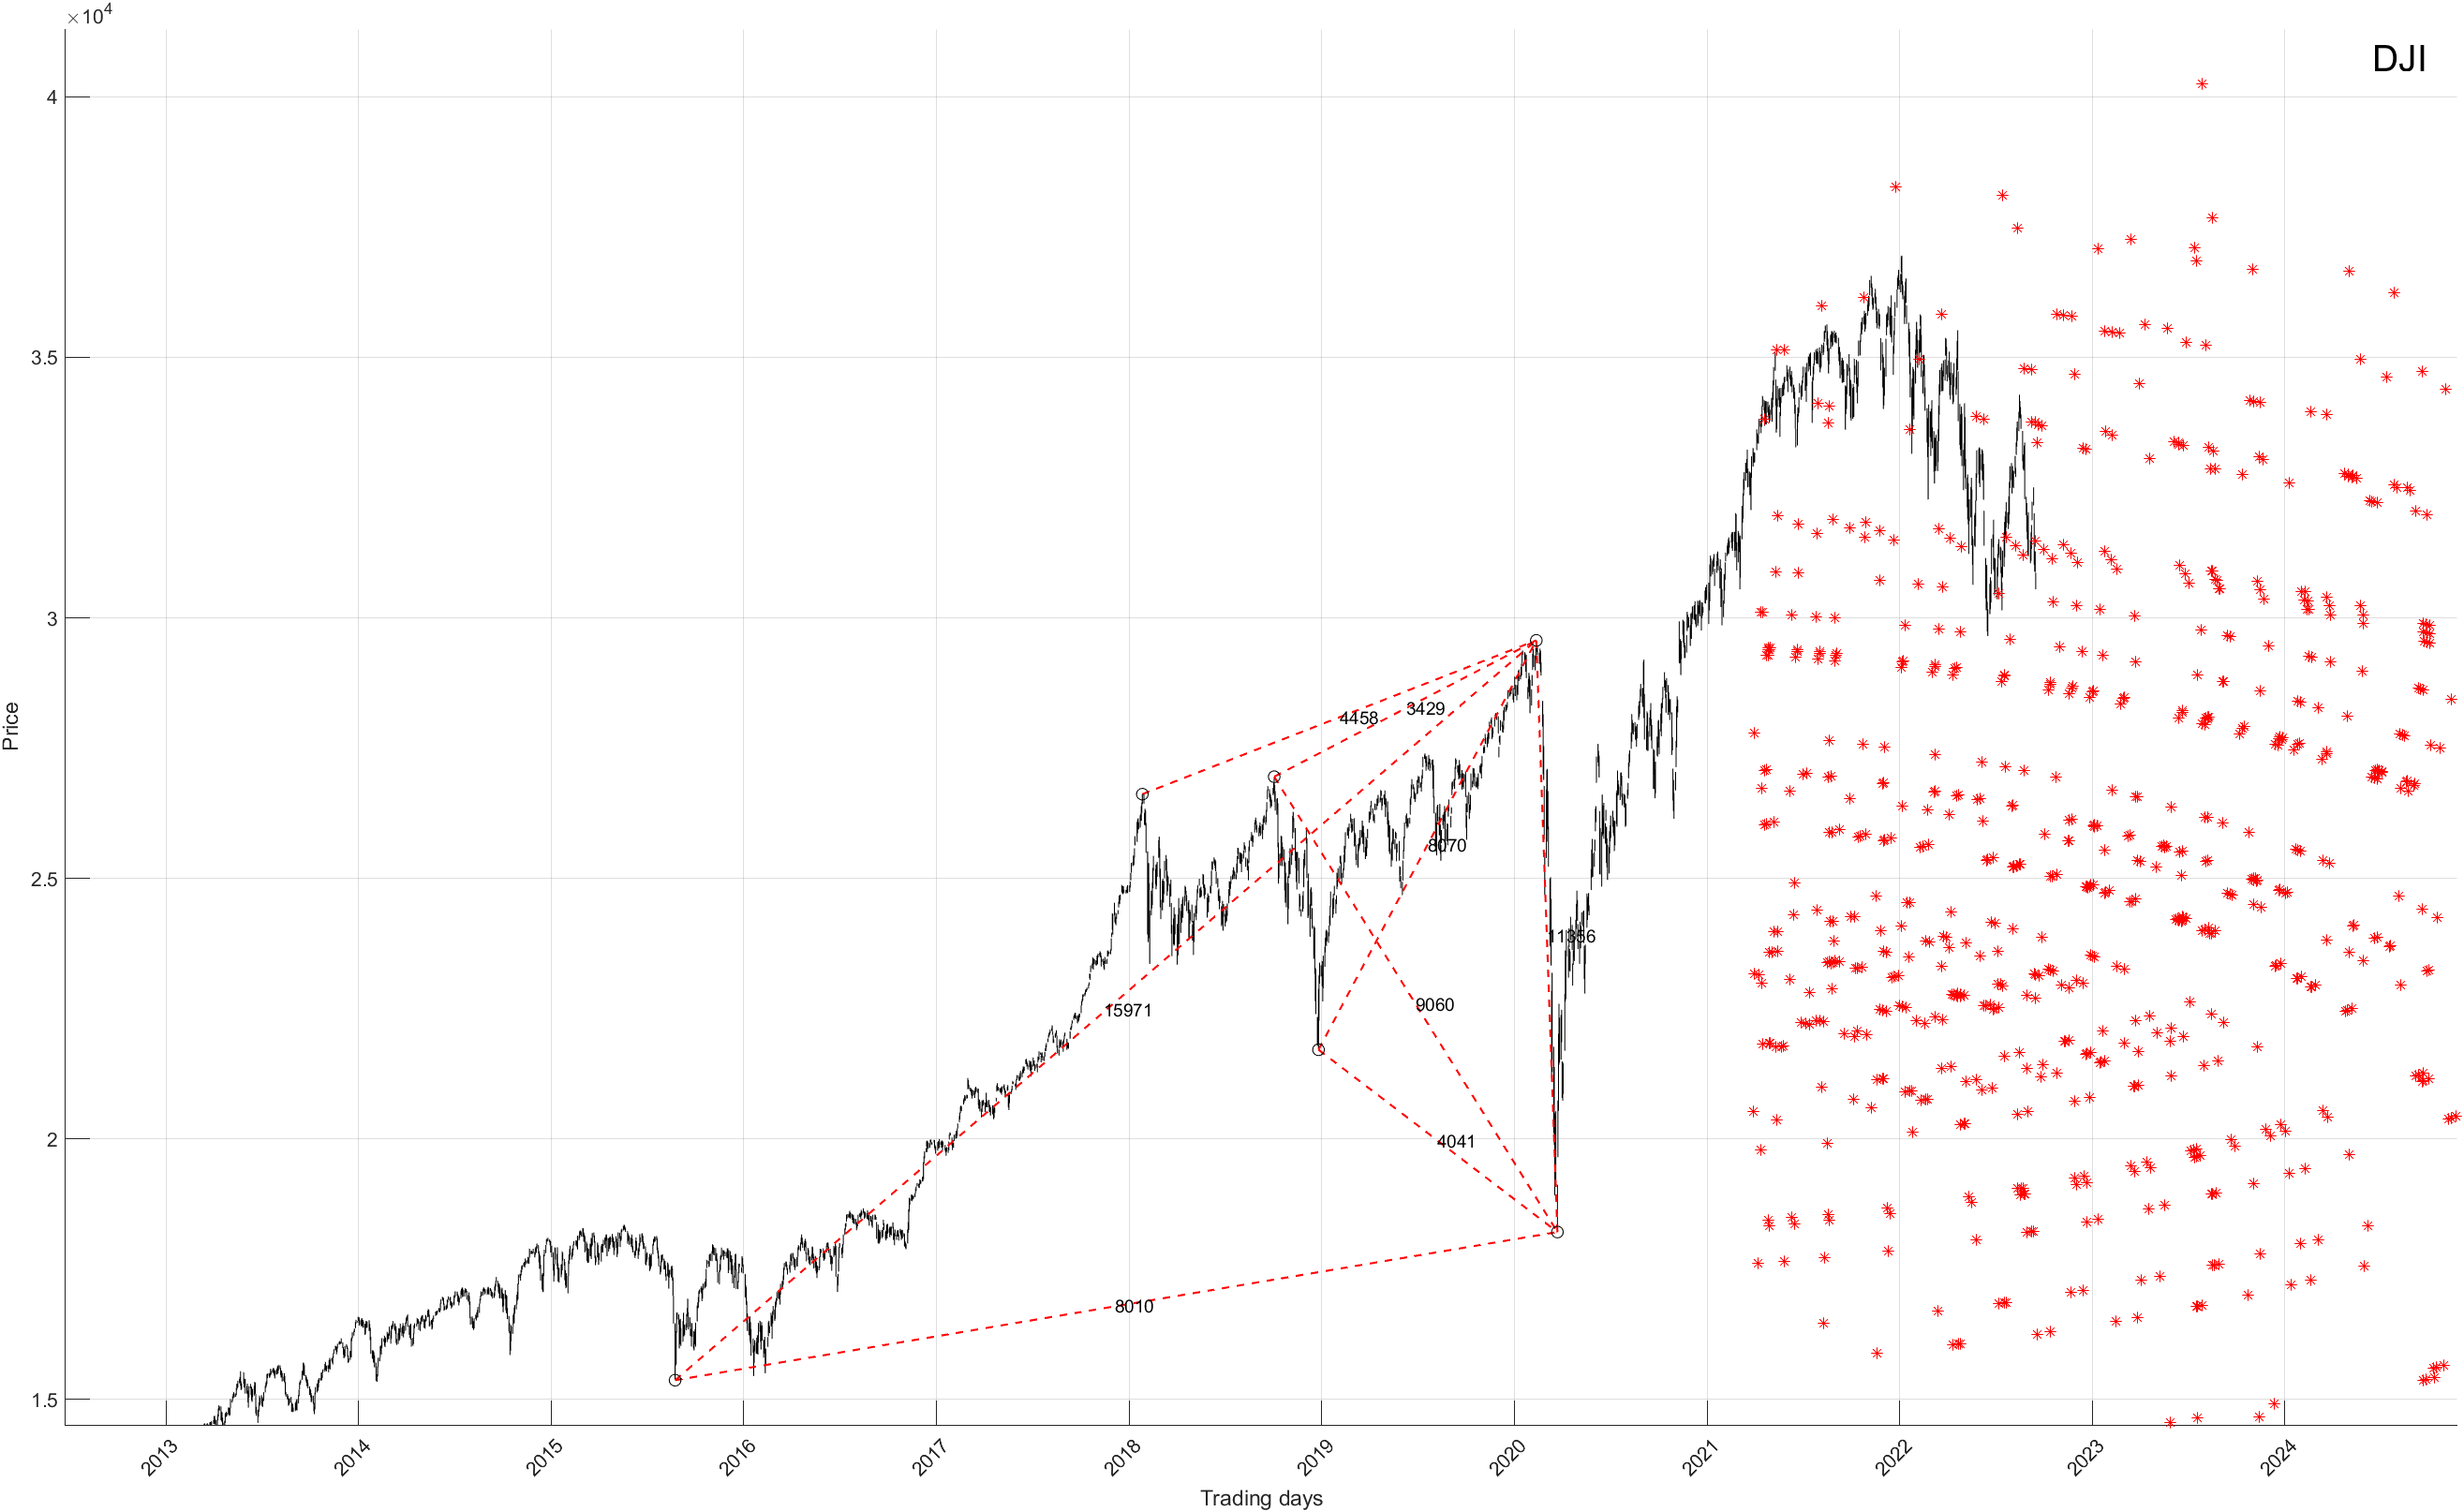
Narrowing Down The Completion Point: Taking the above into consideration our software then filters out most possibilities in order to give us the final answer. Please see the chart below. It is at this juncture that we know with near certainty what the stock market will do next in both price and time. Not only that, based on geometric/timing constructions of the stock market (or any stock) we are then able to calculate what the next move will be, up or down, and its precise PRICE/TIME.

In summary, our software and advanced mathematical calculations show us exactly where the next turning point is, in both PRICE and TIME. Sometimes to within 30 minute resolution. Not only that, it shows you the extent of the upcoming move. If you would like to find out when this next Time/Price turning point is, please CLICK HERE
Bearish Armageddon Or One Final Bear Trap ?
If you an Elliott Wave practitioner, fundamental analyst or a technical junkie, you are likely starting to sweat. Either from extreme levels of excitement or sheer panic.
The chart below from Daneric’s Elliott Waves (great blog btw) is a good representation of the subject matter. According to this Elliott Wave analysis, the stock market is about to collapse in a massive Wave 3 of 3.
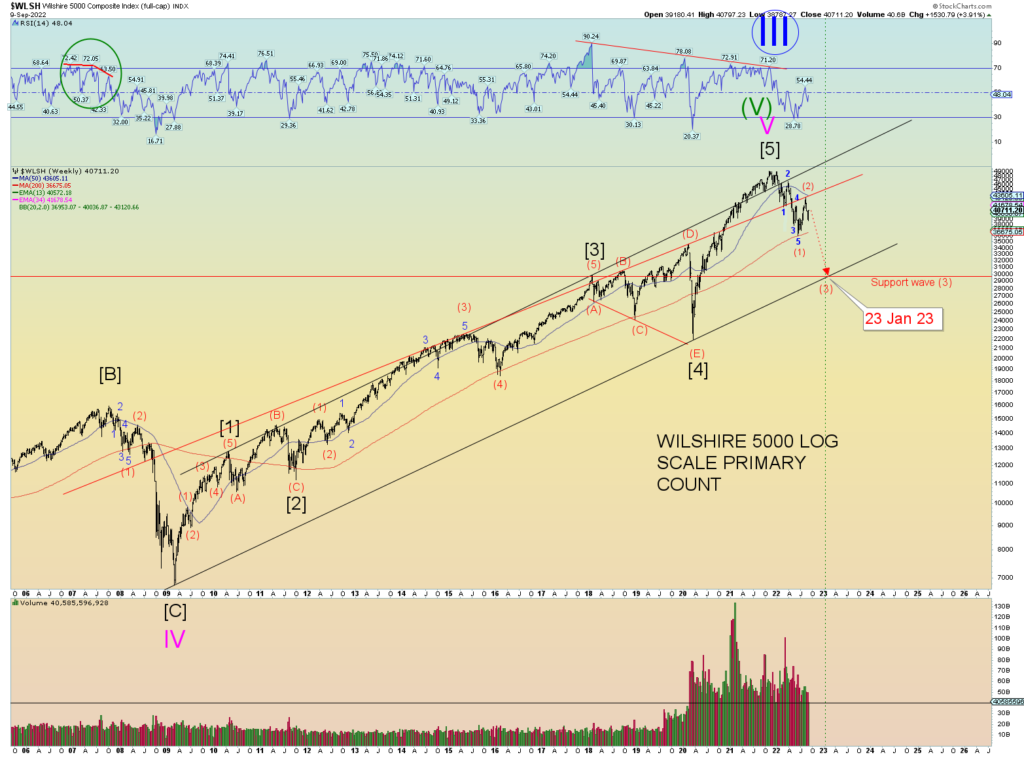
Numerous fundamental and technical data points would tend to agree with this assertion. Just today I read the following US Yield Curve Set to Invert by Most in 40 Years
Is that bad?
It looks bad. As you know, yield curve inversions tend to precede recessions and a customary stock market haircut.
Yet, there is a clear cut way to determine what the stock market will do next and it might not be what you expect. Let me start today with the following two charts.
Up/down projection cycles below is just one data point in our extensive set of TIMING tools. Please note the two long-term cycles involved, one bottoming in mid 2022 and the other one topping in early 2023. Quick note, please ignore the cyclical bottom our software has identified in mid June, there is a certain margin of error associated with it.
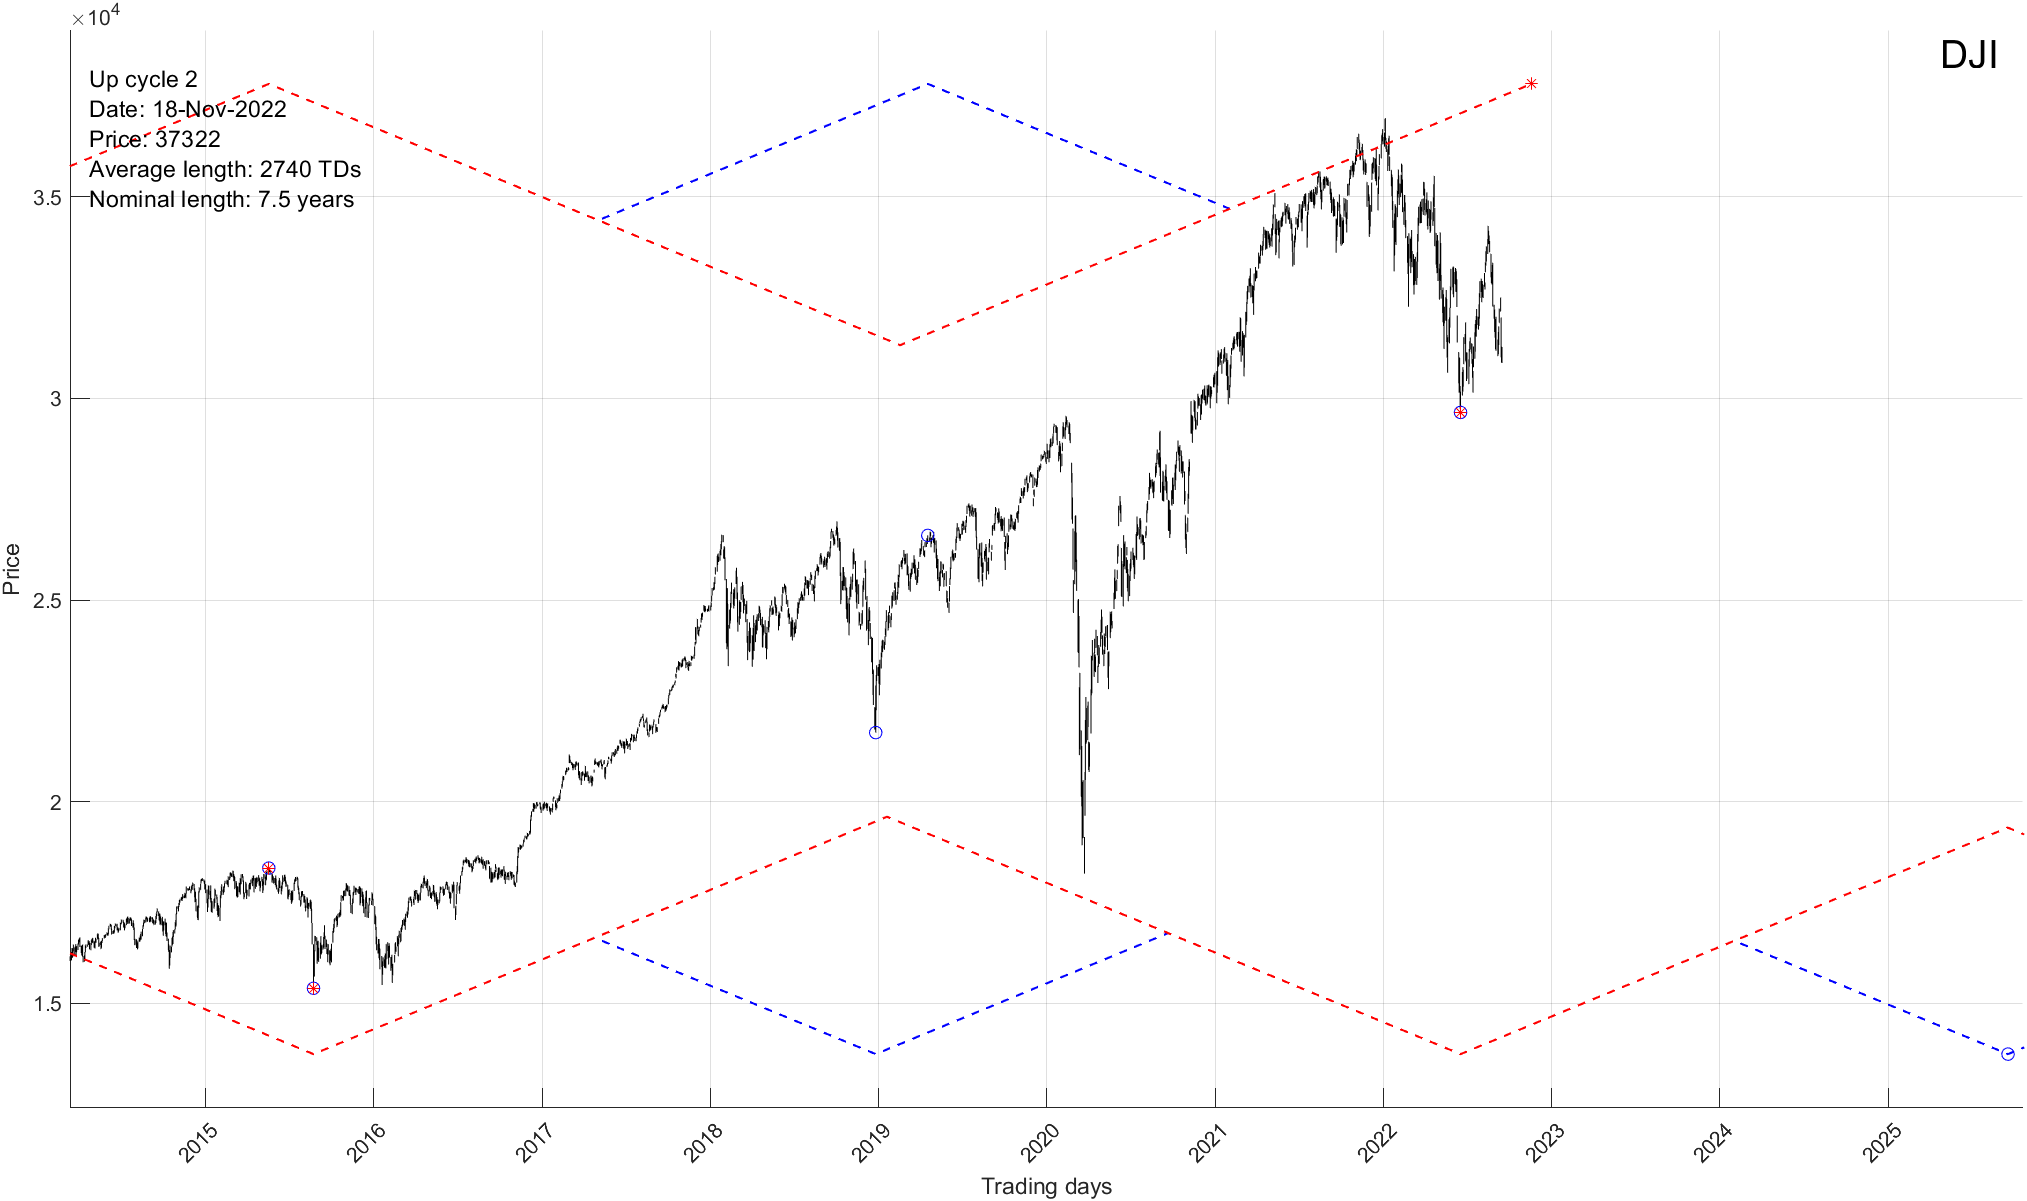
The bottom cycle in question is a constant 6.5 year cycle that is typically responsible for major bottoms. For instance, 2002, 2009 and 2015 bottoms. The upper longer-term cycle is the 7.5 year cycle that is responsible for tops associated with 2000, 2007 and 2015 tops.
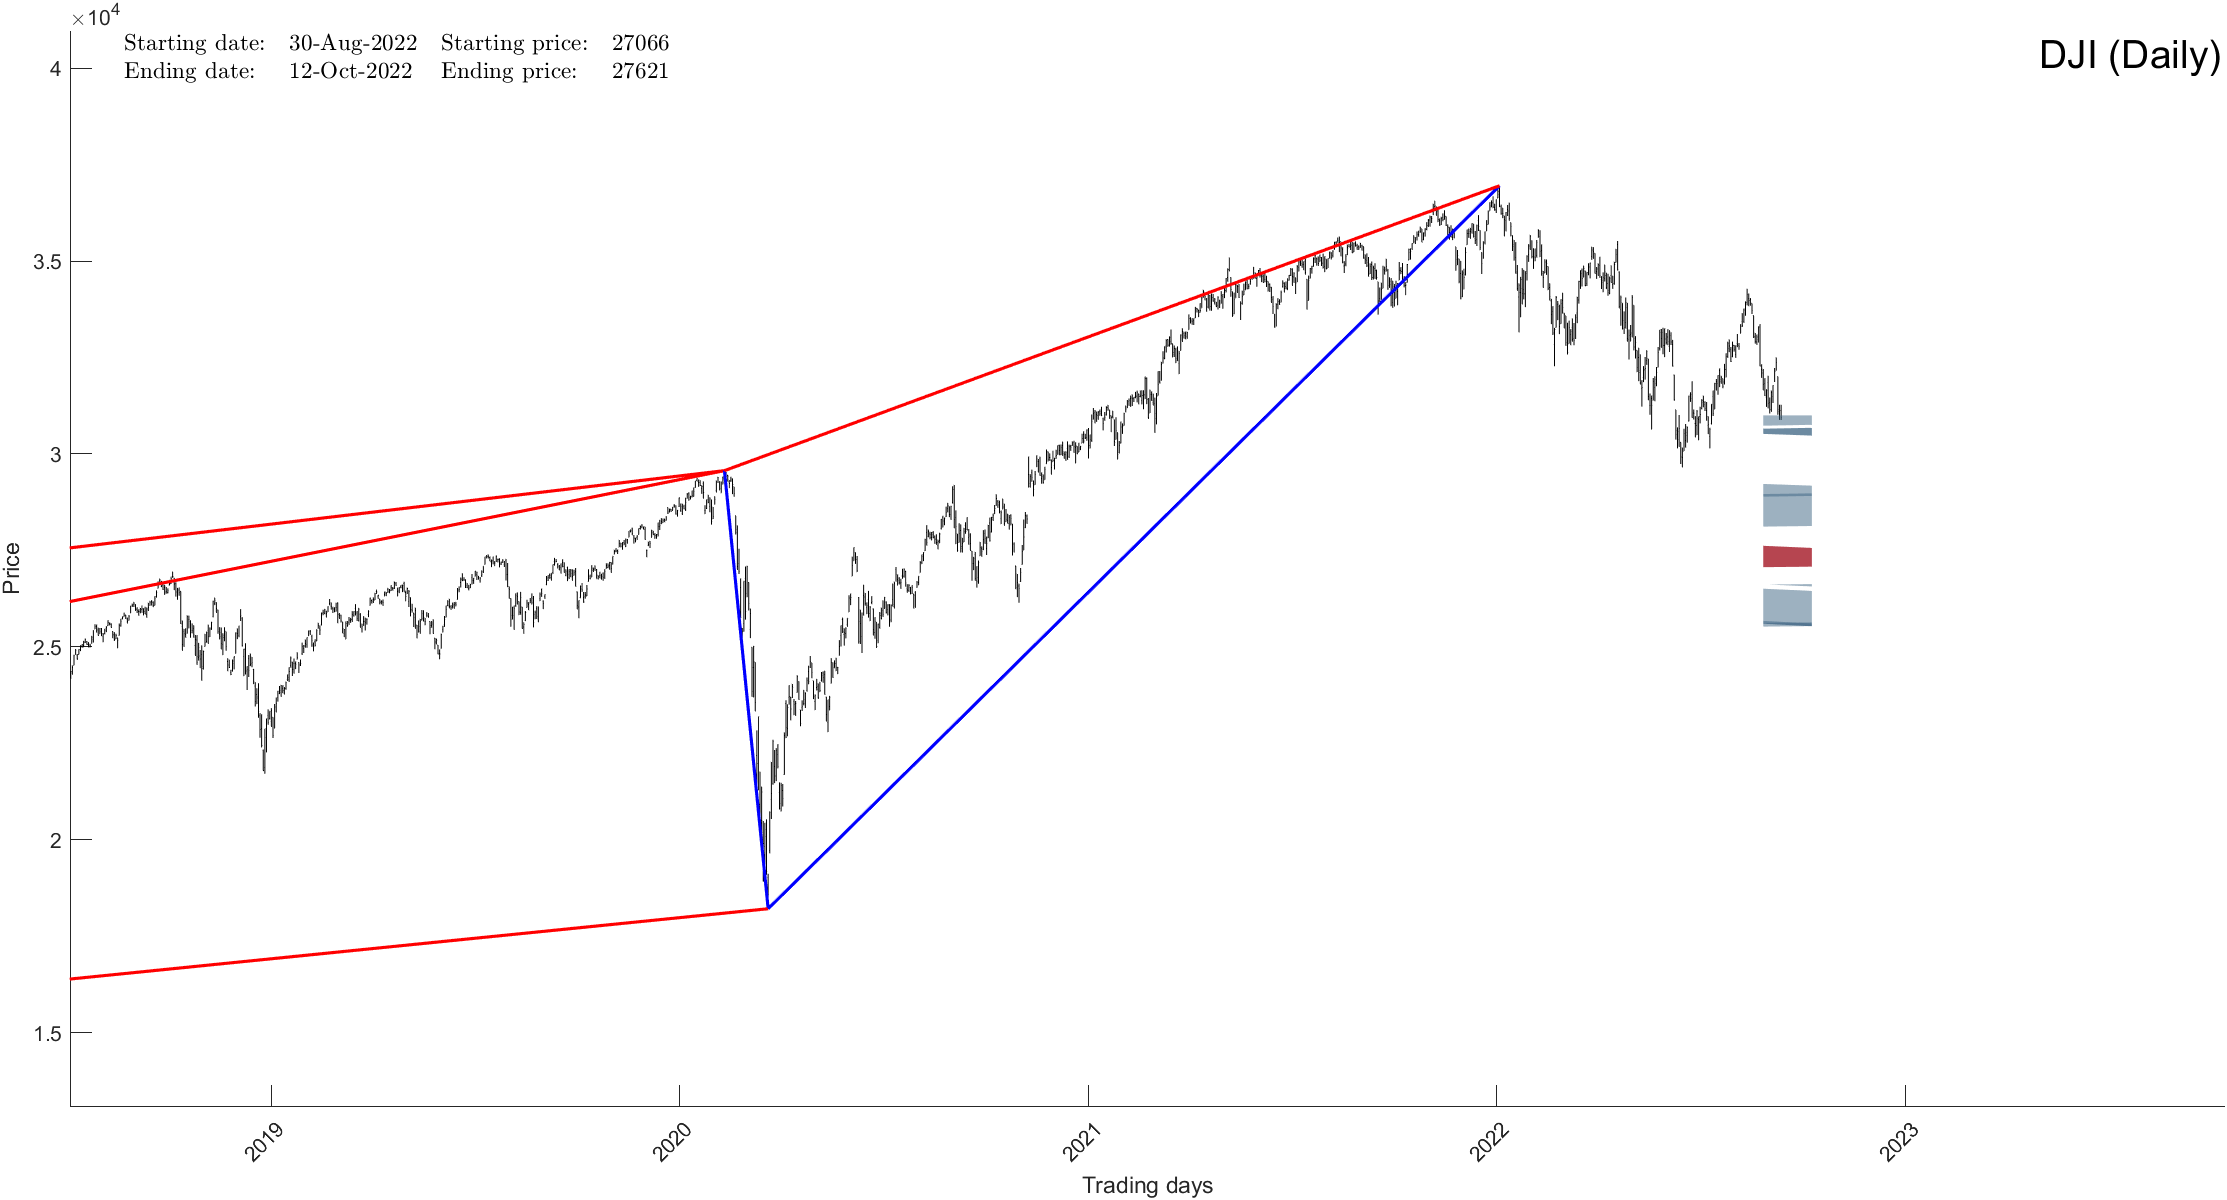
Now, the chart below makes a certain TIME/PRICE projection or rather a set of projections associated with our set of calculations described here. In short, after taking Dow Jones’s all possible geometric compositions into consideration the software identifies a major turning point. Whether it is up or down.
What does all of that mean?
Well, while it is easy to come to an analytical conclusion that might have been the case in the past, the work above shows an entirely different outcome if you base your projections on exact mathematics.
If you would be interested in learning what the charts above indicate, to the day and to within a +/-100 point resolution, please Click Here .
Santa’s Rally Beaten To Death Before Take Off
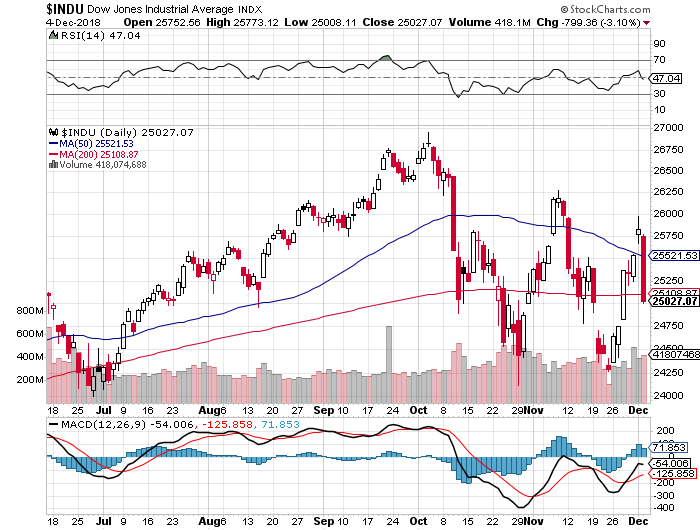
12/4/2018 – A negative day with the Dow Jones down 800 points (-3.10%) and the Nasdaq down 283 points (-3.80%)
The stock market finds itself at an incredibly important juncture. Things are about to accelerate in an unexpected way. If you would like to find out what happens next, based on our timing and mathematical work, in both price and time, please Click Here.
I guess that’s what it looks like when Mr. Market decides to puke most of Trump’s BS out. Let’s start with something funny, or sad, depending on your point of view.
The Arrogance of Youth
Now, yesterday we wrote Yield Curve Inverts – Now What? Mish had a very interesting look at the subject matter as well. Let’s take a look.
Why the Yield Curve Inverts in One Simple Picture

Let’s return to a statement I made at the top: Thus, whether or not the 3-month to 10-year spread inverts may very well depend on how many more hikes the Fed gets in.
Nearly everyone seems convinced the bond market will give its standard recession signal in a timely fashion. That is to say, nearly everyone is convinced the two-year to 10-year if not the 3-month to 10-year spread will invert.
Don’t count on it. Japan has had numerous recessions where its yield curve did not invert at all. The US could easily do the same.
Inversion is not a recession requirement.
His conclusion is just as sound as ours. Having said that, none of the above tells you what the stock market will do next.
This does. If you would like to find out what the stock market will do next, in both price and time, based on our timing and mathematical work, please Click Here.
![]()