![]()

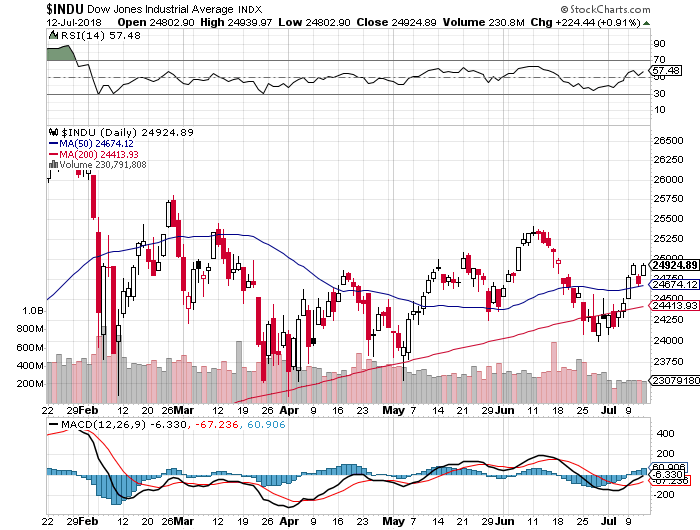
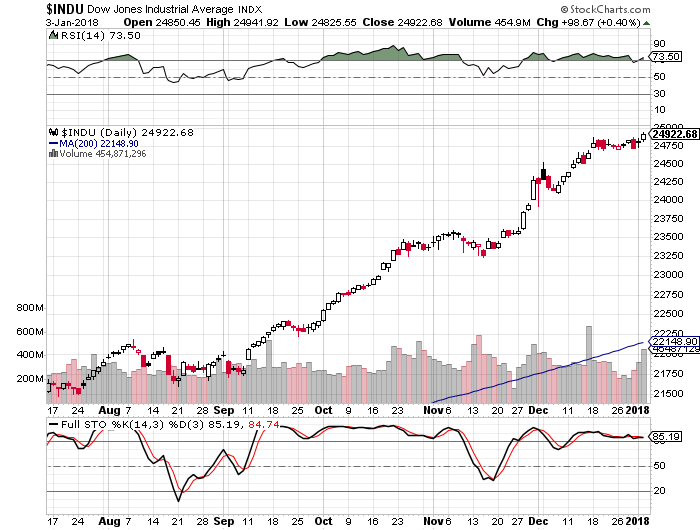
A positive day with the Dow Jones up 224 points (+0.91%) and the Nasdaq up 107 points (+1.39%)
Today’s market action was once again ideal if we consider our short-term forecast. Plus, the market was mostly able to resolve divergences we have mentioned yesterday.
If you would like to find out what happens next, in both price and time, based on our timing and mathematical work, please Click Here.
Bullish investors are once again getting more emboldened with each passing trading hour.
“Every bone in my body wants to sell this market,” he writes, but that bearish trade is “so obvious, it can’t be right.”
Everyone seems to be bearish, and “the investor in me agrees 100% with the skeptics who worry we are late-cycle and that risks are rising,” says Muir, who is a market strategist at East West Investment Management.
“But the trader in me is even more concerned that everyone is already positioned for this outcome,” he adds.
“Markets often go where they will hurt the most and make the majority look foolish. That path is higher — not lower.”
The proverbial “wall of worry” just keeps growing and “giving the market more fuel to rise,” he says.
My only question is, what skyscraper of worry is he talking about? Let’s look at the following charts…..

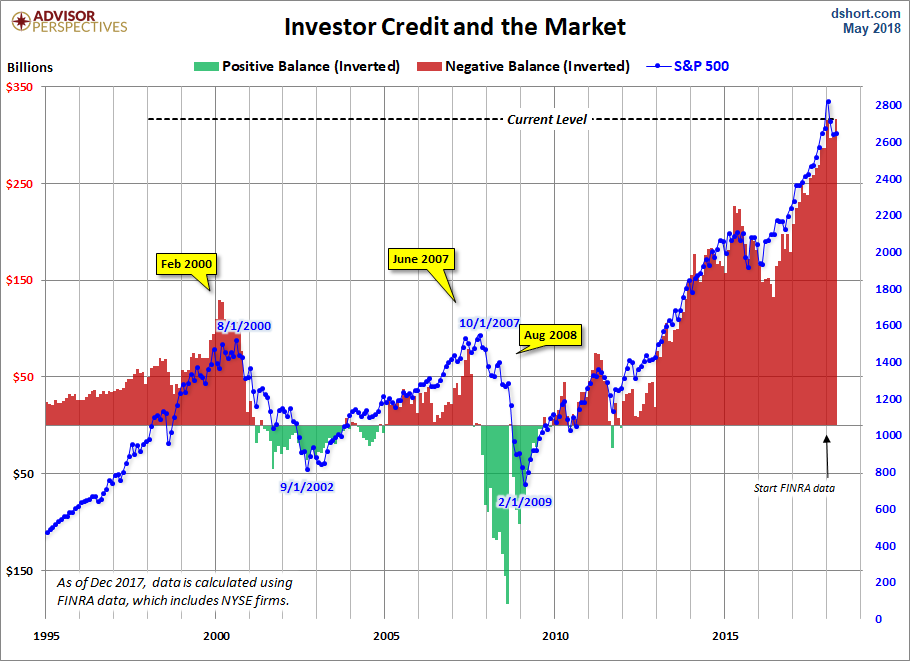
The market was severely oversold at June 28th bottom, as we have mentioned at the time, a condition that no longer exists. Other sentiment reading are somewhat misguided in terms of trying to ascertain bullish vs bearish sentiment.
The charts above are not. They are as bullish as they they have ever been. Investors are as leveraged (real money) as they have ever been and at the highest valuation level in the stock market’s history. Call it what you will. I call it swimming naked right before the tide goes out, not climbing some sort of a wall of worry.
Having said that, if you would like to find out what the stock market will do next, in both price and time, please Click Here
![]()
After supporting and predicting Trump Presidency in early 2016, when no one would believe it, we will go out on a limb and suggest that Trump Presidency is now over. We first called BS on Trump’s agenda in April of 2017 after he illegally bombed Syria the first time. It was clear at that moment that Trump has turned and that the proverbial “Swamp” had him. It is nice to see that other Trump supporters are beginning to see the light as well.
Having said that, the real test for Mr. Trump will come when today’s overvalued and highly speculative market craters 50%. It is at that point that he will finally be seen for what he really is, “The Emperor Who Has No Clothes“, by the rest of his base.

Charles Nenner believes that it is……
I am not exactly sure what Mr. Nenner does, but his cyclical analysis appears to be very close to the work we do here. I am also in agreement with him in terms of deflation, interest rates and the USD. That is exactly what we have been talking about in our membership section. To find out what the stock market will do next please Click Here.
And watch the video below to find out if the Dow is going to 5,000. Plus, a lot more.
This is what losing control looks like after nearly 2 years of interest rate hikes.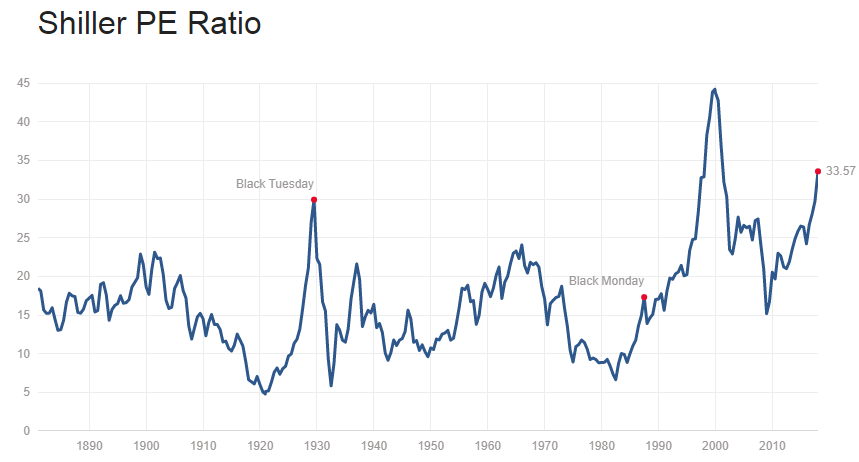
Even though most investors will argue that is net positive, it is anything but. Just wait until the stock market reverts to its mean. And that is where it gets interesting. Now that Fed President William Dudley is stepping down in Mid 2018, he is actually beginning to make sense.
The Federal Reserve may have to “press harder on the brakes” at some point over the next few years, increasing the risk of a hard landing for the economy, New York Fed President William Dudley said Thursday.
The risk of economic overheating “seems like an odd issue to focus on when inflation is low, but it strikes me that this is a real risk over the next few years,” Dudley said in a speech to the Securities and Financial Markets Association.
This suggests that the Fed might have to be more aggressive with those rate hikes, the New York Fed president said.
In another words, everyone and their day trading grandma believe the FED will backstop any sort of a significant correction with easing and more QE. BTFD!!!
Weather it will work or not is an entirely different question, but all of the above is best described by the following chart. 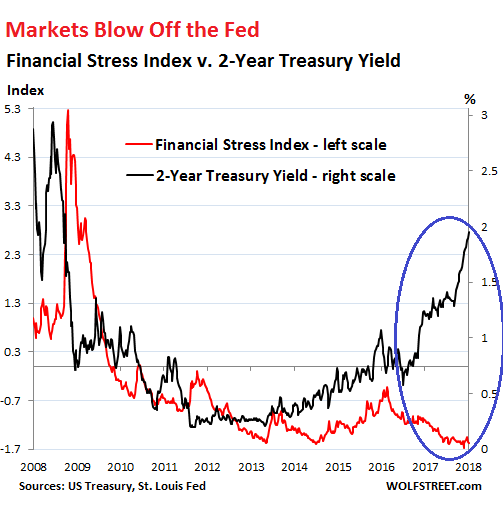
Having said that, this is indeed meaningless because we are already in a historic bubble of massive proportions. Yes, the everything bubble.
There is no way out of this and there are no gradual solutions. At this point it is a matter of perception or waiting for a time window when investors will finally lose faith in the FED. When that threshold is reached the stock market will correct in a spectacular fashion. If you would like to find out when that happens, please Click Here
 – State of the Market Address:
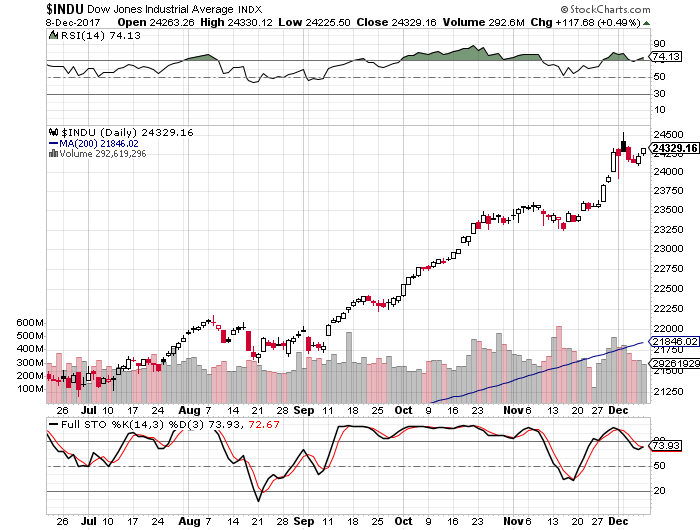
In summary: For the time being and long-term, the market remains in a clear bull trend. Yet, a number of longer-term indicators suggest the market might experience a substantial correction ahead. Plus, the “smart money” is positioning for some sort of a sell-off.
If you would like to find out exactly what happens next based on our Timing and Mathematical work, please Click Here.
ATTENTION!!! Please note, we have moved most of our free editorial content to our new website MarketSpartans.com Please Click Here to view it.
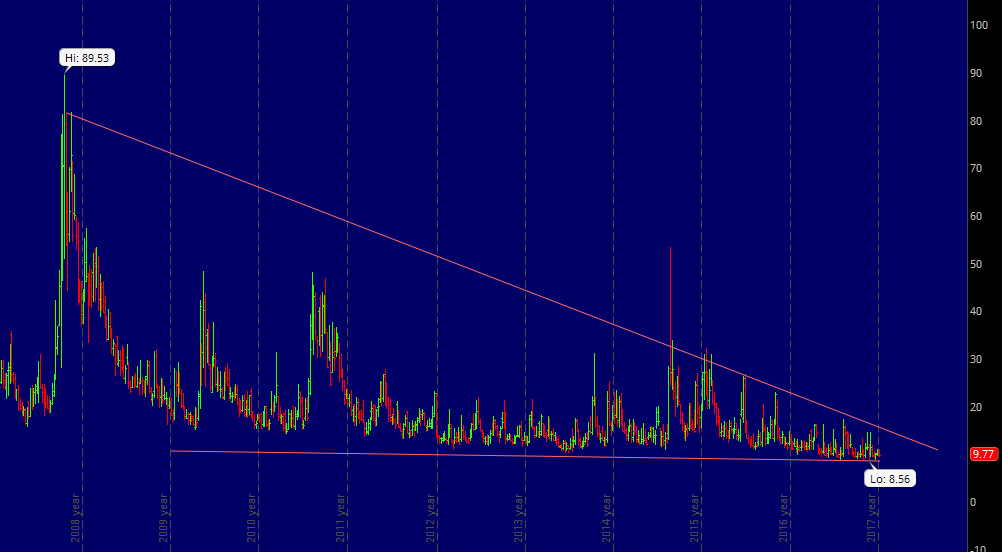
I find the chart above to be the most fascinating of them all. Massive long-term VIX compression we have discussed here over the last few months is coming to an end. And with VIX having nowhere to go but up, what the future holds might be unprecedented.
If you would like to find out which way this powerful compression will break and most importantly WHEN, please Click Here.
 – State of the Market Address:
In summary: For the time being and long-term, the market remains in a clear bull trend. Yet, a number of longer-term indicators suggest the market might experience a substantial correction ahead. Plus, the “smart money” is positioning for some sort of a sell-off.
If you would like to find out exactly what happens next based on our Timing and Mathematical work, please Click Here.
ATTENTION!!! Please note, we have moved most of our free editorial content to our new website MarketSpartans.com Please Click Here to view it.
ELLIOTT WAVE UPDATE:
Since many people have asked, I will attempt to give you my interpretation of Elliott Wave and how it is playing out in the market. First, I must admit. I don’t claim to be an EW expert, but I hope my “standard” interpretation is of help.
Let’s take a look at the most likely recent count on the S&P.
Explanation:
Long-Term: It appears the S&P is quickly approaching the termination point of its (5) wave up off of 2009 bottom. If true,we should see a massive sell-off later this year. Did it already complete? Click Here
Short-Term: It appears the S&P might have completed its intermediary wave 3 and now 4. It appears the market is now pushing higher to complete wave 5 of (5). If true, the above count should terminate the bull market. Did it already complete? Click Here
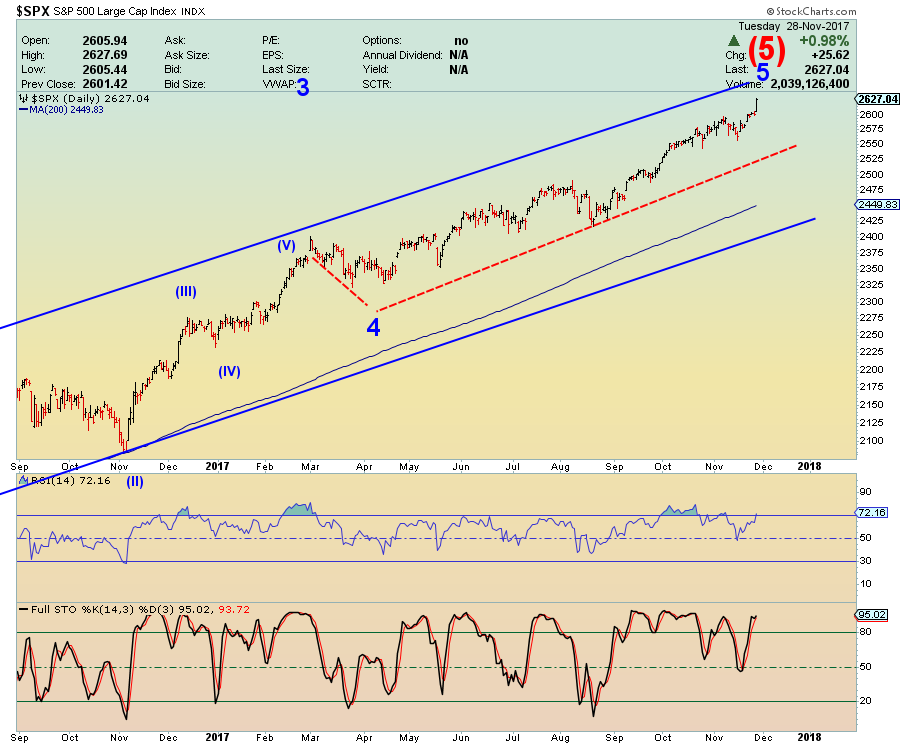
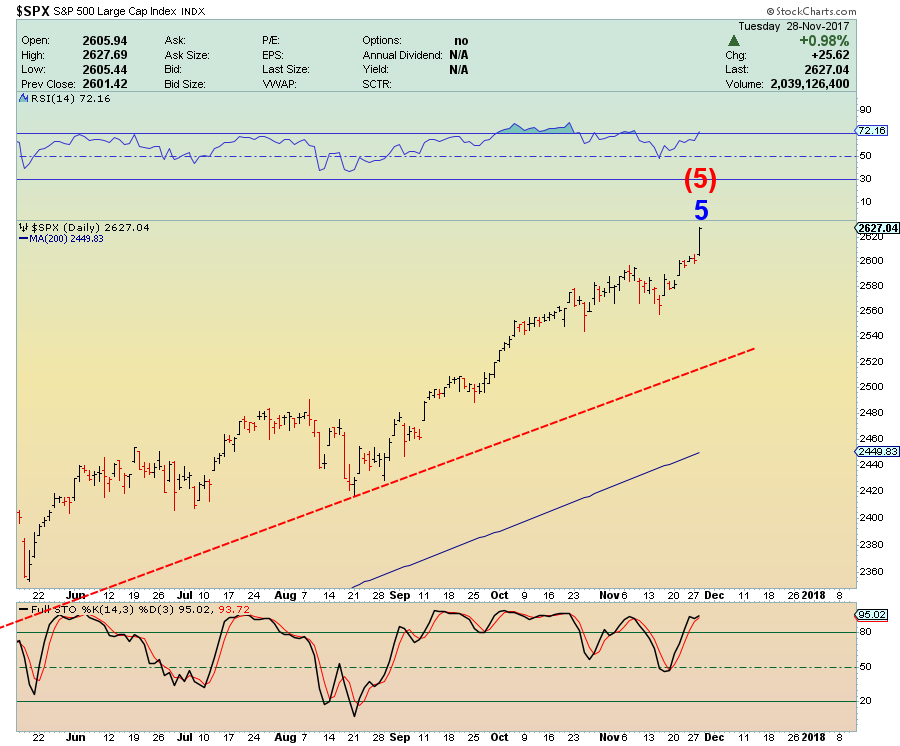 If you would like to find out exactly what happens next based on our Timing and Mathematical work, please Click Here.
ATTENTION!!! Please note, we have moved most of our free editorial content to our new website MarketSpartans.com Please Click Here to view itDa