The Curious Case Of All Time High Valuations Sitting On Top Of A Debt Mountain

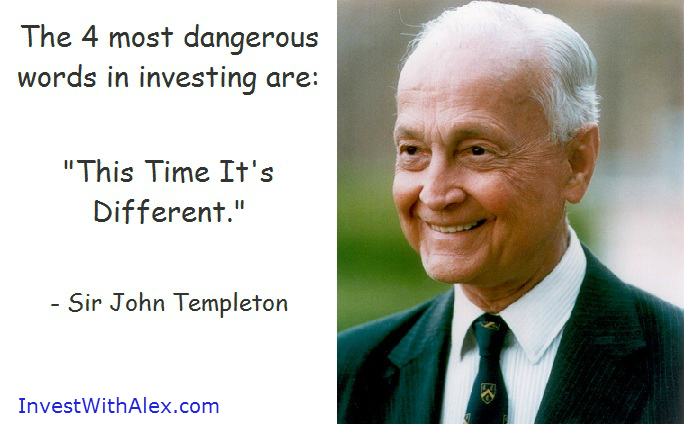
Most of today’s financial commentary suggests that valuations are no longer relevant. That today’s market exists in some sort of a low interest rate, low inflation and high growth kind of an environment.

Still, it is refreshing to see a major Wall Street bank call it like it is….

Goldman says highest valuations since 1900 leave investors in for a world of hurt

We have been saying the same for months. Based on today’s Shiller’s P/E Ratio of 31.86, we are sitting at the highest valuation level in the history of the market. Yes, higher than 1929 and 2000 tops (if we adjust for lack of earnings). And the source of this prosperity is ……

US Gross National Debt Jumps $723 billion in 12 Weeks, Yellen “Very Worried about Sustainability of US Debt Trajectory”

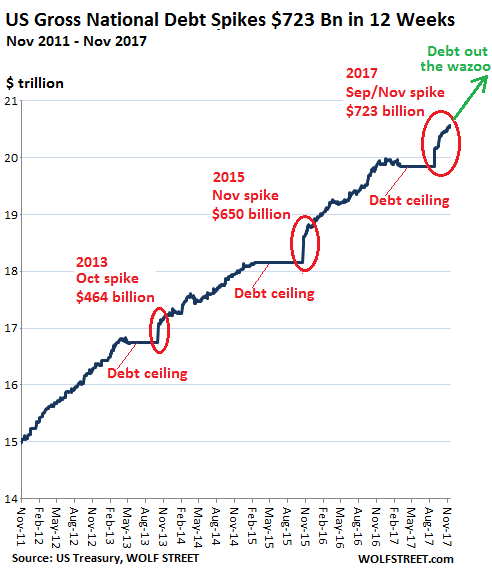
So here you have it. The trajectory of US government debt is “unsustainable,” according to Yellen, Kaplan, and many others. In fact, just about everyone acknowledges this except for the only people that can actually do something about it: the lawmakers in Congress. They don’t even know the meaning of “unsustainable.” It’s not part of their vocabulary. It has been replaced by “fund raising” and “campaign contributions.” And they’re happier than ever to run up the debt, no holds barred.

Understandably,  Mr. Trump has left out the source of his ‘miracle stock market run’ for the sake of simplicity. The above is equivalent to a junky maxing out his credit cards to go on a heroin binge. And we all know how that ends.

Daily Stock Market Update & Forecast – November 21st, 2017 – Elliott Wave Edition

ELLIOTT WAVE UPDATE:

Since many people have asked, I will attempt to give you my interpretation of Elliott Wave and how it is playing out in the market. First, I must admit. I don’t claim to be an EW expert, but I hope my “standard” interpretation is of help.

Let’s take a look at the most likely recent count on the S&P.

Explanation:

Long-Term: It appears the S&P is quickly approaching the termination point of its (5) wave up off of 2009 bottom. If true,we should see a massive sell-off later this year. Did it already complete? Click Here

Short-Term: It appears the S&P might have completed its intermediary wave 3 and now 4. It appears the market is now pushing higher to complete wave 5 of (5). If true, the above count should terminate the bull market. Did it already complete? Click Here

If you would like to find out exactly what happens next based on our Timing and Mathematical work, please Click Here. 


ATTENTION!!! Please note, we have moved most of our free editorial content to our new website MarketSpartans.com Please Click Here to view it.

Bitcoin Investors Expect To See $10,000 By 2019 – We Ask, Why Not Next Tuesday

As I technician I don’t recall seeing a chart similar to the chart above that did not subsequently correct or collapse in a stunning fashion. Let’s review the latest on the cryptocurrency…..

Bitcoin passed $8,000 as institutional money inches closer to cryptocurrency markets

One indicator is the increasing popularity of bitcoin futures. Over the weekend, the first year-long contract for the price of bitcoin was agreed by traders on the LedgerX platform, an issuer of derivatives regulated in the US. The contract is an option to buy bitcoin at $10,000 by Dec. 28, 2018.

Great. More leverage and speculation is being added into the mix. What can possibly go wrong.

The Currency Of The Apocalypse’? Doomsday Preppers Flock To Bitcoin As It Surges Past $8000

“Not too long ago, people in the prepper community were actively warning against crypto, and now they’re all investing in it,” said Tom Martin, a truck driver from Washington who runs a social-media website for people interested in learning skills to survive disaster. “As long as the grid stays up, people will keep using bitcoin.”

As Forest Gump used to say “Stupid is as stupid does”. You would figure the last place these Doomsday Preppers would want to invest in is Bitcoin. It is hard to imagine that the grid would stay up and the value of Bitcoin doesn’t go to zero in case of an EMP on Nuclear strike. Good luck exchanging your digital coins for carrots then.

Jim Rogers says bitcoin ‘looks and smells’ like all other investment bubbles

Bitcoin has performed amazingly well, so it’s tempting to buy. Don’t bother, says Rogers. “It looks and smells like all the bubbles I have seen throughout history.” True, bubbly assets can continue to march higher than any rational person imagines possible. So there could be further gains. But messing around with bubbles is risky. Better to just stay away. “I have missed it, whatever it is,” Rogers says.

Mr.Rogers is dead on, about “whatever it is”.  We continue to maintain that Bitcoin has no real value. Yes, we are aware of all the arguments for and against it, yet the currency is only worth what the next person is willing to pay for it. Or in this case, what the next fool is willing to pay for it.

And while this insanity might go on for a few more years, history will not be kind to Bitcoin and its investors. 

Weekly Stock Market Update & Forecast – November 17th, 2017

– State of the Market Address:

  • The Dow remains well above 23,000.
  • Shiller’s Adjusted S&P P/E ratio is now at 31.51 Now at arguably the highest level in history (if we adjust for 2000 distortions) and still above 1929 top of 29.55.
  • Weekly RSI at 76 – overbought. Daily RSI is at 55- neutral.
  • Prior years corrections terminated at around 200 day moving average. Located at around 18,300 today (on weekly).
  • Weekly Stochastics at 93 – overbought. Daily at 33 – neutral.
  • NYSE McClellan Oscillator is at -7. Neutral.
  • Volatility measures VIX/VXX remains at suppressed levels. Commercial VIX long interest declined slightly to 75K contracts net long. 
  • Last week’s CTO Reports suggest that commercials (smart money) are shifting their positioning back to net short. Short interest has shifted slightly lower during the week. For now, the Dow is 7X, the S&P is at 2X net short, Russell 2000 is now at 5.5X net short and the Nasdaq is net neutral.

In summary: For the time being and long-term, the market remains in a clear bull trend. Yet, a number of longer-term indicators suggest the market might experience a substantial correction ahead.  Plus, the “smart money” is positioning for some sort of a sell-off.

If you would like to find out exactly what happens next based on our Timing and Mathematical work, please Click Here. 


ATTENTION!!! Please note, we have moved most of our free editorial content to our new website MarketSpartans.com Please Click Here to view it.


ELLIOTT WAVE UPDATE:

Since many people have asked, I will attempt to give you my interpretation of Elliott Wave and how it is playing out in the market. First, I must admit. I don’t claim to be an EW expert, but I hope my “standard” interpretation is of help.

Let’s take a look at the most likely recent count on the S&P.

Explanation:

Long-Term: It appears the S&P is quickly approaching the termination point of its (5) wave up off of 2009 bottom. If true,we should see a massive sell-off later this year. Did it already complete? Click Here

Short-Term: It appears the S&P might have completed its intermediary wave 3 and now 4. It appears the market is now pushing higher to complete wave 5 of (5). If true, the above count should terminate the bull market. Did it already complete? Click Here

If you would like to find out exactly what happens next based on our Timing and Mathematical work, please Click Here. 


ATTENTION!!! Please note, we have moved most of our free editorial content to our new website MarketSpartans.com Please Click Here to view it.

An Important Message From Ron Paul- Assuming You Care About America

Wealth doesn’t come from the creation of money, especially a fiat system. With too much fiat money and all this credit, eventually the economy becomes exhausted and engulfed with debt and mal-investments. The treatment for this is a correction; you have to allow the debt to be liquidated. You have to get rid of the mal-investment and you have and to allow real economic growth to start all over again. But that wasn’t permitted in ’08 and ’09, which is why there’s been stagnation. It’s hard to believe that today we have negative interest rates — real rates are negative and people still aren’t grabbing them up! A shortage of money isn’t the problem here; rather, it’s a shortage of understanding market conditions.

We’re over-taxed and over-regulated. This is resulting in a destructive system that has divided the country into two groups: those who haven’t recovered from the Great Financial Crisis versus those who are getting very rich because they’re on the receiving end of the new money created by the Federal Reserve. The people who get to create the credit get to distribute the credit, which always results in a situation where money becomes unfairly distributed, as its allocation is no longer dependent on productivity.

We haven’t changed anything. We still have a system where we encourage people to borrow money, that debt doesn’t matter, and we’re not going to cut taxes, and we’re not even going to admit that we spend too much money. Nobody can cut anything — that’s why Washington is at a stalemate. A lot of people don’t like Obamacare, but there’s enough people who do like it. Once it has been implemented, it’s very hard to get rid of a program. I also don’t think that the proposed tax reforms will actually lower taxes. They never do.  Our politicians won’t admit where the real problem lies: overspending, monetizing the debt, taking over the whole world through the monetary system, financing wars, financing welfare and the military industrial complex. It’s going to continue until this whole thing comes apart.

The eventual event will be driven by the marketplace. When it comes undone, they will no longer be able to prop things up just by printing more money. If we have a sharp downturn and they decide, “Well, QE didn’t work because it wasn’t enough.” and they double QE, there’ll be a point of no return and all confidence will be lost. We’ll dump the dollar. Interest rates will go up instead of down. That will make all the difference in the world because it will be unsustainable and create real challenges for the dollar remaining the reserve currency. When the dollar no longer serves as the world’s key currency, that’s when the ballgame will be over.

Weekly Stock Market Update & Forecast, November 11th, 2017

– State of the Market Address:

  • The Dow remains well above 23,000.
  • Shiller’s Adjusted S&P P/E ratio is now at 31.60 Now at arguably the highest level in history (if we adjust for 2000 distortions) and still above 1929 top of 29.55.
  • Weekly RSI at 79 – overbought. Daily RSI is at 65 – neutral.
  • Prior years corrections terminated at around 200 day moving average. Located at around 18,300 today (on weekly).
  • Weekly Stochastics at 96 – severely overbought. Daily at 66 – neutral.
  • NYSE McClellan Oscillator is at -37. Neutral.
  • Volatility measures VIX/VXX remains at suppressed levels. Commercial VIX long interest remains the same at  83K contracts net long. 
  • Last week’s CTO Reports suggest that commercials (smart money) are shifting their positioning back to net short. Short interest has shifted slightly higher during the week. For now, the Dow is 7X, the S&P is at 3X net short, Russell 2000 is now at 7X net short and the Nasdaq is at 2X net short.

In summary: For the time being and long-term, the market remains in a clear bull trend. Yet, a number of longer-term indicators suggest the market might experience a substantial correction ahead.  Plus, the “smart money” is positioning for some sort of a sell-off.

If you would like to find out exactly what happens next based on our Timing and Mathematical work, please Click Here. 


ATTENTION!!! Please note, we have moved most of our free editorial content to our new website MarketSpartans.com Please Click Here to view it.


ELLIOTT WAVE UPDATE:

Since many people have asked, I will attempt to give you my interpretation of Elliott Wave and how it is playing out in the market. First, I must admit. I don’t claim to be an EW expert, but I hope my “standard” interpretation is of help.

Let’s take a look at the most likely recent count on the S&P.

Explanation:

Long-Term: It appears the S&P is quickly approaching the termination point of its (5) wave up off of 2009 bottom. If true,we should see a massive sell-off later this year. Did it already complete? Click Here

Short-Term: It appears the S&P might have completed its intermediary wave 3 and now 4. It appears the market is now pushing higher to complete wave 5 of (5). If true, the above count should terminate the bull market. Did it already complete? Click Here

If you would like to find out exactly what happens next based on our Timing and Mathematical work, please Click Here. 


ATTENTION!!! Please note, we have moved most of our free editorial content to our new website MarketSpartans.com Please Click Here to view it.


Trade Of The Day – US Dollar (DXY)

Most market commentators and investors believe the USD has bottomed in early September. And while that might very well be the case, the overall setup is not that easy. In addition to a powerful TIME turning point arriving NOW, the USD has been unable to push above prior support (red line). That is net bearish in itself. If you would like to find out what the USD will do next and when, please Click Here

Daily Stock Market Update & Forecast – November 9th, 2017 – Elliott Wave Edition

ELLIOTT WAVE UPDATE:

Since many people have asked, I will attempt to give you my interpretation of Elliott Wave and how it is playing out in the market. First, I must admit. I don’t claim to be an EW expert, but I hope my “standard” interpretation is of help.

Let’s take a look at the most likely recent count on the S&P.

Explanation:

Long-Term: It appears the S&P is quickly approaching the termination point of its (5) wave up off of 2009 bottom. If true,we should see a massive sell-off later this year. Did it already complete? Click Here

Short-Term: It appears the S&P might have completed its intermediary wave 3 and now 4. It appears the market is now pushing higher to complete wave 5 of (5). If true, the above count should terminate the bull market. Did it already complete? Click Here

If you would like to find out exactly what happens next based on our Timing and Mathematical work, please Click Here. 


ATTENTION!!! Please note, we have moved most of our free editorial content to our new website MarketSpartans.com Please Click Here to view it.