Weekly Stock Market Update & Forecast. April 5th, 2014. InvestWithAlex.com

daily chart April 4th 2014t

Weekly Update & Summary: April 5th, 2014

An interesting week. Even though the markets sold off on Friday, the Dow ended the week with a gain. In fact, for the week the Dow Jones was up 90 points (0.55%) while the Nasdaq declined 28 points (-0.67%). Structurally, the market did very well by closing most of it’s gaps. While the Nasdaq closed all of its gaps, the Dow has a number of large gaps left, leading all the way down to around 16,050 (indicating further downside). I believe the market will go back to close these gaps when the bear market initiates.

WEEKLY REVIEW:

Is Another 1987 Type Of A Market Crash Around The Corner?

1987 crash investwithalex

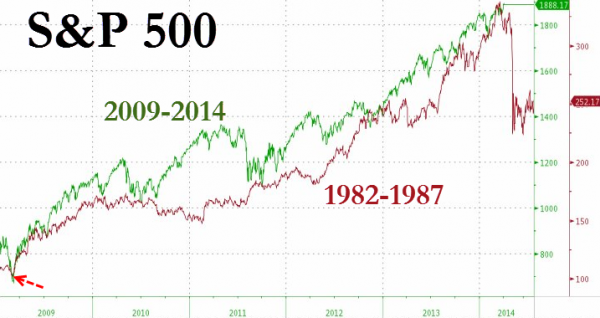
The chart above has spread around the financial community like a wildfire, predicting a 1987 type of a crash (20% down in 1-2 trading days) Is it legit? The chart is legit, but comparing today’s market environment to 1987 is like looking up horses ass to see its teeth -OR- it confuses cause and effect. 

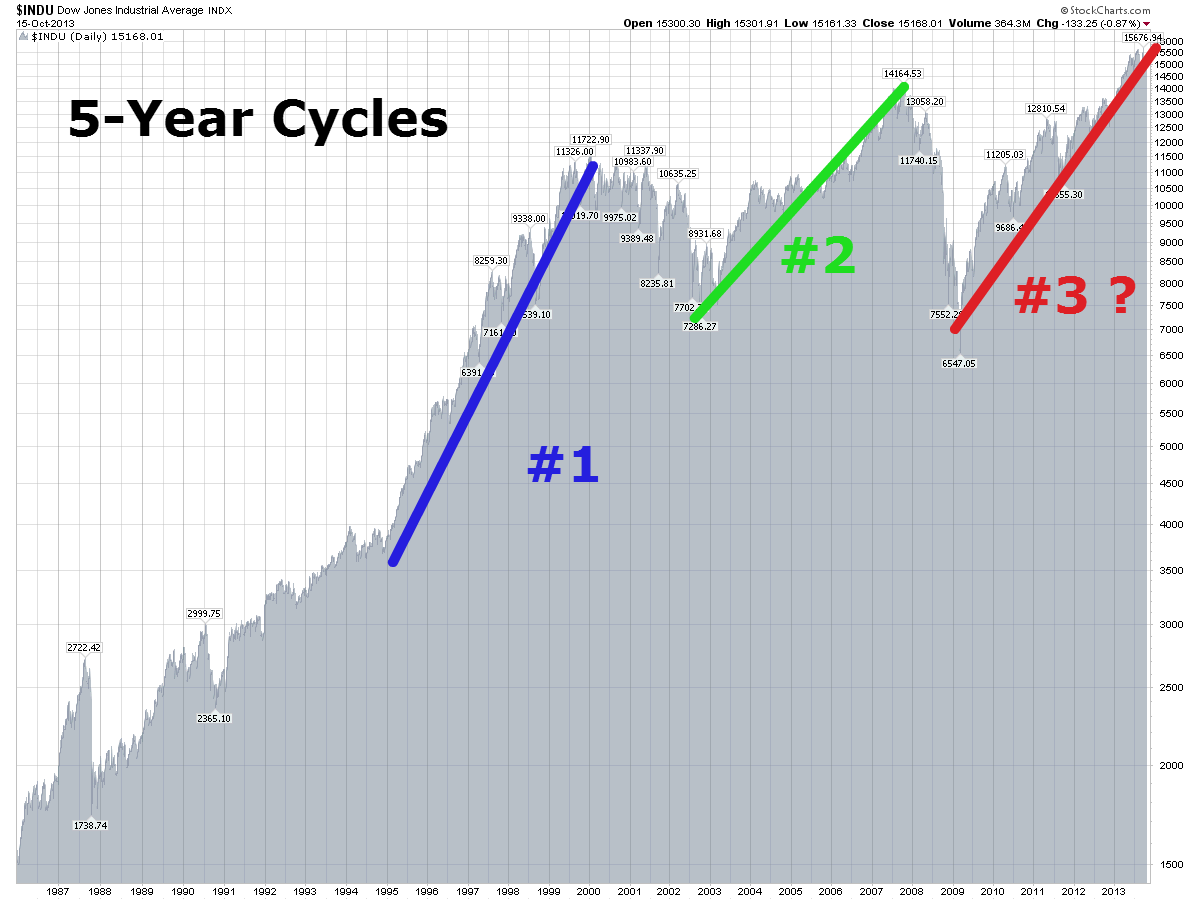
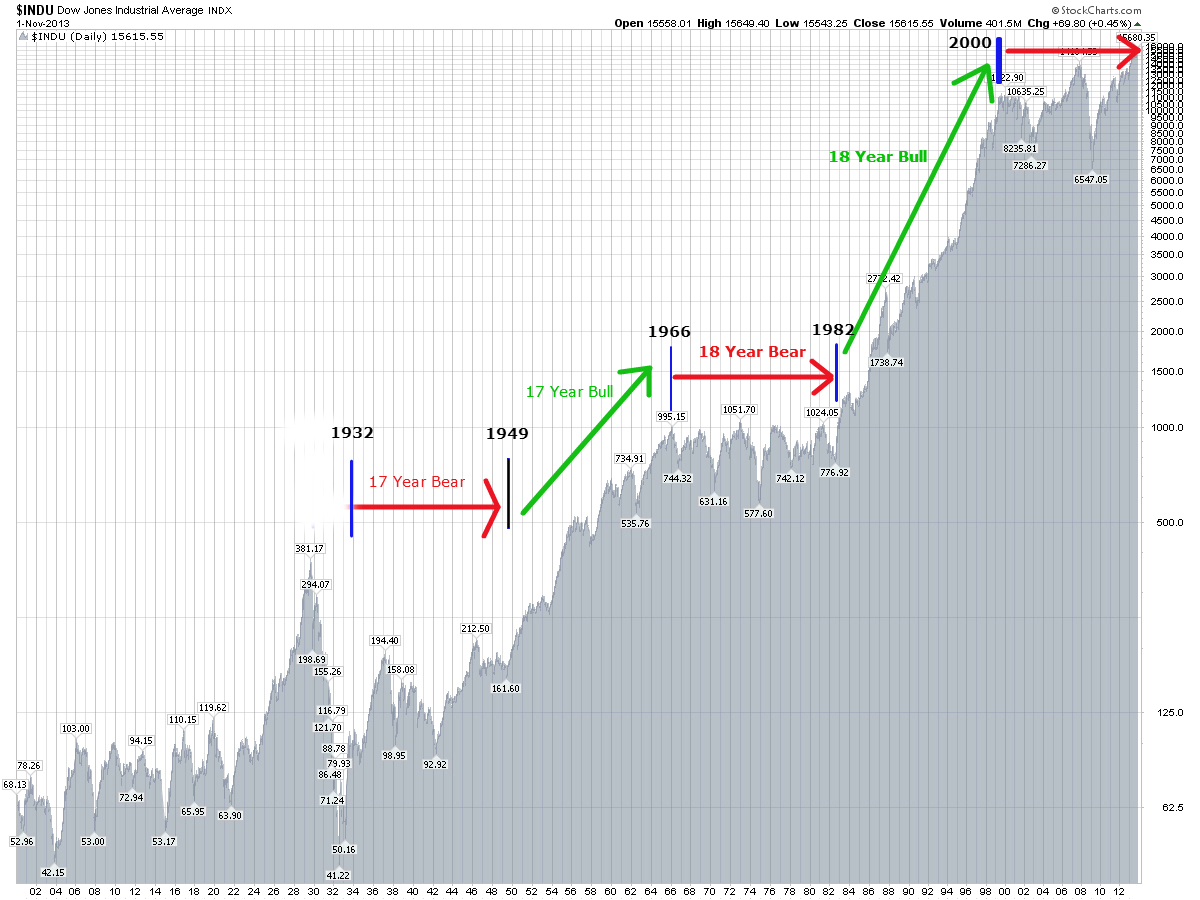
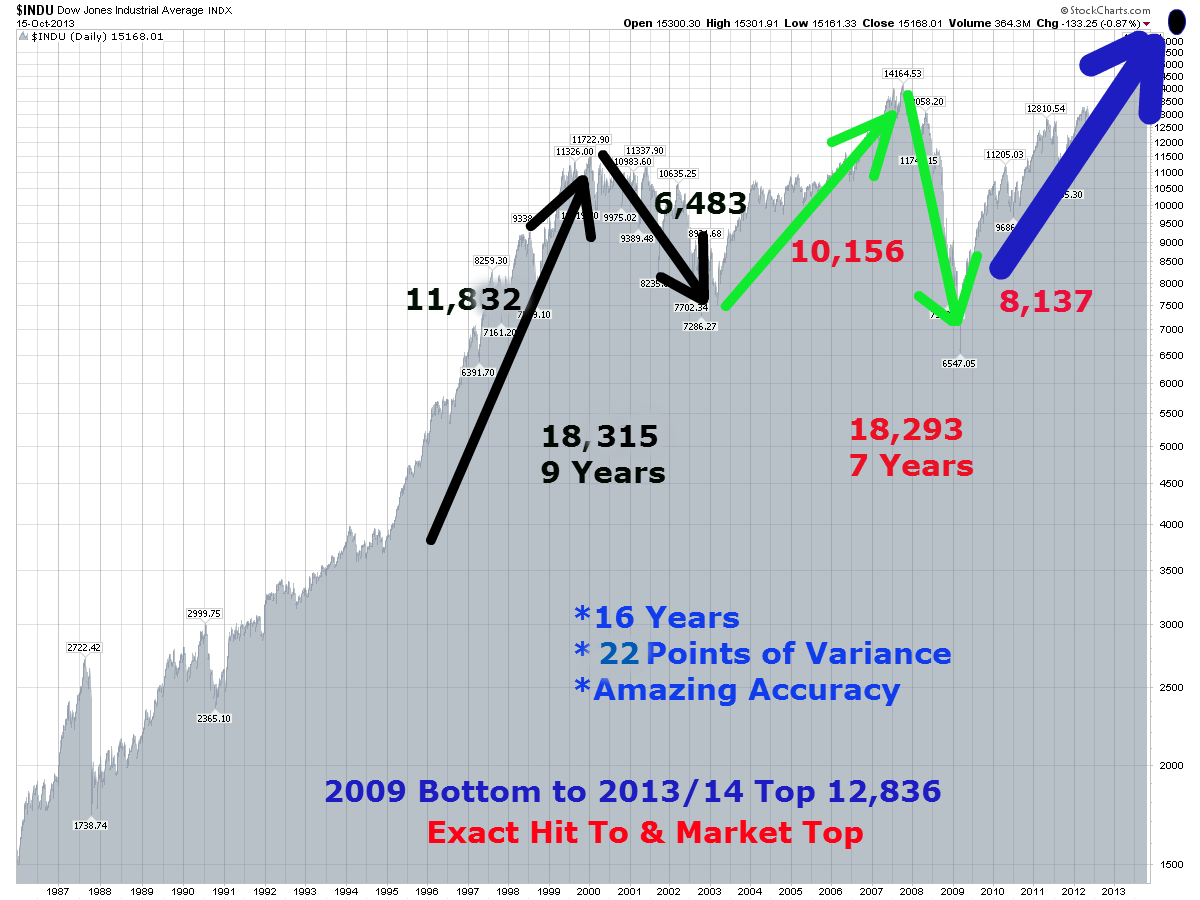
While I am not suggesting that the crash is not possible, you could compare today’s market to many of the 5-year cycles I have described on this blog. Click Here to read some of it. In a nutshell, today’s market matches many other 5 year cycles, not only 1987….1924-1929, 1932-1937, 1961-1966, 1982-1987, 1994-2000, 2002-2007, 2009-2014, etc…there are many others. 

When the 5 year cycle completes itself the market tends to roll over. It will not be different this time around. Whether the market will crash or simply roll over into a sustain long term bear market is irrelevant here. What is relevant? The bear market of 2014-2017 is just around the corner and it will slam stocks over the next few years. If you would like to know exactly when it will start (to the day) and its internal composition, please Click Here.

Why Job Numbers Are Irrelevant

While everyone is scouring recently released Bureau of Labor Jobs Report, looking for any sign of economic clarity, I am here to tell you that such data is for the most part irrelevant when it comes to forecasting financial markets and/or the economy. If you are still wondering, March payroll came in it at 192,000, keeping the unemployment rate unchanged at 6.7%. Giving further indication that any tapering or tightening by the FED might come later than anticipated and not be as benign as some have feared. Great news for Wall Street. 

Yet, all of the above is irrelevant. If you have been following this blog for any period of time you know that I have stated, a number of times, that the FED will not be raising interest rates anytime soon due to an upcoming bear market of 2014-2017 and the subsequent US recession. While the job report above could be viewed as “no tightening”, it should be viewed as “any existing economic recovery/growth is running out of gas”.  Once that settles is, expect the markets to sell off. 

Janet Yellen: Forget About Rate Hikes

As per report below, according to Janet Yellen’s indicators the US Economy is nowhere near where it should be for the rates to rise anytime soon. That is despite the stock market being up over 150% over the last 5 years. In fact, today’s ADP Job Report missed the mark for the 4th month in a row with 191,000 jobs created VS 195,000 expected. Becoming just another confirmation of what we have been saying all along here.

Forget about any rate increases over the next few years. That becomes more apparent when you look at our mathematical and timing work forecasts. Once again, they predict a sharp bear market between 2014-2017 and a subsequent deep recession in the US Economy. Under such circumstances, the FED will be looking for every possible avenue to re-inflate the markets instead of raising rates. In other words, as of today, most market participants are positioned in precisely the wrong way.  If you would be interested in learning exactly when the bear market of 2014-2017 will start (to the day) and it’s internal composition, please Click Here.  

MACROECONOMIC ANALYSIS:  

Ukraine/Russia  continues to  be the most important issue. In fact, things might escalate significantly over the next few weeks.  

Even though it seems as if the situation in Ukraine is de-escalating and no invasion will occur, that in itself might be misleading.  I continue to believe the US/NATO and Russia are one spark away from reigniting this conflict and going at each other on multiple levels.  While I don’t believe NATO and Russia will get involved into a direct military conflict (for the time being), any misstep here by either side might lead to Russia invading East Ukraine.  Such a move will spark a number of economic sanctions (from both sides), political storm, war rhetoric and a million other unforeseen consequences.  As you can imagine, this would be incredibly unsettling for financial markets.

TECHNICAL ANALYSIS:  

Long-Term: The trend is still up. Market action in January-February could be viewed as a simple correction in an ongoing bull market. The Dow did set a new high during the week, indicating continuation of the bull market. Yet, that in itself can be misleading as per our timing analysis discussion below.

Intermediary-Term: Since February 5th, intermediary term picture shifted from negative to positive. Giving us a technical indication that both the intermediary term and the long term trends are up. Yet, that in itself can be misleading as per our timing analysis discussion below.

Short-Term: While the short-term trend remains bullish, it might be misleading as per our timing analysis discussion below.  

Again, even though all 3 trends are bullish for the time being, that might be misleading. Please read our Mathematical and Timing Analysis to see what will transpire over the next few weeks.    

MATHEMATICAL & TIMING ANALYSIS:  

First, a review. Thus far, our forecasts have been, right on the money.

(*** Please Note: This time around about 90% of the information contained within this section has been deliberately removed as it contain too much technical information. Particularly, exact dates and prices of the upcoming turning points. As well as trading forecasts associated with them. I deem such information to be too valuable to be released onto the general public.  As such, this information is only available to my premium subscribers. If you are a premium subscriber please Click Here to log in. If  you would be interested in becoming a subscriber and gaining access to the most accurate forecasting service available anywhere, a forecasting service that gives you exact turning points in both price and time, please Click Here to learn more.Don’t forget, we have a risk free 14-day trial).  

Based on our mathematical and timing work the next turning point is located at

Price: XXXX
Time: XXXX

Trading:

I am now fully committed to the short side of the market with 10 individual positions taken at the prices outlined below. A lot of them have done incredibly well thus far and I hope you were able to benefit as well. I might add just one more short position over the next few weeks. That would be XXXX

Remember, you should have an exact strategy and entry/exit points based on the forecast above. 

The list below is for your reference point. It entails my investment strategy for my own investment purposes. While you are free to follow me, please do so at your own risk. Do not take this as a trading advice. Please note, most of the positions below have already been triggered.    

Stock

Entry Point ($)

Action Taken

Stop Loss @

XXXX

XXXX

Went Short

XXXX

XXXX

XXXX

Went Short

1250

XXXX

110

Went Short

121-123

XXXX

74

Went Short

80

XXXX

XXXX

Went Short

260

XXXX

XXXX

Went Short

460

XXXX

35

Went Short

39

XXXX

65

Went Short

70

XXXX

120

Went Short

120-130

XXXX

100

To Short


XXXX

112

Went Short

120

Otherwise, I suggest the following positioning over the next few days/weeks to minimize the risk while positioning yourself for a forecasted market action. (This is continuation of our previous positioning).

If You Are A Trader: XXXX

If No Position:  XXXX

If Long: XXXX 

If Short:  XXXX

CONCLUSION: 

An incredibly important week is coming up. We are now looking for our forecast to be confirmed over the next few trading days/weeks. I have also described what to anticipate over the next few months and exactly what you should do. With increased volatility, multiple interference patterns and an incredibly important long-term turning points coming up over the next few months we must be very careful and risk averse here.  Those anticipating the moves and those who can time them properly will be rewarded appropriately.

Please Note: XXXX is available to our premium subscribers in our + Subscriber SectionIt’s FREE to start. 

Did you enjoy this article? If so, please share our blog with your friends as we try to get traction. Gratitude!!!


Click here to subscribe to my mailing list


Weekly Stock Market Update & Forecast. April 5th, 2014. InvestWithAlex.com  Google

Weekly Market Update, Analysis & Forecast

Daily Chart March 28, 2014 investwithalex

Weekly Update & Summary: March 28th, 2014

This was a rough week for the market. Particularly, for the Nasdaq and iShare NASDAQ Biotechnology Index (IBB). While the Nasdaq lost 121 points (-2.83%), the IBB declined 16.6 points or (-6.76%). The Dow fared much better by squeezing out a tiny gain of 20 points (0.12%). Structurally, the market did very well this week by closing most of the gaps. Keep in mind, the Dow left a large gap behind at around 16,050. I believe the market will go back to close that gap when the bear market initiates.

FUNDAMENTAL & MARKET ANALYSIS:   

Why Interest Rates Will Remain Low

According to David Kotok, co-founder, chairman and chief investment officer of Cumberland Advisors,  ”long-term rates are likely to stay near current levels for quite a while”.

I tend to agree, but I will go even further. Not only will interest rates stay low, but I would expect the 10-Year Note to retrace back to at least 2% over the next 2-3 years.Why? 

Again, the forecast above is based on our incredibly accurate mathematical and timing work. This work predicts a severe bear market in US equities between 2014-2017 and a subsequent deep recession. As it is now, inflation is nonexistent as we continue to deal with debt liquidating deflationary forces.

When the bear market hits (we are almost there), the FED will have no choice but to abandon their “tightening” plan. Instead, a year from now they will be flooding the market with further liquidity/stimulus to try and avoid any further collapse. As you can understand, in such a interest rate environment, short-term rates will remain at zero while long-term tail of the yield curve will flatten once again. 

Is Gold About To Surge?

There is very little love for the yellow stuff at the moment. Since topping out less than two weeks ago, gold is down 6%. Today,many people and money managers are falling all over each other, suggesting that the gold has topped out and the time to short is NOW. Not so fast. Not according to our mathematical and timing work.

Here is what most people miss. Most people anticipate strong economy, tightening, stronger dollar and somewhat higher interest rates going forward. That is not what our mathematical and timing work shows. Not at all. Quite the opposite.  Our work shows that a severe bear market of 2014-2017 is about to start, ushering in a deep recession where the FED will be forced to flood the market with liquidity once again. Not tighten by any measure. In such an environment (liquidity pump while equity markets decline) gold tends to perform very well. 

That is on top of a favorable technical setup. While I wouldn’t buy just yet, Gold should be on your BUY watch list.

What Does The Yield Curve Yield?

The opposite of what most other market participants believe. Most market participants anticipate the FED to tighten, as they have indicated, indicating economic growth and higher interest rates. In such a scenario you should see spreads widening. Instead, we are beginning to see a trend reversal and yield curve compression since the start of this year. 

Does the bond market see something that most other market participants do not? 

yield curve investwithalex

I believe so. In fact, we anticipate the yield curve to flatten further over the next 24 months and possibly invert as the bear market of 2014-2017 enters the picture. As we have indicated on this blog so many times before the bear market will usher in a severe recession, forcing the FED to flood the market with further liquidity. In such an environment, we would anticipate the long end of the curve to head lower. Much lower. 

MACROECONOMIC ANALYSIS: 

Ukraine continues to  be the most important issue. In fact, things might escalate significantly over the next 10 days.  

As I published on my blog, I am getting an unconfirmed report from a Russian military acquaintance that Russia will go into East Ukraine late next week. This is further confirmed by my analysis of Russian media and physical Russian troop buildup along Ukraine’s border. In addition, this is further confirmed by Pentagon’s warning and direct warning against such action by President Obama. I will have much more on this on Monday as I need to verify this information from another source (I am trying to track someone down). Thursday, April 4th was mentioned as the date. 

If true, anticipate the stock market to crater next week. This action will provoke a completely different ball game in the international community. One thing is for sure, this will be an interesting week to watch.   

TECHNICAL ANALYSIS: 

Long-Term: The trend is still up. Market action in January-February could be viewed as a simple correction in an ongoing bull market. 

Intermediary-Term: Since February 5th, intermediary term picture shifted from negative to positive. Giving us a technical indication that both the intermediary term and the long term trends are up. Yet, that in itself can be misleading as per our timing analysis discussion below.

Short-Term: While the short-term trend remains bullish, it might be misleading as per our timing analysis discussion below.  

Again, even though all 3 trends are bullish for the time being, that might be misleading. Please read our Mathematical and Timing Analysis to see what will transpire over the next few weeks.    

MATHEMATICAL & TIMING ANALYSIS:  

(*** Please Note: This time around about 90% of the information contained within this section has been deliberately removed as it contain too much technical information. Particularly, exact dates and prices of the upcoming turning points. As well as trading forecasts associated with them. I deem such information to be too valuable to be released onto the general public.  As such, this information is only available to my premium subscribers. If you are a premium subscriber please Click Here to log in. If  you would be interested in becoming a subscriber and gaining access to the most accurate forecasting service available anywhere, a forecasting service that gives you exact turning points in both price and time, please Click Here to learn more.Don’t forget, we have a risk free 14-day trial).  

Based on our mathematical and timing work the next turning point is located at

Date: XXXX 
Price: XXXX

XXXX

Point being, you should have an exact strategy and entry/exit points based on the forecast above.  

The list below is for your reference point. It entails my investment strategy for my own investment purposes. While you are free to follow me, please do so at your own risk. Do not take this as a trading advice.

Stock

Entry Point ($)

Action To Take

XXXX

88

XXXX

XXXX

1160-1180

XXXX

XXXX

515

XXXX

XXXX

74

XXXX

XXXX

21

XXXX

XXXX

420

XXXX

XXXX

35

XXXX

XXXX

65

XXXX

XXXX

120

XXXX

XXXX

100

XXXX

XXXX

112

XXXX

Otherwise, I suggest the following positioning over the next few days/weeks to minimize risk while positioning yourself for a forecasted market action. (This is continuation of our previous positioning).

If You Are A Trader:  XXXX

If No Position:  XXXX

If Long: XXXX

If Short:  XXXX

CONCLUSION: 

An incredibly important week is coming up. Only one scenario remains on the table. I have also described the point force we are looking at and exactly what you should do in each case. With increased volatility, multiple interference patterns and an incredibly important long-term turning point we must be very careful and risk averse here.  Those anticipating the moves and those who can time them properly will be rewarded appropriately.

Please Note: XXXX is available to our premium subscribers in our + Subscriber SectionIt’s FREE to start. 

Did you enjoy this article? If so, please share our blog with your friends as we try to get traction. Gratitude!!!


Click here to subscribe to my mailing list


Weekly Market Update, Analysis & Forecast  Google

Weekly Update & Stocks To Short. March 22nd, 2014. InvestWithAlex.com

z24

Weekly Update & Summary: March 22nd, 2014

Overall it was a good week for the market with the Dow Jones up +237 points (+1.48%) and the Nasdaq up +31 points (0.74%) for the week. Structurally, the market did very well, leaving only one big gap behind at around 16,050. I believe the market will go back to close this gap when the bear market initiates.

FUNDAMENTAL & MARKET ANALYSIS: 

As per our timing and mathematical work below, the market will continue to shift gears from bull market to bear market throughout 2014. Longer term, this bear market will last between 2014-2017 as I have indicated many times before. While it’s internal structure will not be as violent and as steep as the 2007-2009 bear market leg, investors should anticipate the market to lose 35-40% when it’s all said and done.

(If you would be interested in learning exactly when this bear market will start and its internal structure, please Click Here

In last week’s update we talked about some of the best ways to approach the bear market and what you should and shouldn’t be doing. To see that report please Click Here. In this week’s update we will take a look at some of the best stocks to short and how you should approach the entire process.  

Step #1: Find Highly Speculative and/or Overpriced Stocks.

The list below should get you going. Click on it to see larger image.

short stocks

Step #2: Find Force Multipliers

In addition to performing technical and fundamental analysis, look for force multipliers. These are the stocks that move at X to market. For example, if the Nasdaq index moves 4%, a stock with 3X force multiplier will move 12%. All you have to do is compare index moves with the individual stock moves during the same period of time. The higher the multiplier, the higher rate of return you should anticipate.

If you believe the market is going decline substantially, it makes a lot of sense to take a short position in such stocks. If the market declines 20%, it is highly probable such stocks will decline 40-60%. Yet, this is not without risk. At times stocks move at X to market due to their fundamental outperformance. In such cases, the declines will be less than overall market. That is why fundamental and technical analysis become so important. You must first figure out if the stock is simply overpriced/overhyped or if there is substance to its outperformance.

Step #3: Take Position

Whatever your trading strategy is, once the bear market starts, execute it. As you know, shorting is inherently riskier and should be treated that way. Keep tight stop losses and execute your risk management strategies to the best of your ability.

That about covers it. If you believe the bear market is just around the corner (as we do), get yourself ready if you are interested in participating on the short side. Identify stocks to short, zero in on force multipliers, execute and minimize risk. Good luck and profit greatly. If you would be interested in learning exactly when this bear market will start and its internal structure, please Click Here.  

MACROECONOMIC ANALYSIS:

Ukraine continues to dominate the news.

While the markets were able to ignore the news this week, that might change over the next few weeks and into April. As I have mentioned here before,  Putin was willing to walk away with Crimea and call it a day if the West wasn’t hell bent on sanctions. Unfortunately, I don’t believe the West is done, just yet, with either Ukraine or sanctions. If they continue to slap Putin with sanctions he will have no choice but to respond with a military force in Ukraine over the next few weeks. 

Let me put it this way. If the West (US or EU) slam Russia or Putin with further sanctions, Putin WILL invade Eastern Ukraine.  There will be no fighting and Eastern Ukraine will quickly ask to become a part of Russia. This will create a downward spiral in foreign relations, a massive geopolitical risk and a possible selloff in US equities(see timing & mathematical section).

TECHNICAL ANALYSIS:

Long-Term: The trend is still up. Market action in January-February could be viewed as a simple correction in an ongoing bull market. 

Intermediary-Term: Since February 5th, intermediary term picture shifted from negative to positive. Giving us a technical indication that both the intermediary term and the long term trends are up. Yet, that in itself can be misleading as per our timing analysis discussion below.

Short-Term: While the short-term trend remains bullish, it might be misleading as per our timing analysis discussion below.  

Again, even though all 3 trends are bullish for the time being, that might be misleading. Please read our Mathematical and Timing Analysis to see what will transpire over the next few weeks.    

MATHEMATICAL & TIMING ANALYSIS: 

(*** Please Note: This time around about 90% of the information contained within this section has been deliberately removed as it contain too much technical information. Particularly, exact dates and prices of the upcoming turning points. As well as trading forecasts associated with them. I deem such information to be too valuable to be released onto the general public.  As such, this information is only available to my premium subscribers. If you are a premium subscriber please Click Here to log in. If  you would be interested in becoming a subscriber and gaining access to the most accurate forecasting service available anywhere, a forecasting service that gives you exact turning points in both price and time, please Click Here to learn more.Don’t forget, we have a risk free 14-day trial).  

Based on our mathematical and timing work the next turning point is located at

Date: XXXX 
Price: XXXX

XXXX

Others are getting very close.   

The list below is for your reference point. It entails my investment strategy over the next few weeks for my own investment purposes. While you are free to follow what I do, please do so at your own risk. Do not take this as a trading advice.    

Stock

Entry Point ($)

Action To Take

QQQ

88

XXXX

XXXX

1160-1180

XXXX

XXXX

515

XXXX

XXXX

74

XXXX

XXXX

21

XXXX

XXXX

420

XXXX

XXXX

35

XXXX

XXXX

65

XXXX

XXXX

120

XXXX

XXXX

100

XXXX

XXXX

112

XXXX

Otherwise, I suggest the following positioning over the next few days/weeks to minimize risk while positioning yourself for a forecasted market action. (This is continuation of our previous positioning).

If You Are A Trader: XXXX

If No Position: XXXX

If Long: XXXX

If Short:  XXXX

CONCLUSION: 

An incredibly important week is coming up. Only one scenario remains on the table. I have also described the point force we are looking at and exactly what you should do. Wiith increased volatility, multiple interference patterns and an incredibly important long-term turning point we must be very careful and risk averse here.  Those anticipating the moves and those who can time them properly will be rewarded appropriately.

Please Note: XXXX is available to our premium subscribers in our + Subscriber Section. It’s FREE to start. 

Did you enjoy this article? If so, please share our blog with your friends as we try to get traction. Gratitude!!!


Click here to subscribe to my mailing list


Weekly Update & Stocks To Short. March 22nd, 2014. InvestWithAlex.com Google

Stock Market Weekly Update. March 15th, 2014. InvestWithAlex.com

Daily Chart March 15, 2014 investwithalex

Weekly Update & Summary: March 15th, 2014

The market sold off throughout the week with the Dow Jones being down -387 points (-2.35%) and the Nasdaq being down -91 points (-2.09%) for the week. Structurally, the market closed a giant gap that was left behind on March 4th, which could be considered as bullish. At the same time, it left no holes on the upside, which is bearish.

FUNDAMENTAL & MARKET ANALYSIS: 

As per our timing and mathematical work below, the market will continue to shift gears from bull market to bear market throughout 2014. Longer term, this bear market will last between 2014-2017 as I have indicated many times before. While it’s internal structure will not be as violent and as steep as the 2007-2009 bear market leg, investors should anticipate the market to lose 35-40% when it’s all said and done.

(If you would be interested in learning exactly when this bear market will start and its internal structure, please Click Here

In today’s report I would like to concentrate on the best way to approaching this bear market and what you can and should be doing. Based on my calculations, the upcoming bear market will last approximately 625 trading days. At the present “Market Energy Level” the market oscillates at approximately 20 points per day. Further, based on my bear market terminal point calculation, at this energy level the market will reach it’s terminal point within 275 days.

If you are confused, don’t be. This simply means the upcoming bear market will not be directional. It will be volatile with lots of ups and downs. As such, you have a number of options if you would like to make money in this market.

Option #1: Just get out and stay in cash or short-term treasury. You won’t make much money, but you won’t lose any either. When the bear market completes, you will be able to come in at the market bottom and buy some great businesses at cheap prices. Plus, you will get a side benefit of sleeping well for over two years.   

Option #2: Go short and forget about it. Again, this is not for the faint of heart. The market will be very volatile. Yet, if you can hold on to your position you will be able to walk away with a 30% or so gain when it’s all said and done.

Option #3: Based on my calculations the market will offer up a total of 10,000-12,000 points over the next 2.5-3 years. That includes both, bull and bear legs. Theoretically, if one trades in and out of the market at the right spots (what we are trying to do here) one should be able to walk away with a 50-75% return. Yet, this requires a certain skill set and nerves of steel. It is next to impossible to do. With mistakes, I believe a 40% return here is the best case scenario.

Which option is the best one for you? That should depend on your personal investment style and risk profile. If I wasn’t in an active money management and advisory service business, I would most definitely go with option #1 or #2.  Yet, since I am doing what I am doing, I will be concentrating on option #3.

Next week, we will take a look at the best stocks to short in order to maximize returns even more. Plus, some actual short picks. I call them force multipliers.

MACROECONOMIC ANALYSIS:  

Ukraine continues to dominate the news.

It is very difficult to ascertain if the situation is dying down or about to blow up into a full on military conflict between Russia, Ukraine and possibly NATO. There are two possible outcomes here.

Outcome #1:  Crimea will vote to join Russia over the weekend. That is a given and already priced into the market. At this juncture the West huffs, puffs, pounds the table and maybe even implement sanctions. Russia calms down and things will die off over the next couple of weeks.

Outcome #2:  Outcome #1, but Russia decides to continue fighting by “invading” east Ukraine. This opens up a whole another dimension between Russia and the West. Sanctions against Russia at that juncture are almost a guarantee. While the West will not go in, it would be interesting to see if Russia decides to retaliate against the West and where that would lead us thereafter. This scenario is too unpredictable at this stage.

If I had to guess, Russia will walk away with Crimea and call it a day. No sanctions will be implemented. At that juncture, Ukraine will become a proxy playground for the West Vs. Russia where east and west Ukraine continue to clash, possibly escalating into a civil war.  Too bad for the people there. 

TECHNICAL ANALYSIS: 

Long-Term: The trend is still up. Market action in January-February could be viewed as a simple correction in an ongoing bull market. 

Intermediary-Term: Since February 5th, intermediary term picture shifted from negative to positive. Giving us a technical indication that both the intermediary term and the long term trends are up. Yet, that in itself can be misleading as per our timing analysis discussion below.

Short-Term: While the short-term remains bullish as of right now, it might turn bearish if the point discussed in the mathematical & timing section is breached.

Again, with all 3 trends being bullish for the time being, this might be misleading. Please read our Mathematical and Timing Analysis to see what will transpire over the next few weeks.    

MATHEMATICAL & TIMING ANALYSIS:  

(*** Please Note: This time around about 95% of the information contained within this section has been deliberately removed as it contain too much technical information. Particularly, exact dates and prices of the upcoming turning points. As well as trading forecasts associated with them. I deem such information to be too valuable to be released onto the general public.  As such, this information is only available to my premium subscribers. If you are a premium subscriber please Click Here to log in. If  you would be interested in becoming a subscriber and gaining access to the most accurate forecasting service available anywhere, a forecasting service that gives you exact turning points in both price and time, please Click Here to learn more.Don’t forget, we have a risk free 14-day trial).  

XXXX

Hence, I suggest the following positioning over the next few days/weeks to minimize the risk while positioning yourself for a forecasted market action. (This is continuation of our previous positioning).

If You Are A Trader: XXXX 

If No Position: XXXX

If Long: XXXX  

If Short:  XXXX

CONCLUSION: 

An incredibly important week is coming up. Above, I have described two possible scenarios we are working with. I have also described the point force we are looking at and exactly what you should do in each case. With increased volatility, multiple interference patterns and an incredibly important long-term turning point we must be very careful and risk averse here.  Those anticipating the moves and those who can time them properly will be rewarded appropriately.

Please Note: XXXX is available to our premium subscribers in our + Subscriber SectionIt’s FREE to start. 

Did you enjoy this article? If so, please share our blog with your friends as we try to get traction. Gratitude!!!


Click here to subscribe to my mailing list


Stock Market Weekly Update. March 15th, 2014. InvestWithAlex.com Google

5-Year Market Cycles & Weekly Update. A Must Read. Trust Me.

z15

Weekly Update & Summary: March 8th, 2014

The market continued its bull move with the Dow Jones being up +108 points (0.67%) and the Nasdaq being up +28 points (0.65%) for the week. Structurally, the market left another gap at 16360 (in addition to the one last week at 16,100). Plus, there are a number of gaps going all the way down to 15,500. All of them are to be closed during the upcoming bear market leg.   

Fundamental & Market Analysis:

Last week we looked at the 17 year alternating Bull and Bear market cycles and why this Bear market that started in 2000 will complete itself only in 2017. Today, I would like to take a quick look at the 5-Year Cycle and the reason for today’s bull market.

Particularly, let’s take a look at the two most recent 5-Year Cycles and how they apply to today’s stock market.

Long Term Dow Cycles 5

#1: 5-YEAR CYCLE 1994 Bottom To 2000 Top.

This cycle started on December 9th, 1994 and completed on January 14th, 2000. During this time the stock market moved 8269 points in 1287 trading days. In calendar terms, the cycle took 5 Years and 36 Days to complete. We all know what happened afterwards.

#2: 5-YEAR CYCLES 2002 Bottom to 2007 Top

This cycle started on October 10th, 2002 and completed on October 11th, 2007. During this time the stock market moved 7098 points in 1259 trading days. In calendar terms, the cycle took 5 Years and 1 Day to complete. We all know what happened afterwards. 

TODAY’S-5 YEAR CYCLE  2009 Bottom to 2014 Top ?

This cycle started on October 6th, 2009 and is scheduled to complete itself on XXXX. As of today, the stock market moved 10036 points in 1260 trading days. In calendar terms, we are exactly at 5 years.  The questions here is as follows….

Are we currently developing the 5 cycle or are we in the cyclical bull market? If yes, when will this cycle top out and what’s next?

While I have the exact answer, unfortunately, that answer is available to my premium subscribers only. Please Click Here.

Now, the sample above is just two cycles. There are many more. Here are just a few from off the top of my head. 1924-1929, 1932-1937, 1961-1966, 1982-1987.  

In summary, 5-Year cycle is an incredibly important cycle and represents one completed growth cycle within the stock market. When it completes, the market tends to shift gears and change trends. In some of my earlier forecasts I have suggested that the Dow topped out on December 31st, 2013 ushering in the bear market of 2014-2017. That should make it very clear what happens next. If you would be interested in an exact breakdown, please visit our Subscriber section. 

Macroeconomic Analysis: 

The situation in Ukraine continues to escalate.

With the US, the EU and Russia throwing out insults and threatening sanctions against each other, this situation might very well become the “fundamental” tipping point for the market as early as next week. Today, I would describe the situation as a tightrope balancing act. It might die down over the next couple of weeks, but it might also escalate to unimaginable level. Fast. Whatever happens, this is not a good sign for Russia/US relationship going forward.

It would be interesting to see if the point of force described in the Mathematical & Timing section below would be the same point where things between the US and Russia escalate further.

Technical Analysis: 

The overall technical picture is clearing up.

Long-Term: The trend is still up. Market action in January-February could be viewed as a simple correction in an ongoing bull market. 

Intermediary-Term: Since February 5th, intermediary term picture shifted from negative to positive. Giving us a technical indication that both the intermediary term and the long term trends are up. Yet, that in itself can be misleading as per our timing analysis discussion below.

Short-Term: Short-term trend has turned bullish as well.

While all 3 trends are bullish, this might be misleading. Please read our Mathematical and Timing Analysis to see what will transpire over the next few weeks.    

Mathematical & Timing Analysis: 

(*** Please Note: This time around about 90% of the information contained within this section has been deliberately removed as it contain too much technical information. Particularly, exact dates and prices of the upcoming turning points. As well as trading forecasts associated with them. I deem such information to be too valuable to be released onto the general public.  As such, this information is only available to my premium subscribers. If you are a premium subscriber please Click Here to log in. If  you would be interested in becoming a subscriber and gaining access to the most accurate forecasting service available anywhere, a forecasting service that gives you exact turning points in both price and time, please Click Here to learn more.Don’t forget, we have a risk free 14-day trial). 

XXXX

Date Target: XXXX
Price Target:  XXXX

XXXX

Hence, I suggest the following positioning over the next few days/weeks to minimize the risk while positioning yourself for a forecasted market action.

If You Are A Trader: XXXX

If No Position: XXXX

If Long: XXXX

If Short:  XXXX

CONCLUSION: 

An incredibly important week is coming up. Above, I have described the point of force, various possibilities and exactly what you should do in each case. With increased volatility, multiple interference patterns and an incredibly important long-term turning point we must be very careful and risk averse here.  Those anticipating the moves and those who can time them properly will be rewarded appropriately.

Please Note: XXXX is available to our premium subscribers in our + Subscriber Section. It’s FREE to start. 

Did you enjoy this article? If so, please share our blog with your friends as we try to get traction. Gratitude!!!


Click here to subscribe to my mailing list


5-Year Market Cycles & Weekly Update. A Must Read. Trust Me. Google

What You Ought To Know About This Secular Bear Market. Plus, Weekly Market Update.

daily chart Feb 28, 2014

Weekly Update & Summary: February 28th, 2014

The market continued its bull move with the Dow Jones being up +218 points (1.36%) and the Nasdaq being up +44 points (1.05%) for the week. Structurally, the market did very well, leaving only one gap behind….at 16,100. There are still a number of gaps going all the way down to 15,500 on the Dow, but all of them will be closed during the upcoming bear market leg.   

FUNDAMENTAL & MARKET ANALYSIS: 

During the week Charles Schwab Chief Investment Strategist, Liz Ann Sonders, claimed that the bull run stocks have enjoyed for the last five years is not over yet. According to her, “I think what started five years ago was the beginning of a secular bull market, not just a cyclical bull within an ongoing bear.”   

This is an important claim that we must discuss. This will help me explain, once again, where we are in the cycle. If you are not familiar with the terminology….

Secular Bull Market ……. is a long term bull market. For example, what we saw between 1982-2000.

Cyclical Bull Market Within Ongoing Bear…..is a bear market rally. For instance, the move between 2002/03 bottom to 2007 top.

So, what she is saying is that the bear market that started in January of 2000 is now over and that the new long term bull market started at 2009 bottom. There is just one problem with her statement.

Liz Ann Sonders didn’t do her market homework. Since the stock market officially “opened” in May of 1790 there hasn’t been a single bear market that lasted 9 years. Not a single one if you understand the cyclical composition and market structure. Why would it be different this time? It is not.

In fact,  the market oscillates in bull and bear market cycles that on average last 17-18 years. There is a reason for that, but let me illustrate instead of telling you. Let’s take a closer look

Long Term Dow Structure3

  • 1897-1914 Bear Market. (17 Years).
  • 1914-1932 Bull Market. (18 Years). * Please note, the last 3 years of this cycle 1929-32 we had a cycle inversion. I will talk about it in my future writings, for now, its outside the scope of our discussion.
  • 1932-1949 Bear Market (17 Years).
  • 1949-1966 Bull Market ( 17 Years).
  • 1966-1982 Bear Market (17 Years).
  • 1982-2000 Bull Market (18 Years).
  • 2000-2009 Bear Market ? ….I don’t think so….

As you can clearly see, bull and bear markets alternate in 17-18 year cycles. Any notion that, somehow, this bear market was only 9 years long and we are now in a cyclical bull market is ludicrous.  

This is further confirmed by my mathematical work. What we have seen between March 2009 bottom and today was a simple bear market rally, even if it did set a new high. It was a 5 year cycle (exactly the same as in 2002-2007) and it is now done. Cyclical bear markets tend to finish off with a 2-3 year down moves and that is, once again, being confirmed by my calculations.

I have stated on numerous occasions that the stock market has topped out on December 31st, 2013, ushering in the final leg of the bear market. When this bear market completes the Dow Jones will be well below it’s 2000 top of 11,800……essentially tracing out a flat move over an 17 year period of time. Exactly what a bear market should look like.

I hope this brings further awareness and understanding of where we are in this economic and market cycle. If you want more precise timing capability, please take a look at our Timing Analysis section below.

MACROECONOMIC ANALYSIS:  

One word. Ukraine.

As I have mentioned in one of my posts during the week, there is absolutely no way in hell that Russia will let Ukraine go.  What we are seeing today is indicative of that stand.  If you are not following the story, here is what had transpired.  The EU Bureaucrats and the US Government have decided that it would be a good idea to destabilize Ukraine after Ukrainian government decided to go forward with Russia instead of joining the EU or NATO.  Thus far, the western governments were successful it toppling Ukrainian President and “claiming victory”.

However, here is what even a retarded CIA/NSA analyst should understand. Russia will never let Ukraine go.  It will go to war over that territory if need be and that is exactly what we are seeing today. Obama coming out and “WARNING” Russia does nothing but infuriate Russia even more. Again, the US Government has no business in Ukraine.  Ukraine is a split nation and when Obama talks about the “Ukrainian People who want freedom and closer ties to the EU” he talks about 25% of Ukrainian population at best.  The bottom line is this, Russia will take it and no one will stop it.

Is this important? Will this impact our financial markets?  While it will not have any impact on the US financial markets  (outside the spectrum of our forecasts) it is an incredibly important geopolitical event. It is quite possible that when we look back, this event will be indentified as the beginning of the Cold War II between Russia and the West. With one big difference. Russia will have an incredibly strong partner on its side that it didn’t have last time…..China.  This is a fascinating development that will impact us all over the next few decades.

TECHNICAL ANALYSIS: 

While the overall technical picture is clearing up.

Long-Term: The trend is still up. Market action in January-February could be viewed as a simple correction in an ongoing bull market. 

Intermediary-Term: Since February 5th, intermediary term picture shifted from negative to positive. Giving us a technical indication that both the intermediary term and the long term trends are up. Yet, that in itself can be misleading as per our timing analysis discussion below.

Short-Term: Short-term trend has turned bullish as well.

While all 3 trends are bullish, this might be misleading. Please read our Mathematical and Timing Analysis to see what will transpire over the next few weeks.    

MATHEMATICAL & TIMING ANALYSIS:  

(*** Please Note: About 75% of the information contained within this section has been deliberately removed. Particularly, exact dates and prices of the upcoming turning points. As well as trading forecasts associated with them. I deem such information to be too valuable to be released onto the general public.  As such, this information is only available to my premium subscribers. If you are a premium subscriber please Click Here to log in. If  you would be interested in becoming a subscriber and gaining access to the most accurate forecasting service available anywhere, a forecasting service that gives you exact turning points in both price and time, please Click Here to learn more.Subscription is through lottery only. Don’t forget, we have a risk free 14-day trial). 

I continue to believe that March will be a very volatile month. We have a number of interference patterns in play, indicating a number of strong and powerful bull/bear moves. With that said, I believe Friday’s market action has cleared a lot of question marks. Primarily, XXXX. 

In addition, the market closed two important gaps all the way up to 16,400 that were left there in January. I have talked about these gaps on numerous occasions, suggesting that the market must close said gaps before any meaningful bear market can start. That was done today, clearing the way for the market to XXXX

While there are a number of important turning points in March (indicating interference), there is one particular price point that works very well. As such, I propose the following turning points.

Date: XXXX
Price Target: XXXX

Explanation: XXXX

Hence, I suggest the following positioning over the next few days/weeks to minimize the risk while positioning yourself for a forecasted market action.

If You Are A Trader: XXXX

If No Position: XXXX

If Long: XXXX

If Short:  XXXX

CONCLUSION: 

We have a couple of existing and challenging weeks coming up. March of 2014 presents us with numerous high probability turning points. Indicating volatility, multiple interference patterns and an incredibly important long-term XXXX. Those anticipating the moves and those who can time them properly will be rewarded appropriately. Once the moves described above play out in full, the market will be set free to continue its next cyclical bear market leg. 

Please Note: XXXX is available to our premium subscribers in our + Subscriber Section. It’s FREE to start. 

Did you enjoy this article? If so, please share our blog with your friends as we try to get traction. Gratitude!!!

What You Ought To Know About This Secular Bear Market. Plus, Weekly Market Update.  Google

Idiots At The Gate. Plus, Weekly Stock Market Update & Forecast

daily chart Feb 22, 2014

Weekly Update & Summary: February 22nd, 2014

The market remained relatively flat for the week with the Dow Jones losing -51 points (-0.32%) while the Nasdaq gained 19 points (+0.46) Structurally, the market did very well, closing all the gaps during the span of the week.  There is still a gap left around 15,500 on the Dow, but it will be closed during the subsequent bear market leg.   

Fundamental & Market Analysis:

Over the last couple of years I have argued, sometimes passionately, that the Federal Reserve doesn’t really know what is going on within our own economy and our financial markets. Not only that, but I have also argued that they are a bunch of idiots and fools who believe that they can somehow control our financial markets.

If recently released transcripts, generated during the 2008 meltdown don’t prove my point of view without a shadow of a doubt, I don’t know what will. Here are just a few quick points from the said transcripts.

  • They didn’t even realize recession was happening until the 4th quarter of 2008. By that point the stock market has completed 80% of its down move.  In fact, for most of 2008 they thought the recession “could be avoided”.

—-Hello???? Was anyone home??? Recession started in Q4 of 2007.

  • Bernanke talked about pent-up demand for housing as late as January 2008.
  • Bernanke was worried about inflation as late as January 2008.
  • Throughout Q1 of 2008 they have held a generally rosy view of the world and the US Economy

Here are the links to two great articles about the transcripts if you would like to learn more. Click Here and/or Click Here

bernanke meme

The lesson here is twofold.

First, anyone who believes that the FED can either control, anticipate or predict financial markets and/or the economy is even a bigger fool.  Neither Bernanke nor Yellen can predict the economy even if it hit them in the face with a brick. All they can do is look at past data and say “Oh, look, according to this data recession started in Q4 of 2007”. What a waste of time and money.  

Second, they will always be behind the ball. They will always be a reactionary force as opposed to market makers. Take today’s environment for example. They are cutting QE and talking about raising the interest rates at exactly the wrong time. The damage from their crazy liquidity party has already been done. The worst thing they can do now is cut it. The faster they do it the faster the markets will collapse.  

Why is any of this important?

Well, if you rely on FED to make money in the stock market and/or run your own business it becomes incredibly important. As such, no one should rely on any action by the FED as an investment indicator. It is as simple as that.

This brings us to financial markets and my premise that financial markets behave exactly as they should. Many people would argue that it was the FED’s actions that put the bottom in at the March of 2009 juncture, ensuring a subsequent and massive stock market rally.

WRONG.

Don’t confuse cause and effect. It was the market that made the FED’s look good and not the other way around. The market was structured to bottom on March 6th, 2009 at 6,469 and then have a subsequent 5-year market rally. It was the mid-cycle bottom (half point of bear market) and I predicted it as early as January of that year. I was 1 day and 100 points away. Close enough. I know I have shown this chart before, but let’s take another look.

Long Term Dow Structure35

If you perform the type of 3-dimensional analysis that I do you would know that the move between 2003 bottom and 2009 bottom would be IDENTICAL to the move between 1994 bottom and 2002 bottom. And so it was, exhibiting a variance of 22 3-dimensional units (equivalent to a few trading days or 100 points).

Any analyst working with this information would know that as soon as 2007 top was confirmed that the next move down would be exactly 8,130 3-dimensional units. Once the market developed further, the same analyst would be able to pin point the exact bottom with amazing precision and that is what I want you to understand without a shadow of a doubt. The stock market is not volatile or random, it is exact and precise.

Same thing applies to today’s market. In last week’s forecast I identified a turning point in February. While I am not yet at liberty to discuss this turning point (available to premium subscribers only), it clearly explains the market action we have witnessed over the last couple of days. By concentrating on mathematics and 3-dimensional analysis one can pick out turning points with a precision of a surgeon.    

Macroeconomic Analysis: 

In a nutshell, Ukraine, Venezuela, Argentina and China. Argentina is on a verge of another default and I wrote about it before. Ukraine and Venezuela are both in the midst of violent revolutionary uprisings. While Venezuela will not have that much impact either way, Ukraine’s situation will have vast repercussions across the globe. Maybe not in economic terms, but certainly in geopolitical risk. All because of Russia. Having been born in Russia, let me tell you something. Russia is pissed off….big time.

They are pissed at a blatant American and EU interference into Russia’s business. Yes, Ukraine is Russia’s business. Always was and always will be. Just to give you a reference point, there would be a similar type of a reaction from the US if Russia was interfering in governance of Kentucky. Now, let’s take the “Ukranian people deserve freedom too and the US will go to any length necessary to see it happen” bullshit off the table. If you believe this crap, I have a $20 million bridge to sell you (give me a call).

What you see happening is the beginning of the next Cold War where both the US and Russia keep tearing into each other. With the only winners being the politicians and the military industrial complex. This is a negative development that should be watched carefully going forward. 

China’s shadow lending system continues to expand at breakneck speeds. No-one really knows for sure how big a problem China’s economy will eventually face due to the massive credit and money supply growth over the last few years. Since 2008 financial meltdown in particular. While no one has the real numbers, some of the estimates coming out of China are truly mindboggling. For instance, that China’s banking sector is now roughly the size of the US banking sector. With one primary difference. It took the US over 100 years of trial and error to get to that size, it took China roughly 5 years. Thus far China has been able to keep trouble at bay, but this is unlikely to continue much longer. Some sort of a blow up in China is imminent.

Technical Analysis: 

While the overall technical picture continues to remain murky, the resolution should be just around the corner.

Long-Term: The trend is still up. Market action in January-February could be viewed as a simple correction in an ongoing bull market. 

Intermediary-Term: Since February 5th, intermediary term picture shifted from negative to positive. Giving us a technical indication that both the intermediary term and the long term trends are up. Yet, that in itself can be misleading as per our timing analysis discussion below.

Short-Term: Is somewhat bearish. Please view our mathematical and timing analysis below for further understanding and explanation.

Mathematical & Timing Analysis: 

(*** Please Note: About 75% of the information contained within this section has been deliberately removed. Particularly, exact dates and prices of the upcoming turning points. As well as trading forecasts associated with them. I deem such information to be too valuable to be released onto the general public.  As such, this information is only available to my premium subscribers. If you are a premium subscriber please Click Here to log in. If  you would be interested in becoming a subscriber and gaining access to the most accurate forecasting service available anywhere, a forecasting service that gives you exact turning points in both price and time, please Click Here to learn more.Don’t forget, we have a risk free 14-day trial). 

Last week we concentrated on February XXXX, as a turning point. Here is the forecast that was provided.

Date: XXXX
Price: XXXX

Thus far, the vertical rally that started on February 5th ran into a brick wall. To be exact, the Dow topped out 1 hour into trading on February 19th at 16,225 and then proceeded to collapse 200 points.  Recovering thereafter and subsequently oscillating without going anywhere.  

So, what is going on? Have we hit our turning point?

XXXX

Hence, I suggest the following positioning over the next few days/weeks to minimize the risk while positioning yourself for a forecasted market action.

If You Are A Trader: XXXX  

If No Position: XXXX 

If Long: XXXX

If Short:  XXXX. 

CONCLUSION: 

We have an existing couple of weeks coming up. The week of February 24-28th should finally confirm February XXXX as a turning point. In March, we should see a number of big and very important turning points. I will start talking about them once the current stock market action resolves itself. Those anticipating the moves and those who can time them properly will be rewarded appropriately. Once the moves described above play out in full, the market will be set free to continue its next cyclical bear market leg. 

Please Note: XXXX is available to our premium subscribers in our + Subscriber Section. It’s FREE to start. 

Did you enjoy this article? If so, please share our blog with your friends as we try to get traction. Gratitude!!!

Idiots At The Gate. Plus, Weekly Stock Market Update & Forecast Google

Weekly Update & Market Forecast. Very Important Update

daily chart Feb 14, 2014

Weekly Update &Summary: February 15th, 2014

Markets continued to rally throughout the week with the Dow Jones appreciating 360 points (+2.28%) and the Nasdaq gaining 118 points (+2.86%). Structurally, the market did very well, closing all the gaps during the span of the week.  There was a gap left around 15,500 on the Dow, but it will be closed during the subsequent bear market leg.   

Most of the bears who were incredibly excited just two weeks ago are now throwing their hands in the air, in complete disbelief, proclaiming something to the tune of “f$&# this s*&#”. Blaming the FED, market manipulation and everything else under the sun for this unprecedented and powerful two week market rally.  Of course, exactly at the wrong time.

Listen, even though the Nasdaq has set a new all time high, the Dow remains over 400 points below its December 31st, 2013 top.  Plus, we have to take into the consideration the fact that the technical trend is still incredibly bullish. Showing no sign that the bear market has started……as per our claim.

So, what is going on?

Based on my mathematical work, the market is performing just as it should. As I always say, it’s the markets job to confuse, frustrate and destroy as many investors as possible. And that’s exactly what it is doing.  

In my original forecasts in 2013 I have suggested that March of 2014 will be the top of the bull market. That was until I came across a missing piece of data suggesting that December 31st of 2013 was indeed the top. Meaning, as of right now the market continues to trace out the necessary pattern towards its ultimate price and time targets in March of 2014. Yes, a XXXX. 

There is another important point to consider. While it is fairly easy to predict the market over an extended period of time (Ex: 2017 bottom of the bear market) it becomes increasingly difficult to do as the time frame compresses from annual, to monthly, to daily, to hourly, etc…. That has to do with a number of data points an analyst has to consider while working with smaller time frames. Simply put, the amount of available mathematical and cyclical data multiplies exponentially as one begins to narrow down the time frame.

What does that mean? It means that it becomes increasingly complex to predict the market over the short time frames. Not impossible, just more difficult.

Which brings us today’s market environment. We have a number of very important points of force coming up over the next few weeks (described below). Points of force that, at least based on my analysis, clearly outline the market structure over the next few weeks and months. If we are to execute our trading strategy properly, we should be able to walk away with significant gains. All while most other market participants are left behind to scratch their heads in outer confusion. As always.   

Please find the points of force (turning points) and the trading strategy associated with it in the Mathematical & Timing Analysis Section below.  

Fundamental Analysis: 

There has been no change in the fundamental picture. As you know, my fundamental case remains fairly straight forward and clear cut. All stocks and most other markets (credit and real estate) are substantially overvalued due to a massive infusion of credit by the FED over the last few years and pure speculation. How overvalued are we?  

1929-2014-Scary-Chart-021414

Well, during the week there has been a lot of hoopla made about the chart above. Comparing today’s market pattern to the one right before the 1929 stock market crash. Claiming that today’s market is tracing out the same patter, right before the crash.

Certainly, if we look at the chart from the fundamental point of view we can argue that the market is indeed incredibly overpriced and is set for a huge, maybe a  90% huge drop.

Let me just say that the collapse is not going to happen. At least based on my mathematical work. First, comparing patterns between today’s market and the market in 1929 is like comparing oranges to tractors. It is meaningless. One must understand where we are in cyclical composition of the market. And we are nowhere near 1929. If you have to compare, 1912, 1946 and 1981 would be much better options.

Second, simply because the market is overpriced, it doesn’t mean that it is about to collapse 90%. It doesn’t work that way. Remember the market has an internal structure. It is exact and perfect. It always does what it is supposed to do by tracing out its points of force. Any move outside of such points would be equivalent to Earth suddenly jumping into Saturn’s orbit for no apparent reason at all.

The lesson for this week is as follows…..

Even though the market is incredibly overpriced (as per my discussion last week) and even though some patterns “look” similar to the ones leading into the 1929 crash, it doesn’t mean anything. Particularly when it comes to making money through investing and/or trading.  

Macroeconomic Analysis: 

There is so much to report here that I am beginning to think that the entire world is going to hell in a hand basket. From Nikkei shifting into downtrend again, to Spain and Turkey deciding to jointly build an aircraft carrier. Because you know, having hyperinflation, collapsing currency, economic depression and 25% unemployment between both countries is not enough. I am just curious to find out who will control any such aircraft carrier. Perhaps it will be Turkey from Monday to Thursday and Spain from Thursday to Sunday. God forbid if they decide to go into war against each other. My brain is starting to hurt just thinking about this stupidity.  

Then you have a slow down in Germany and EU bureaucrats discussing numerous scams of how they can raise enough capital to sustain the EU. Including a plan to outright confiscate/control savings of EU citizens. No, I am not kidding you. Of course, most of it (if not all of it) is the direct result of an insane monetary policy our leaders have put into action over the last two decades. The idea that we can somehow print our way to prosperity. It only works, until it doesn’t.

Technical Analysis: 

While the overall technical picture continues to remain murky, the resolution should be just around the corner.

Long-Term: The trend is still up. Market action in January-February could be viewed as a simple correction in an ongoing bull market. 

Short-Term: The short term picture shifted from negative to positive. Giving us a technical indication that both the short term and the long term trends are up. Yet, that in itself can be misleading as per our timing analysis discussion below.

Mathematical & Timing Analysis: 

(*** Please Note: About 75% of the information contained within this section has been deliberately removed. Particularly, exact dates and prices of the upcoming turning points. As well as trading forecasts associated with them. I deem such information to be too valuable to be released onto the general public.  As such, this information is only available to my premium subscribers. If you are a premium subscriber please Click Here to log in. If  you would be interested in becoming a subscriber and gaining access to the most accurate forecasting service available anywhere, a forecasting service that gives you exact turning points in both price and time, please Click Here to learn more. Don’t forget, we have a risk free 14-day trial). 

As mentioned in my earlier forecasts, we are looking at February XXXX as a major turning point.To be exact, this particular turning point is located at…

Date: XXXX
Price: XXXX

Hence, I suggest the following positioning over the next few days/weeks to minimize the risk while positioning yourself for a forecasted market action.

If You Are A Trader: On February XXXX, we will be looking for a confirmation that the market has hit its turning point (as per above) and has reversed itself……on an hourly chart. Once such confirmation occurs, I would liquidate our……….

If No Position: XXXX

If Long: XXXX

If Short:  XXXX

CONCLUSION: 

We have an existing couple of weeks coming up. A few major turning points and a number of significant moves. Those anticipating the moves and those who can time them properly will be rewarded appropriately. Once the moves described above play out in full, the market will be set free to continue its next cyclical bear market leg. 

Please Note: XXXX is available to our premium subscribers in our + Subscriber Section. It’s FREE to start. 

Did you enjoy this article? If so, please share our blog with your friends as we try to get traction. Gratitude!!!

Weekly Update & Market Forecast. Very Important Update  Google

Weekly Stock Market Update. InvestWithAlex.com February 8th, 2014

2/8/2014

daily chart Feb 7, 2014

Continue to maintain a LONG/HOLD position -OR- In CASH .

Weekly Summary: 

Quite a volatile week. We started off with a massive drop on Monday, subsequent stabilization and a rally towards the end of the week. When it was all said and done the Dow Jones gained 95 points (+0.61%) while the Nasdaq gained 22 points (0.54%).  The volatility is back and that’s a good thing. Structurally, the market did very well, leaving only one gap unfilled. That was on Thursday (around 15,500) and it is highly probable (based on my work) the market will go back to close this gap next week.  

The question on everyone’s mind is…..

Is this correction over? Can we get on with the bull market?

Not so fast. As I have indicated many times on this blog already, the Dow Jones topped out on December 31st, 2013 at 16,588. My mathematical analysis and work confirm that. What we are witnessing right now is the first stage of the bear market that will take us into the 2017 bottom. Again, the structure of the upcoming bear market move will be very similar to the bear market move between January of 2000 and March of 2003.

In short, a lot of volatility, a lot of violent ups and downs and a general downtrend that will take us into the 2017 bottom. Such internal market structure will make it very difficult for all (longs, shorts and traders) to make money in this market. You only have two options.

First, you can simply go short for the duration of the move. But only after the bear market is confirmed. If that is not exciting enough, you might want to concentrate on timing bull/bear moves over the next few years to maximize your returns. BTW, that is exactly what we specialize in here. Please check out our +Subscribe section.

Thus far, our model portfolio (within our premium section) has been in cash @ 10 Year Note, helping us avoid the decline while we wait for a bear market confirmation. Otherwise, I recommend people to maintain their LONG/HOLD positions.  

Remember, there is vast difference between proper or exact timing and smart money management.   

Fundamental Analysis: 

There has been no change in the fundamental picture. As you know, my fundamental case remains fairly straight forward and clear cut. All stocks and most other markets (credit and real estate) are substantially overvalued due to massive infusion of credit by the FED over the last few years and pure speculation. How overvalued are we?  

market to gdp

The chart above is just another data point we can use in our analysis and comes to us via courtesy of Dshort.com. The chart essentially indicates that today’s overall market valuation is above 2007 valuation levels. Looking back, we know that valuation levels at 2007 were extreme and subsequent collapse to the tune of 60% proved that without a shadow of the doubt.

While we have already surpassed 2007 levels, the market is still below 2000 levels. Does that mean you can breathe a sigh of relief? Not in the slightest.

Here is why…..

Speculative levels of 2000 tech bubble were caused by simple speculation in the tech sector and subsequent excesses throughout the economy/markets. Today’s valuation excesses are caused by massive infusion of credit. When we take that into consideration, I would argue that today’s valuation levels (once again, driven by credit) are higher than 2000 valuation levels. When the credit is finally withdrawn or becomes ineffective, both occurring simultaneously in today’s environment, the valuations are bound to collapse.    

Macroeconomic Analysis: 

An interesting week. Both Ukraine and Argentina are putting capital controls into their markets, indicating an upcoming economic collapse in both countries. A number of economist came out blaming “Emerging Markets” for market instability within the US. Of course, they are once again wrong. It is the not the Emerging Markets that are causing problems throughout the world, but the US Economy and the end of the credit binge that is causing all sorts of problems. It simply being felt more prominently in a weaker emerging market economies. That will soon change.  

Japan continues to try spark its economic growth through monetary intervention, currency devaluation and angering menstruating women.  All idiotic moves leading to an eventual disaster.  The UE bureaucrats continues to pretend that everything is fine by offering Greece further extensions in hopes that Greece will pay them back. I think it’s time for the EU to admit that it is never going to happen. In fact, they might as well usher in the unavoidable and the unthinkable. Greek default.  

Technical Analysis: 

While the overall technical picture continues to remain murky, the resolution should be just around the corner.

Long-Term: The trend is still up. Market action in January-February could be viewed as a simple correction in an ongoing bull market. 

Short-Term: Even though the market bounced from Tuesdays lows, the short term picture remains down. Please see my timing analysis for further instructions. 

Overall, we must wait for a confirmation before taking a short position. 

Mathematical & Timing Analysis: 

We have two possible scenarios playing out.  

As mentioned in our daily updates, my mathematical timing work indicates a significant turning point on February xxxx with the initial price target of xxxx. As of right now, I believe the bounce we have experienced over the last few days is just that, a bounce. As such, I anticipate the market to roll over early in the week and continue its bear move to hit the price/time targets below.

However, in case we do get a follow through of the current rally early next week, I would have to adjust my view and call for a top (instead of a bottom) on February xxxx. If this scenario comes to fruition we might be at an important juncture of bear market confirmation. As such, the first few trading days of the upcoming week is incredibly important.  

Time Targets: xxxx

Price Targets: xxxx

CONCLUSION: 

If you are out of the market as we have been, stay out. If you are still fully invested consider liquidating your positions as we go through a rebound over the next few weeks. Once the rebound plays itself out and the market confirms the next bear leg down, I would recommend going short at that time. 

Please Note: XXXX is available to our premium subscribers in our + Subscriber Section

Did you enjoy this article? If so, please share our blog with your friends as we try to get traction. Gratitude!!!

Weekly Stock Market Update. InvestWithAlex.com  February 8th, 2014 Google

Weekly Investment Update and Summary. February 1st, 2014. InvestWithAlex.com

daily chart Jan31, 2014

Continue to maintain a LONG/HOLD position.

Weekly Summary: 

Even thou the market had a number of significant down days during the week, the Dow Jones ended up down only -180 points or (-1.14%). Both the Nasdaq and the S&P fared much better. Loosing only -24 points (-0.59%) and -7.7 points (-0.43%) respectively. 

If this week can teach us anything, its that volatility is back. Every trading session was opened up with a fairly large gap. With Fridays gap being close to 200 points on the DOW. What does that mean?

It means the cyclical composition of the market has shifted from a general uptrend exhibited in 2013 and for the large part since the start of this bull market leg in March of 2009 to a bear market leg identified here last week. 

Again, my mathematical timing work had confirmed that the DOW Jones topped out on December 31st, 2013 at precisely 16,576, ushering in the new bear market leg that will take us into the 2017 cyclical bear market bottom. 

Now, most market participants believe that the decline since the start of the year is nothing more than a simple correction that is long overdue.  While I disagree we still have to wait for a technical confirmation before taking our short position to profit from the bear market leg.  Such confirmation must come from a short term bottom here, subsequent bounce and resumption of the bear move thereafter. 

Our model portfolio established at the beginning of the year has been in cash this entire time @10 Year Note, helping us avoid the decline. For our previous investments, we continue to maintain our LONG/HOLD position without adding anything new. Once the bear market confirmation arrives we will get out immediately and go short. 

If you recall, I have mentioned that the market opened up large gaps on the way down from 16,400. At this stage it is highly probable that the market will bounce back to those levels before resuming the bear market let once the bottom of this correction is set. When will that happen. Please see our Mathematical & Timing analysis below.  

Fundamental Analysis: 

As you know, my fundamental case remains fairly straight forward and clear cut. All stocks and most other markets (credit and real estate) are substantially overvalued due to massive infusion of credit by the FED over the last few years and pure speculation. I am acutely aware and as most market commentators point out, based on the P/E ratio of 18.5 and some other metrics that the market is not overpriced and is within its historic range. At lest suggesting that there is no need to worry about any sort of a decline. 

s&p ratio

However, everyone is missing the elephant in the room. The earnings for most corporations have been “juiced up” to the tenth degree by the same credit infusion. If you take the credit and those earnings out, the P/E ratio is likely to be in the 50-100 range. Making this market not only overpriced, but putting it in the “are you fucking kidding me overpriced” category. 

Please note, that is exactly what happened when the P/E ratio shot up to over 124 in May of 2009 even though the market had lost over 50% since October of 2007. When earning disappear (as they will), today’s valuations will look astronomical.   

Macroeconomic Analysis: 

It doesn’t matter where you look, we have the same cancer spreading across the globe. Massive credit expansion juiced up the FED. This week the Fed announced a further cut in QE from $75 Billion to $65 Billion due to perceived “Economic Strength”. I have argued for a long time that the FED will be unable to withdraw this support without a massive blow up one way or another. We already starting to see strain show up in emerging markets. 

With our mathematical work confirming the bear market over the next 3 years, this plays very well into our scenario. The bottom line is, our economy is driven by credit and will deflate on a large scale as soon as the credit intervention goes away (as it is now) and/or the velocity of credit slows down (as it is now). 

Technical Analysis: 

Technical picture remains murky. 

Long-Term: The trend is still up. Market action in January could be viewed as a simple correction in an ongoing bull market. 

Short-Term: The trend is down as the market structure turned bearish. Please see my timing analysis for further instructions. 

Overall, we must wait for a confirmation before taking a short position. 

Mathematical & Timing Analysis: 

There is a number of important mathematical turning points arriving over the weekend and next week. Will these points signal the end of the bear move and a reversal into an anticipated rebound? I believe so. As soon as the rebound completes we should see the market roll over the resume a bear market leg in March of this year.  

Time Targets: Coming Next Week.

Price Targets: Coming Next Week 

CONCLUSION: 

If you are out of the market as we have been, stay out. If you are still fully invested consider liquidating your positions as we go through a rebound over the next few weeks. Once the rebound plays itself out and the market confirms the next bear leg down, I would recommend going short at that time. 

Did you enjoy this article? If so, please share our blog with your friends as we try to get traction. Gratitude!!!

Book Formlead Big

Google