

Weekly Update & Summary: February 28th, 2014
The market continued its bull move with the Dow Jones being up +218 points (1.36%) and the Nasdaq being up +44 points (1.05%) for the week. Structurally, the market did very well, leaving only one gap behind….at 16,100. There are still a number of gaps going all the way down to 15,500 on the Dow, but all of them will be closed during the upcoming bear market leg.
FUNDAMENTAL & MARKET ANALYSIS:
During the week Charles Schwab Chief Investment Strategist, Liz Ann Sonders, claimed that the bull run stocks have enjoyed for the last five years is not over yet. According to her, “I think what started five years ago was the beginning of a secular bull market, not just a cyclical bull within an ongoing bear.”
This is an important claim that we must discuss. This will help me explain, once again, where we are in the cycle. If you are not familiar with the terminology….
Secular Bull Market ……. is a long term bull market. For example, what we saw between 1982-2000.
Cyclical Bull Market Within Ongoing Bear…..is a bear market rally. For instance, the move between 2002/03 bottom to 2007 top.
So, what she is saying is that the bear market that started in January of 2000 is now over and that the new long term bull market started at 2009 bottom. There is just one problem with her statement.
Liz Ann Sonders didn’t do her market homework. Since the stock market officially “opened” in May of 1790 there hasn’t been a single bear market that lasted 9 years. Not a single one if you understand the cyclical composition and market structure. Why would it be different this time? It is not.
In fact, the market oscillates in bull and bear market cycles that on average last 17-18 years. There is a reason for that, but let me illustrate instead of telling you. Let’s take a closer look
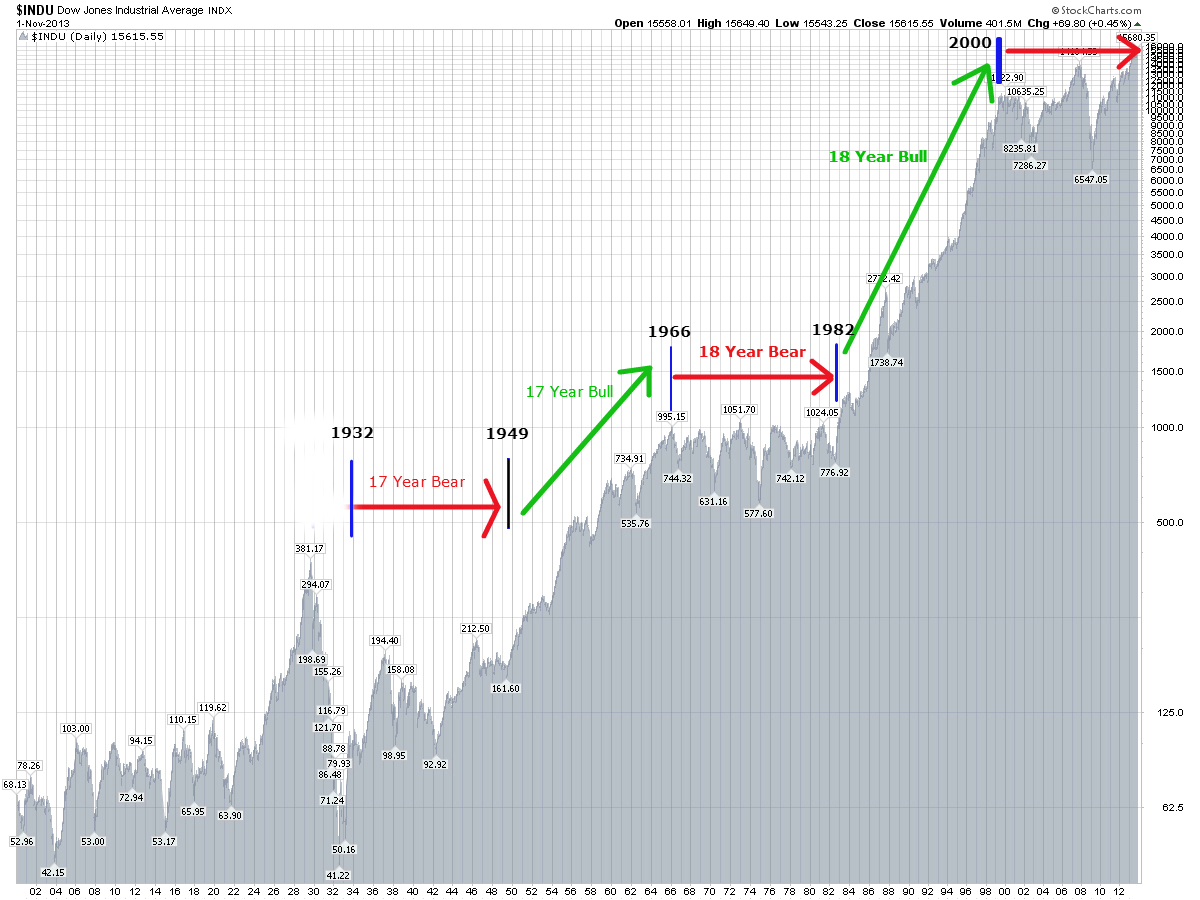
- 1897-1914 Bear Market. (17 Years).
- 1914-1932 Bull Market. (18 Years). * Please note, the last 3 years of this cycle 1929-32 we had a cycle inversion. I will talk about it in my future writings, for now, its outside the scope of our discussion.
- 1932-1949 Bear Market (17 Years).
- 1949-1966 Bull Market ( 17 Years).
- 1966-1982 Bear Market (17 Years).
- 1982-2000 Bull Market (18 Years).
- 2000-2009 Bear Market ? ….I don’t think so….
As you can clearly see, bull and bear markets alternate in 17-18 year cycles. Any notion that, somehow, this bear market was only 9 years long and we are now in a cyclical bull market is ludicrous.
This is further confirmed by my mathematical work. What we have seen between March 2009 bottom and today was a simple bear market rally, even if it did set a new high. It was a 5 year cycle (exactly the same as in 2002-2007) and it is now done. Cyclical bear markets tend to finish off with a 2-3 year down moves and that is, once again, being confirmed by my calculations.
I have stated on numerous occasions that the stock market has topped out on December 31st, 2013, ushering in the final leg of the bear market. When this bear market completes the Dow Jones will be well below it’s 2000 top of 11,800……essentially tracing out a flat move over an 17 year period of time. Exactly what a bear market should look like.
I hope this brings further awareness and understanding of where we are in this economic and market cycle. If you want more precise timing capability, please take a look at our Timing Analysis section below.
MACROECONOMIC ANALYSIS:
One word. Ukraine.
As I have mentioned in one of my posts during the week, there is absolutely no way in hell that Russia will let Ukraine go. What we are seeing today is indicative of that stand. If you are not following the story, here is what had transpired. The EU Bureaucrats and the US Government have decided that it would be a good idea to destabilize Ukraine after Ukrainian government decided to go forward with Russia instead of joining the EU or NATO. Thus far, the western governments were successful it toppling Ukrainian President and “claiming victory”.
However, here is what even a retarded CIA/NSA analyst should understand. Russia will never let Ukraine go. It will go to war over that territory if need be and that is exactly what we are seeing today. Obama coming out and “WARNING” Russia does nothing but infuriate Russia even more. Again, the US Government has no business in Ukraine. Ukraine is a split nation and when Obama talks about the “Ukrainian People who want freedom and closer ties to the EU” he talks about 25% of Ukrainian population at best. The bottom line is this, Russia will take it and no one will stop it.
Is this important? Will this impact our financial markets? While it will not have any impact on the US financial markets (outside the spectrum of our forecasts) it is an incredibly important geopolitical event. It is quite possible that when we look back, this event will be indentified as the beginning of the Cold War II between Russia and the West. With one big difference. Russia will have an incredibly strong partner on its side that it didn’t have last time…..China. This is a fascinating development that will impact us all over the next few decades.
TECHNICAL ANALYSIS:
While the overall technical picture is clearing up.
Long-Term: The trend is still up. Market action in January-February could be viewed as a simple correction in an ongoing bull market.
Intermediary-Term: Since February 5th, intermediary term picture shifted from negative to positive. Giving us a technical indication that both the intermediary term and the long term trends are up. Yet, that in itself can be misleading as per our timing analysis discussion below.
Short-Term: Short-term trend has turned bullish as well.
While all 3 trends are bullish, this might be misleading. Please read our Mathematical and Timing Analysis to see what will transpire over the next few weeks.
MATHEMATICAL & TIMING ANALYSIS:
(*** Please Note: About 75% of the information contained within this section has been deliberately removed. Particularly, exact dates and prices of the upcoming turning points. As well as trading forecasts associated with them. I deem such information to be too valuable to be released onto the general public. As such, this information is only available to my premium subscribers. If you are a premium subscriber please Click Here to log in. If you would be interested in becoming a subscriber and gaining access to the most accurate forecasting service available anywhere, a forecasting service that gives you exact turning points in both price and time, please Click Here to learn more.Subscription is through lottery only. Don’t forget, we have a risk free 14-day trial).
I continue to believe that March will be a very volatile month. We have a number of interference patterns in play, indicating a number of strong and powerful bull/bear moves. With that said, I believe Friday’s market action has cleared a lot of question marks. Primarily, XXXX.
In addition, the market closed two important gaps all the way up to 16,400 that were left there in January. I have talked about these gaps on numerous occasions, suggesting that the market must close said gaps before any meaningful bear market can start. That was done today, clearing the way for the market to XXXX
While there are a number of important turning points in March (indicating interference), there is one particular price point that works very well. As such, I propose the following turning points.
Date: XXXX
Price Target: XXXX
Explanation: XXXX
Hence, I suggest the following positioning over the next few days/weeks to minimize the risk while positioning yourself for a forecasted market action.
If You Are A Trader: XXXX
If No Position: XXXX
If Long: XXXX
If Short: XXXX
CONCLUSION:
We have a couple of existing and challenging weeks coming up. March of 2014 presents us with numerous high probability turning points. Indicating volatility, multiple interference patterns and an incredibly important long-term XXXX. Those anticipating the moves and those who can time them properly will be rewarded appropriately. Once the moves described above play out in full, the market will be set free to continue its next cyclical bear market leg.
Please Note: XXXX is available to our premium subscribers in our + Subscriber Section. It’s FREE to start.
Did you enjoy this article? If so, please share our blog with your friends as we try to get traction. Gratitude!!!

What You Ought To Know About This Secular Bear Market. Plus, Weekly Market Update. Google