Weekly Update & Summary: June 28th, 2014
A mixed week with the Dow Jones down 95 points (-0.56%) and the Nasdaq up 29 points (+0.68%). The Dow left behind a small up gap on Thursday, June 26th at 16,867. It is likely to be closed over the next few trading days.
However, we continue to have a number of large down gaps, the one on May 27th, two large gaps on May 21st/23rd and two large gaps on April 14th/16th. Indicating an eventual correction. Further, there are a number of smaller gaps left behind, leading all the way down to February 5th low. We continue to believe that the Dow will close such gaps when the next bear leg develops at below mentioned time frames (please see mathematical analysis & timing section below).
WEEKLY REVIEW:
The Dow Is Going To 44,000. Minus 34,000.
I was waiting for this. Nothing screams out “Market Top” more than some perma bull claiming that the market is going to hit 44,000. Bull markets don’t die of old age, why Dow 44,000 is coming
“We’ve been on record since the 4th quarter of 2008 saying that U.S. stocks were entering a 15 to 20 year bull secular bull market. While people have come around to being more bullish I don’t think people believe we have another 10 years left.”
And that’s the biggest problem with these idiotic projections and people claiming that 2009 bottom was the end of the bear market and the beginning of the next secular 20 year bull market. I guess it’s alright to have a 20 year secular bull market, yet it is impossible to have a 20 year bear market
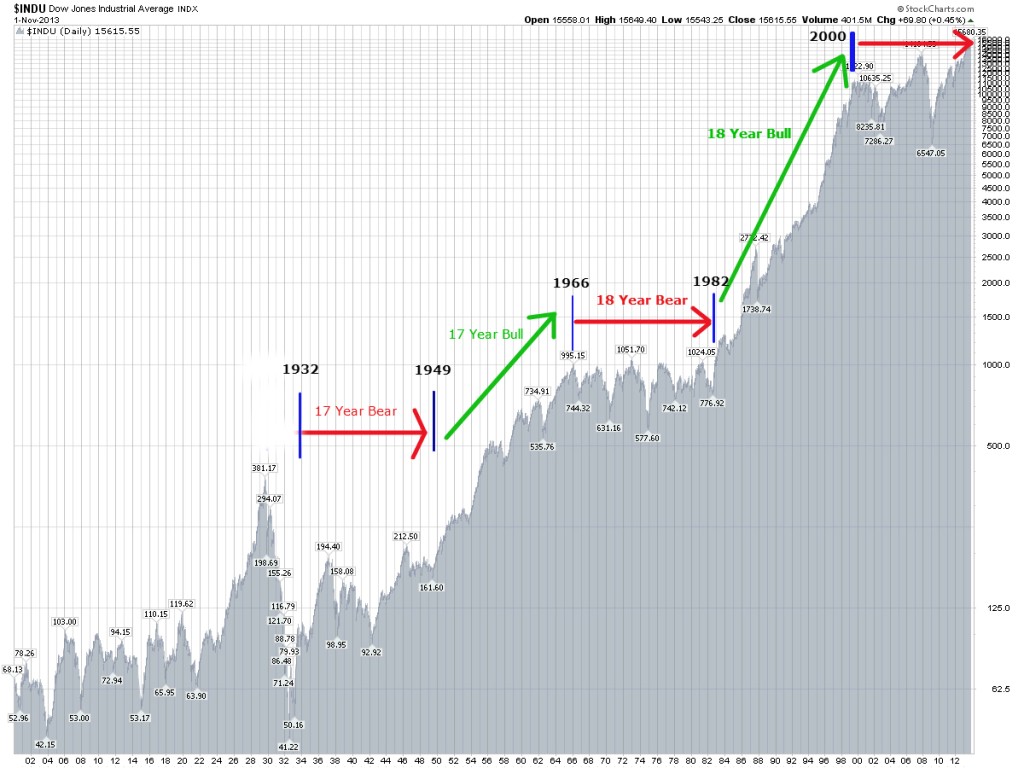
I have some bad news for them. If you study the market going all the way back to the first day of trading (May 22nd, 1790), you would soon realize that Bull/Bear markets alternate in almost perfect 17/18 year cycles. Meaning, the 2009 bottom was a mid cycle bottom similar to 1974, 1937, 1908, etc….. and not the termination point of the bear market that initiated on January 14th, 2000. The final 2014-2017 stage of this bear market will prove me right without a shadow of the doubt. Get ready.
Shocking: American Household Net Worth Collapses

American middle class continues to vanish at astonishing speed. At least according to the new study published by Russell Sage foundation For most families, wealth has vanishe
The study, which measures the average wealth of U.S. households by income level, reveals a startling decline in wealth nationwide. The median household in 2013 had a net worth of just $56,335 — 43% lower than the median wealth level right before the recession began in 2007, and 36% lower than a decade ago. “There are very few signs of significant recovery from the losses in wealth suffered by American families during the Great Recession,” the study concludes.
I have covered the subject matter in my previous posts titled Guillotine Sales About To Surge. Make no mistake, the American middle class, and not the rich, is the driving force behind America’s success. I continue to believe that by decimating the middle class the US Government has undermined the very foundation of America’s future.
In other words, what the FED did over the last 20 years is nothing short of criminal.By concentrating of bubble blowing, asset appreciation and capital misallocation, the US Government and the FED have, for the most part, benefited only the rich. The problem is, no economy can function like this over an extended period of time. Rich or not, an economy with no middle class eventually collapses and becomes a banana republic. Unfortunately, we are approaching that threshold at breathtaking speed
What’s Driving The Stock Market Higher?

As you very well know, many have been scratching their heads while trying to figure out what is pushing this highly speculative stock market ever higher. I have already illustrated a number of times that institutions are net sellers and while retail investors are buyers, the overall amount is not nearly enough to push the stock market to all time highs.
So, who is buying?
In-short, corporate buybacks are the most likely culprit in today’s stocks market rally. The rich get richer as stock buybacks surge.
Repurchases and buybacks soared nearly 60 percent in the first quarter, putting a floor under a market that struggled amid a brutal winter and an economy that contracted at least 1 percent. Companies have used bargain-basement interest rates to borrow money for stock purchases. In all, corporations increased buybacks by 59 percent to $159.3 billion, according to S&P Dow Jones Indices. That’s up strongly from the $100 billion for the same period in 2013 and a bit below the $172 billion high set in the third quarter of 2007, just before the financial crisis and market crash that sent indexes plunging 60 percent.
Nothing new here as corporations continue to act as Individual/Retail investors.AKA…..Stupid Money. What’s worst is that they are borrowing money to speculate in their own stocks on margin. Driving up stock bonuses and corporate payouts for their management teams. Yet, we all know how this story ends. Just take a look at 2007-2009.
GEOPOLITICAL & MACROECONOMIC ANALYSIS:
With the week ending where it began, most of the issues discussed in last week’s update remain intact. Below is a re-print of last week’s update.
This was not a good week in terms of geopolitics. With so many conflicts happening simultaneously it certainly feels as if the world is going to hell in a hand basket. Let’s take a quick look at the three of the most important ones and see if they can impact our financial markets.
- Ukraine/Russia/NATO/USA/EU: As I have mentioned in last week’s update this situation continues to die off. While there is cease fire and with Putin suggesting that he will not invade, this issue might be on a verge of completion. With that said and as with any conflict, a quick re-escalation is always a possibility. Unfortunately, the US relationship with Russia will continue to deteriorate for as long as this administration remains in place. If the conflict dies off, there shouldn’t be any impact on our financial markets.
- China/USA/NATO/Philippines/Vietnam/Taiwan/Japan: China has already said, in no uncertain terms and a number of times, that it wants the US military presence out of Asia. China will continue to flex its military muscles to try and control the entire region. While there have been a number of incidents, thus far they have not caused any major problems. Yet, make no mistake, the pressure is building and this powder keg will explode. Sooner or later. No impact on our financial markets as of today.
- Iraq/Syria/USA: In a stunning turn of events, various factions of Islamic militants, crazies, al-queda, etc….. have nearly completed their takeover of Iraq in a matter of day. Given the circumstances and reports coming out of the Iraq, it is probable that Baghdad might fall to these militant groups within a matter of weeks. Giving them control of the entire country. No amount of “strategic bombing” by the US will prevent that from happening. Only an invasion can and no one is willing to do that.
This is the most important issue now….. on two fronts. First, if successful, these Islamic militants will be able to use Iraq and parts of Syria as lawless land where anything and everything goes. Further destabilizing the region and having the ability to train as many terrorists as their little hearts desires. This will come back to haunt us. Second, OIL & OIL money. They might end up as the wealthiest terrorist organization ever created, destabilizing the oil markets in the process. We must watch this situation very carefully and anticipate that it MIGHT have an adverse impact on our financial markets.
TECHNICAL ANALYSIS FOR THE DOW JONES:
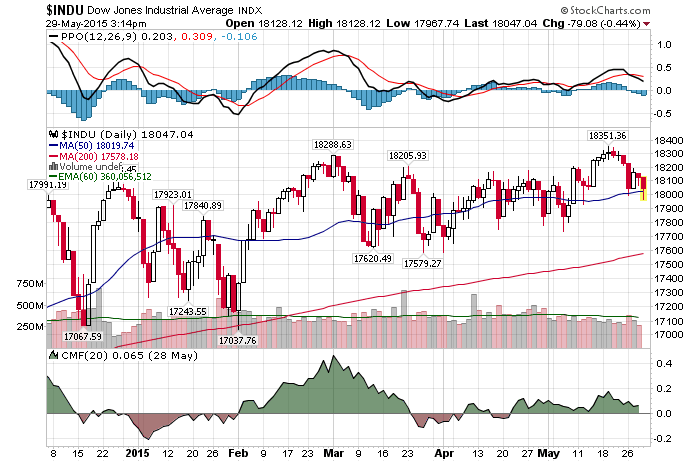
Long-Term: The trend is still up. Market action in January-February could be viewed as a simple correction in an ongoing bull market. Same applies to the market action over the last few months. Yet, that in itself can be misleading as per our timing analysis discussion below.
Intermediary-Term: Since February 5th, intermediary term picture shifted from negative to positive. Giving us a technical indication that both the intermediary term and the long term trends are up. Yet, that in itself can be misleading as per our timing analysis discussion below.
Short-Term: Short-term trend remains positive for the time being. The Dow would have to break below 16,700 for the short-term trend to shift from positive to negative.
Again, even though all 3 trends are bullish for the time being, that might be misleading. Please read our Mathematical and Timing Analysis to see what will transpire over the next few weeks.
MATHEMATICAL & TIMING ANALYSIS:
It’s going to be a long one.
First, a re-cap. Particularly for our new subscribers. Over the last few months we have maintained that the DOW will…..
(*** Please Note: This time around about 90% of the information contained within this section has been deliberately removed as it contain too much technical information. Particularly, exact dates and prices of the upcoming turning points. As well as trading forecasts associated with them. I deem such information to be too valuable to be released onto the general public. As such, this information is only available to my premium subscribers. If you are a premium subscriber please Click Here to log in. If you would be interested in becoming a subscriber and gaining access to the most accurate forecasting service available anywhere, a forecasting service that gives you exact turning points in both price and time, please Click Here to learn more.Don’t forget, we have a risk free 14-day trial).
In conclusion, xxxx
Longer-Term Overview:
The next turning point is located at……
Date: XXXX
Price: XXXX
TRADING:
I am now fully committed to the XXXX side of the market with 11 individual positions taken at the prices outlined below. A lot of them have done incredibly well thus far and I hope you were able to benefit as well. I will be updating you of any changes or anticipated changes before they take place.
Remember, you should have an exact strategy and entry/exit points based on the forecast above.
The list below is for your reference point. It entails my investment strategy for my own investment purposes. While you are free to follow me, please do so at your own risk. Do not take this as a trading advice. Please note, all of the positions below have been triggered.
| Stock |
Entry Point ($) |
Action Taken |
Stop Loss @ |
| xxxx |
xxxx |
xxxx |
91 |
| xxxx |
xxxx |
xxxx |
1250 |
| xxxx |
110 |
xxxx |
121-123 |
| xxxx |
74 |
xxxx |
80 |
| xxxx |
xxxx |
xxxx |
260 |
| xxxx |
xxxx |
xxxx |
460 |
| xxxx |
35 |
xxxx |
39 |
| xxxx |
65 |
xxxx |
70 |
| xxxx |
120 |
xxxx |
120-130 |
| xxxx |
100 |
xxxx |
108-112 |
| xxxx |
112 |
xxxx |
120 |
Otherwise, I suggest the following positioning over the next few days/weeks to minimize the risk while positioning yourself for a forecasted market action. (This is continuation of our previous positioning).
If You Are A Trader: XXXX
If No Position: XXXX
If Long: XXXX
If Short: XXXX
CONCLUSION:
An incredibly important week is coming up. We are now looking for our forecasts above to be confirmed over the next few trading days/weeks. I have also described what to anticipate over the next few months and exactly what you should do now. With increased volatility, multiple interference patterns and an incredibly important long-term turning points coming up over the next few months we must be very careful and risk averse here. Those anticipating the moves and those who can time them properly will be rewarded appropriately.
Please Note: XXXX is available to our premium subscribers in our + Subscriber Section. It’s FREE to start.
Did you enjoy this article? If so, please share our blog with your friends as we try to get traction. Gratitude!!!

Weekly Stock Market Update & Forecast. June 28th, 2014. InvestWithAlex.com Google


 7/2/2015 – A slight down day with the Dow Jones down 28 points (-0.16%) and the Nasdaq down 4 points (-0.08%).
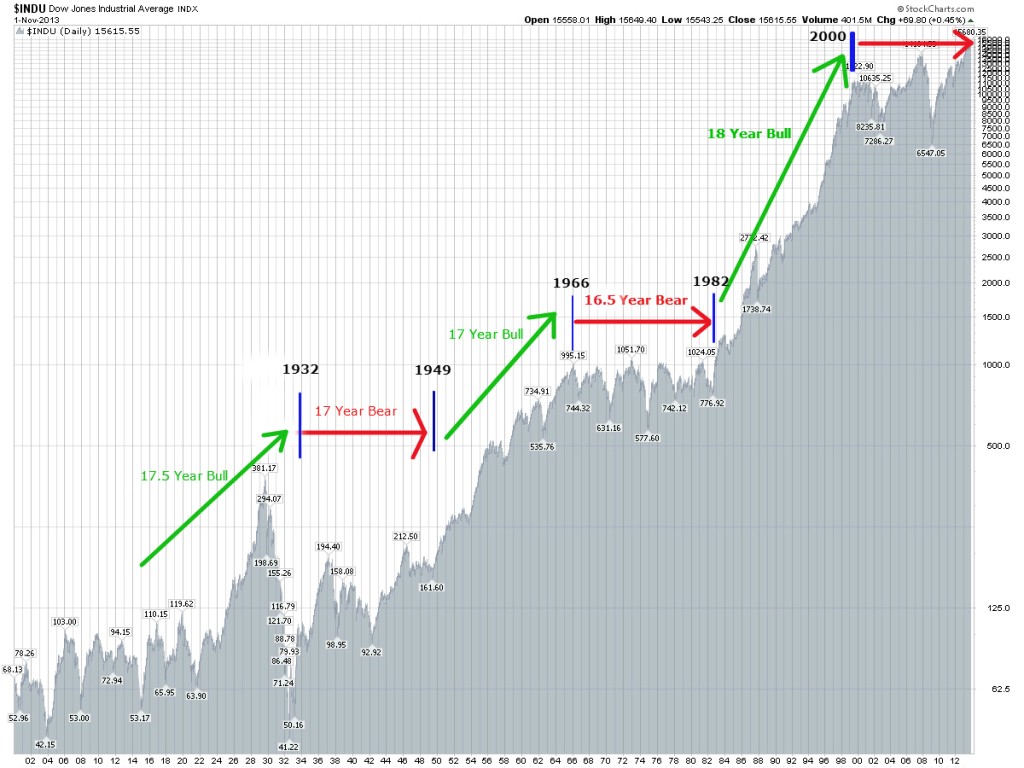

 6/5/2015 – A mixed day with the Dow Jones down 56 points (-0.31%) and the Nasdaq up 9 points (+0.18%).