What You Should Expect From The FED Tomorrow

Daily Chart April 28 2015

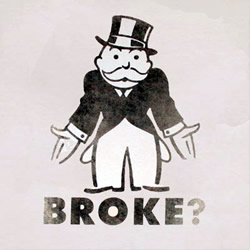
4/28/2015- A mixed day with the Dow Jones up 72 points (+0.40%) and the Nasdaq down 5 points (-0.10%). 

So, does it matter what the FED says tomorrow? Not really and not if you value your money. Here is why.

As far as I am concerned there is only one thing, and one thing only, that is holding this market together. The FED and investors blind faith in the fact that the FED will be able to stop any and all market corrections. Either through QE, interest rates or by simply making statements to the press. So much so that every single bottom over the last couple of months can be attributed to the FED talk.  El-Erian tends to agree. Danger, Danger — ‘Market Is in Love With Central Bank Trade’

Here are the 3 reasons as to why this “herd mentality trade” will blow up in investors faces. And much sooner than most people believe. 

  1. The Fed is a Reactionary Force: If we study the past, the FED has always been late to react to any and all market developments. For instance, Bernanke was talking about the accelerating US Economy as late as Q1 of 2008. They have no clue and there is no reason to believe that this time will be any different.
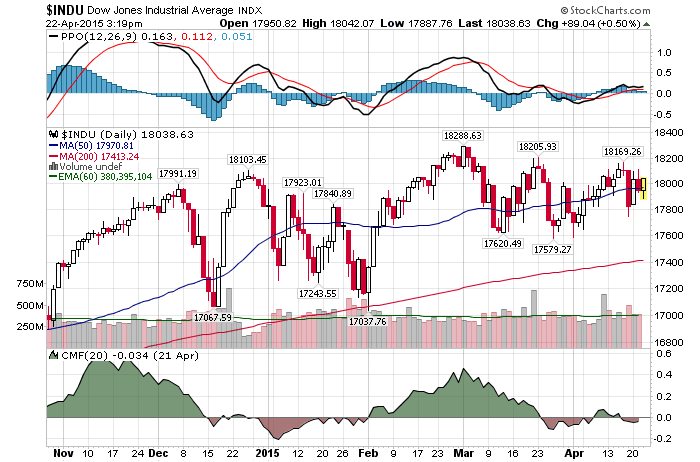
  2. The Market Will Decline Anyway: My mathematical and timing work makes it very clear. Over the short-term the market is independent of all fundamental inputs. That is to say, the market will top out on a certain date in 2015 and initiate its decline. No matter what the FED does or say. That day is approaching fast.
  3. Investors Will Lose Confidence In The FED: This is unavoidable. As soon as the FED is unable to backstop the next decline, most investors will lose confidence in a millisecond.  That in itself will accelerate the decline

The main take away from the points above is as follows. The FED trade will be in place until it is not.  The problems is, by the time most investors realize this fact, it will already be too late. By the time the analysis above becomes a reality, the stock market will already be down 10-25%.

This conclusion is further supported by my mathematical and timing work. It clearly shows a severe bear market between 2015-2017. In fact, when it starts it will very quickly retrace most of the gains accrued over the last few years.  If you would be interested in learning when the bear market of 2015-2017 will start (to the day) and its internal composition, please CLICK HERE.

(***Please Note: A bear market might have started already, I am simply not disclosing this information. Due to my obligations to my Subscribers I am unable to provide you with more exact forecasts. In fact, I am being “Wishy Washy” at best with my FREE daily updates here. If you would be interested in exact forecasts, dates, times and precise daily coverage, please Click Here)Daily Stock Market Update. April 28th, 2015  InvestWithAlex.com

Did you enjoy this article? If so, please share our blog with your friends as we try to get traction. Gratitude!!!

What You Should Expect From The FED Tomorrow Google

Shocking: Why Even Investment Legends Make Mistakes At Market Tops

soros and duckenmiller
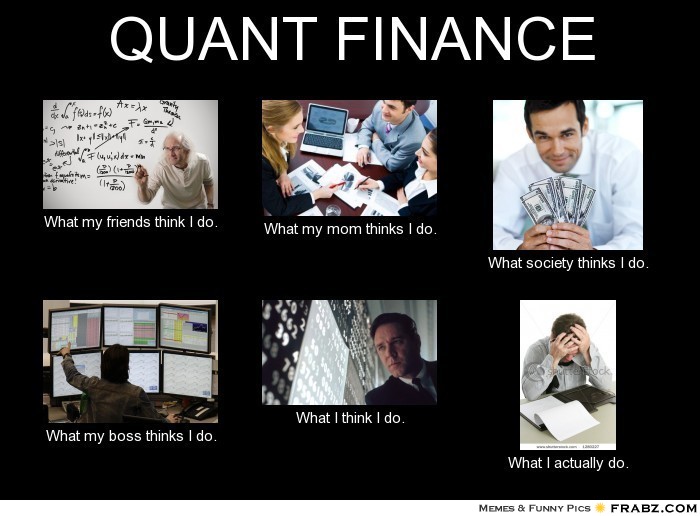
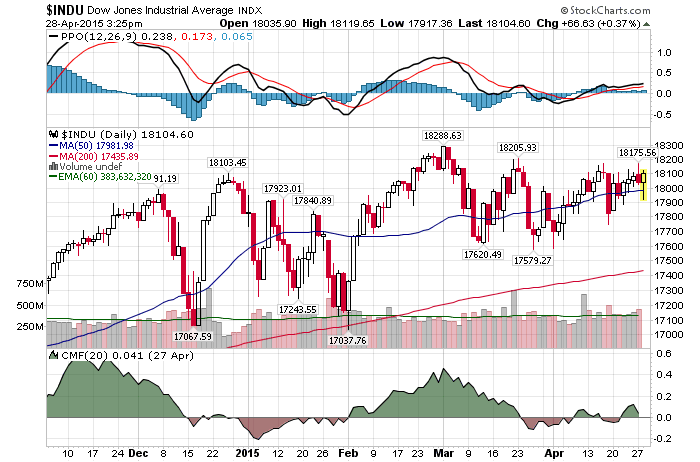
This is rather a sobering look at how most investors think and behave at market tops. Forget about your mom and pop retail investors, we are talking about the top 0.5% of professionals out there. 

Last month, Stan Druckenmiller recounted his own experience with capitulation and performance chasing when he was the lead portfolio manager for George Soros and the Quantum Fund:

“I’ll never forget it. January of 2000 I go into Soros’ office and I say I’m selling all the tech stocks, selling everything. This is crazy… Just kind of as I explained earlier, we’re going to step aside, wait for the next fat pitch. I didn’t fire the two gun slingers. They didn’t have enough money to really hurt the fund, but they started making 3 percent a day, and I’m out. It’s driving me nuts. I mean, their little account is like up 50% on the year. I think Quantum was up seven. It’s just sitting there.

So like around March I could feel it coming. I just – I had to play. I couldn’t help myself. And three times during the same week I pick up a – don’t do it. Don’t do it. Anyway, I pick up the phone finally. I think I missed the top by an hour. I bought $6 billion worth of tech stocks, and in six weeks I had left Soros and I had lost $3 billion in that one play. You ask me what I learned. I didn’t learn anything. I already knew I wasn’t supposed to do that. I was just an emotional basket case and couldn’t help myself. So maybe I learned not to do it again, but I already knew that.”

And while most investors believe it is impossible to predict the market top, I tend to disagree. When the TIME is right, I intend to nail it to the day and within 100 point accuracy.

Z31

Shocking: Why Even Investment Legends Make Mistakes At Market Tops Google

Is Warren Buffett Shorting Everything?

PE Ratio

The chart above is as clear as night and day. Based on the adjusted P/E ratio, the stock market is more expensive today than it was at 1907, 1937, 1966 and 1987 tops. Just as expensive as it was at 1929 and 2007 tops. Only 2000 top stands above (due to the tech bubble and no earnings – it can be discounted away).

Now that I think about it, I am a little confused. I haven’t heard from a single value investor, or so called value investors, that the stock market is overvalued. David Stockman tends to agree.

David Stockman: ‘There Are No Markets, Just a Raging Casino’

“There are no markets left in any meaningful sense of the word, just a raging casino infected with the madness of the crowds and the central bank pied pipers who mesmerize them,” he writes on his blog.

Well said and I couldn’t agree more. Benjamin Graham must me spinning in his grave right about now. The only remaining question is, what is Warren Buffett and his disciples are up to? If they are to follow traditional Graham & Dodd valuation metrics, they should be completely out of the market by now. If not 100% short.

And while Warren Buffett’s corporate structure makes that impossible, the rest of the so called value investors should start asking this very same question.

z33

Is Warren Buffett Shorting Everything? Google

Two Charts That Will Send Chills Down Your Spine

While major stock market indices continue on with their slow “melt up” on low volume, the two charts below should send chills down your spine.

And not only that. The S&P 500 has a serious revenue problem While quite a few corporates were able to push their accounting to the limit to beat the bottom line this quarter, they might not be able to do it next time around.

Doesn’t matter!!!

Perhaps, but lets review.  Low volume melt up, macro data is collapsing and getting worse,  earnings are expected to decline, fund outflows, anticipated interest rate increases, buybacks, accounting gimmicks, etc…. And I am expected to believe the stock market is about to surge higher…..Just as I was expected to believe that Pets.com was the next Microsoft?

It will be fun watching the stock market catch up to the down slopping lines below.

equity outflows

Macrodata

z32

Two Charts That Will Send Chills Down Your Spine  Google

Two Hedge Fund Managers Discuss The Stock Market, Currencies, Commodities & Investment Ideas – Weekly Podcast

April 25th, 2015: We have a great show for you this week. Hedge fund managers Matthew Demeter and Alex Dvorkin discuss the following topics….

  • What the stock market is doing and what we expect to happen over the next few weeks.
  • COT Report and what the big guys are buying. Listen to make sure you are not on the wrong side of the trade.
  • Deflation, employment numbers, gold, geopolitical and macroeconomic issues.
  • A multitude of great investment ideas and various tops/bottoms that can make you a ton of money.
  • And of course, much…..much more.

Don’t miss this one and join us again next Saturday. 

Listen to the podcast by clicking on the player above. If you prefer iTunes, please Click Here

Z30

Two Hedge Fund Managers Discuss The Stock Market, Currencies, Commodities & Investment Ideas – Weekly Podcast Google

Stock Market Complacency Hits An All Time High

Gone are the days when the stock market actually oscillated. Thanks to the FED and their little liquidity party, we have been in a narrow upward slopping channel for over 6 years now. Is the party about to end?

Well, as the video above pertains, very few people think so. VIX/VXX are close to their respective all time lows, there is a lot of complacency, most believe that we are in a secular bull market that has at least 10 years left, etc….. At the same time Put Option Cost At An All Time High, Crash Coming?

But don’t despair just yet.

According to the same video, get this, the party is not even close to being over. Why? Because we haven’t seen the speculative blow off typically associated with market tops. That is to say, most money managers believe it still OK to speculate away. Preferably on margin. I wish them luck.

Z30

Stock Market Complacency Hits An All Time High  Google

Coming Soon: Trade Of The Decade?

Daily Chart April 22 2015

4/22/2015 – A positive day with the Dow Jones up 88 points (+0.49%) and the Nasdaq up 21 points (+0.42%) 

In last night’s daily update I have suggested that today’s short setup is about as ideal as the long setup was at 2009 bottom. Hence, short sellers should be thankful for such high prices.

Bill Gross introduces the same idea, but in the bond market Bill Gross’s ‘Short of a Lifetime’ Would Mean Armageddon (watch the video, it’s worth your time).

“It’s Just A Matter Of Time”

While the conversation in the link above has to do with zero yielding German bonds, the same line of thinking should apply to the US Treasury market. At some point “follow the FED” trade will fail and the yields will surge. And while I don’t think we are there yet, it is just a matter of time. As a result, my forecast remains, 10-Year Treasury note will see a double bottom at 1.4-1.5% over the next two years before this 30 year bull run in yields is over.

When it comes to the stock market, “short equity” setup we are facing today is about as ideal as it was at 2000 and 2007 tops. Very limited upside or risk (if any) and massive downside. In other words, long-term investors should heed the lessons of two previous market tops. And instead of trying to figure out how many more years this secular bull market has left (hint: we are still in a secular bear market that started in 2000), they should seriously consider shifting their portfolios to the short side or cash.

This conclusion is further supported by my mathematical and timing work. It clearly shows a severe bear market between 2015-2017. In fact, when it starts it will very quickly retrace most of the gains accrued over the last few years.  If you would be interested in learning when the bear market of 2015-2017 will start (to the day) and its internal composition, please CLICK HERE.

(***Please Note: A bear market might have started already, I am simply not disclosing this information. Due to my obligations to my Subscribers I am unable to provide you with more exact forecasts. In fact, I am being “Wishy Washy” at best with my FREE daily updates here. If you would be interested in exact forecasts, dates, times and precise daily coverage, please Click Here). Daily Stock Market Update. April 22nd, 2015  InvestWithAlex.com

Did you enjoy this article? If so, please share our blog with your friends as we try to get traction. Gratitude!!!

Coming Soon: Trade Of The Decade  Google

How Broke Is The USA? This Will Shock You

broke

Boston University economist Laurence Kotlikoff did not hold back in his Senate Budget Committee testimony, “The first point I want to get across is that our nation is broke. Our nation is broke, and it’s not broke in 75 years or 50 years or 25 years or 10 years. It’s broke today.” He goes on to point out…

  • Indeed, it may well be in worse fiscal shape than any developed country, including Greece
  • This declaration of national insolvency will, no doubt, shock those of you who use the officially reported federal debt as the measuring stick for what our country owes
  • We have a $210 trillion fiscal gap at this point,” Kotlikoff told the senators, which amounts to 211 percent of the U.S.’ $18.2 trillion GDP, making it higher than Greece’s 175 percent debt-to-GDP ratio
  • 16 times larger than official U.S. debt, which indicates precisely how useless official debt is for understanding our nation’s true fiscal position
  • Stated differently, the overall federal government is 58 percent underfinanced.

And so on and so forth. You get the picture. The US will never be able to repay 25% of its obligations, let alone all of it. This leads to a few possible outcomes. An outright default, war and/or currency debasement/hyperinflation.  I wonder which option the fools in our government will choose.

Z31

How Broke Is The USA? This Will Shock You Google

Why Short Sellers Should Be Thanking GOD

Daily Chart April 21A 2015

4/21/2015 – A mixed day with the Dow Jones down 85 points (-0.47%) and the Nasdaq up 19 points (+0.39%)

Short sellers, repeat after me….

  • An opportunity to short Netflix (NFLX) at $570? Thank you Jesus (or whoever you pray to).
  • An opportunity to short Biotech (IBB) at $364?  Praise the Lord.
  • The Nasdaq is at 5,000…… Hallelujah.

On a more serious note, once in the while the stock market does something so utterly stupid, it takes your breath away.  What am I talking about? Today’s divergence between fundamental/macro data and the market’s bubble valuation levels. I wrote about it earlier Why The FED Has No Clue. Yet, despite this apparent ideal short trade setup, it’s not as easy as it sounds.

For short-sellers in U.S. stocks, the agony just piles on

“How are you supposed to actively short stocks in this environment? It has been impossible,” Seattle-based Fleckenstein told Reuters.

His frustration is shared by others dedicated to betting on declines, if not for the broader market then for individual stocks that look overvalued. Outside of the hard-hit energy industry, most sectors have performed well over the last several months, and dedicated short funds have been stung.

The biggest take away from the article above is not that short sellers have been unable to make money, but rather, the fact even the best researched and most successful short sellers are afraid to enter this market on the short side.

Isn’t that bullish? 

On the contrary. That suggests three things. First, everyone is already in. Just as they were at 2000 and 2007 tops. Second, the market has been distributing for close to 9 months. Finally, any upcoming bear leg is likely to be fast/violent. In other words, today’s short sellers should be grateful for the many amazing money making opportunities the market offers.

This conclusion is further supported by my mathematical and timing work. It clearly shows a severe bear market between 2015-2017. In fact, when it starts it will very quickly retrace most of the gains accrued over the last few years.  If you would be interested in learning when the bear market of 2015-2017 will start (to the day) and its internal composition, please CLICK HERE.

(***Please Note: A bear market might have started already, I am simply not disclosing this information. Due to my obligations to my Subscribers I am unable to provide you with more exact forecasts. In fact, I am being “Wishy Washy” at best with my FREE daily updates here. If you would be interested in exact forecasts, dates, times and precise daily coverage, please Click Here). Daily Stock Market Update. April 21st, 2015  InvestWithAlex.com

Did you enjoy this article? If so, please share our blog with your friends as we try to get traction. Gratitude!!!

Why Short Sellers Should Be Thanking GOD Google