

Continuation of Part 1.
Let me show you what I mean.
The Right Way:
SQRT (6838^2+7510^2)=10,156 (3-DV)
As you can see, in this case price variable energy level matches the time energy level. In simple terms, they match each other, yielding a highly relevant 3-DV in the process.
The Wrong Way: (using daily time variable)
SQRT(6,838^2 +1,155^2) = 6,935 (3-DV)
In this case the price side of the equation overwhelms the time part of the equation. Depicting price and time as not squared. The end product is the 3-DV that is almost identical to the price move itself. Yielding a 3-DV value that is not applicable for further 3-Dimensional analysis.
The bottom line is, to perform viable 3-DV calculations we have to square the chart or be in the same range of variance. It is also important to note that at times the market (or individual stocks) will exhibit violent up or down moves, rendering squaring of the chart impossible. In such a case and as a rule of thumb, use the prior measurement TIME variable. For example, if the price moved up 1,000 points in 20 trading hours, continue to use trading hour variable if you have used this variable in the time frame directly preceding this sharp/powerful move.
How To Predict Future Moves By Using Existing 3-DV
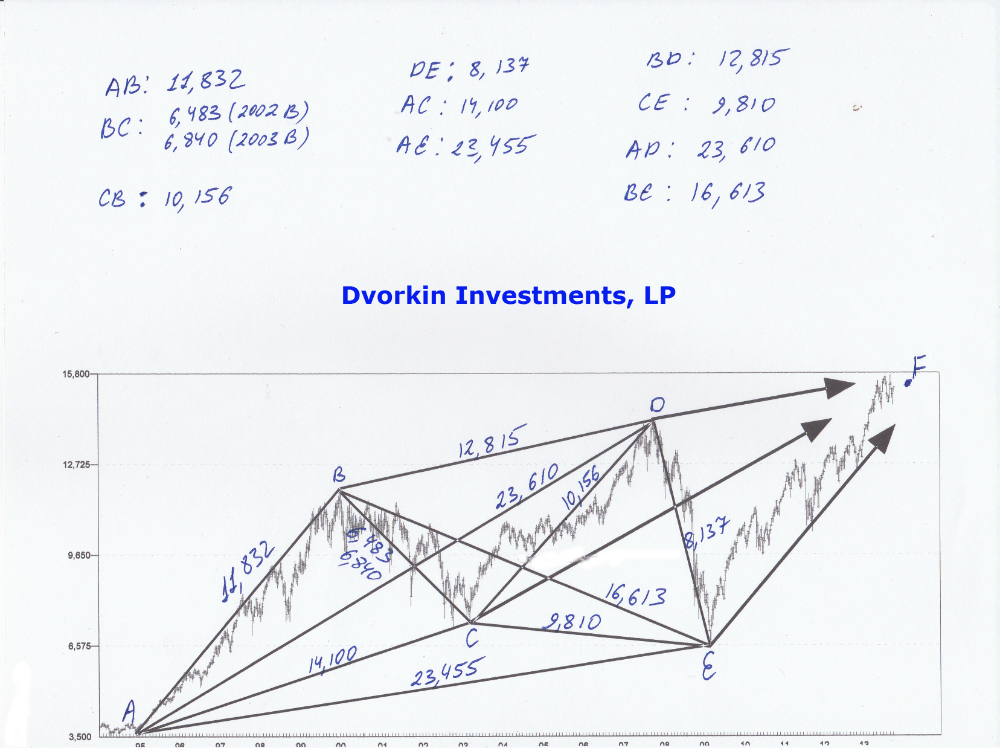
Once again, if we know the 3-DV of any move we can predict the next move with great accuracy. It will either be identical to or a derivative of the move preceding it. For example, looking at the chart above, if we know that AC is 14,100 we can very well forecast that CE will be equal to 9,810. Let’s take a closer look and perform a complete 3-DV analysis of the chart above.
At first glance, there isn’t that much synchronicity of the 3-DV calculated on the chart above. Other than the matching two 23,610 and 23,455 values, the rest of the values do not warrant any sort of uniformity. The question is why?
If you remember, I have mentioned earlier that as the stock market moves through 3-Dimensional space it continues to trace out mathematical points of force. Those point of force represent market turning points, but what are they really? Without going into too much detail these points represent lattice structures moving through 3-Dimensional space. We know from Chemistry that every element (or combination of elements) will have its own lattice structure. Same thing with the stock market and individual stocks. Each individual stock or the overall stock market will have its own lattice structure or points of force associated with them. As the market moves it simply traces out these 3-Dimensional points on the 2-Dimensional stock market chart.
To Be Continued…..
Did you enjoy this article? If so, please share our blog with your friends as we try to get traction. Gratitude!!!