
……continuation
Second, along the same lines, I want you think of a simple pine tree seed. Before that seed is put into the ground and the tree begins to grow, that seed contains all available information about the tree. The seed is already pre-programmed with what that tree will look like. How tall, how many branches, their direction, their variation, etc… everything. No doubt, the environmental factors will have an impact, but such factors are typically within a certain range of variance. Should we have the technology, we should be able to know exactly what the tree will look like just by looking at the seed. Now the scientists can even take seeds that are tens of thousands of years old and set them on a proper growth trajectory. Amazing.
Back to the stock market. We have to begin thinking about the stock market not as a simple chart of price moving over time(2-dimensional representation), but as a complex natural system. If you look at and study nature, nothing in nature is two dimensional. Our perception could be two dimensional, but the nature itself and everything that exists in nature is 3-dimensional. Everything from galaxies to the smallest particles are 3 dimensional. With that said, is it possible that the stock market is not a simple 2 dimensional system, but a more complex 3 or even a 4 dimensional system?
The answer is YES.
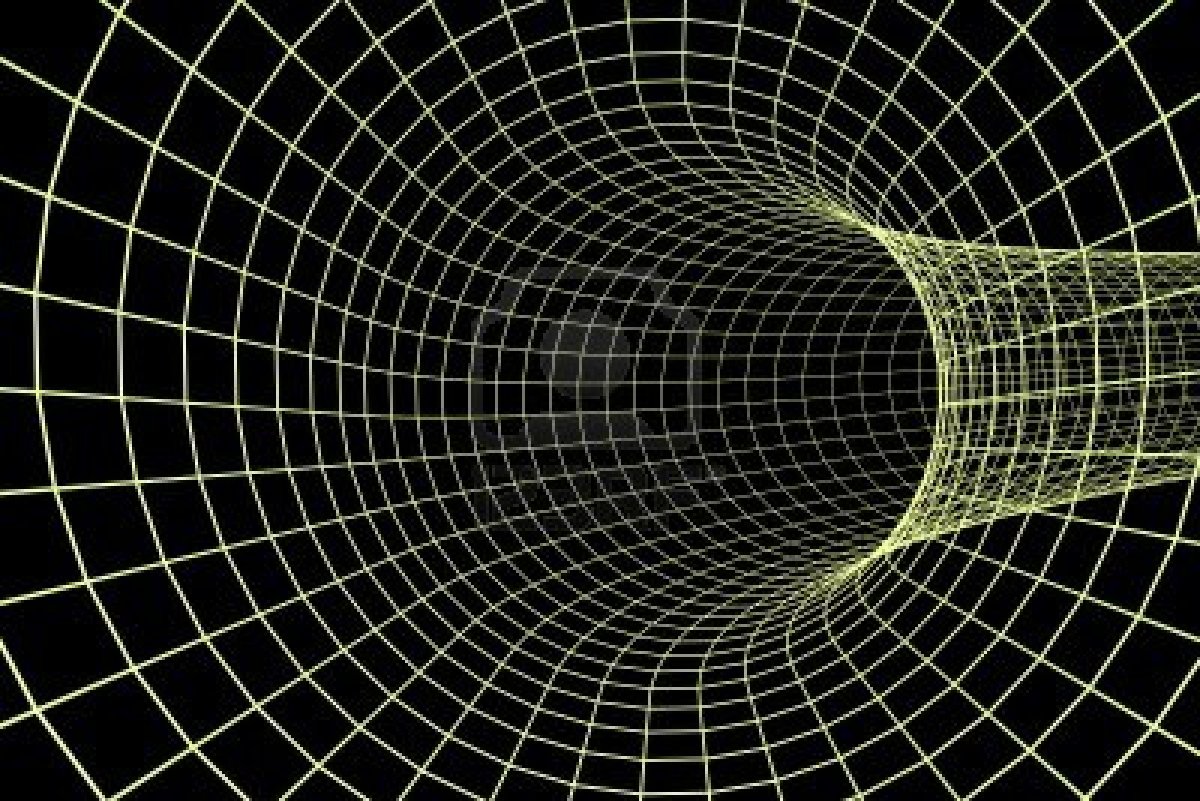
With proper understanding now in place we can start looking at the stock market in a completely different way. The stock market is not a simple 2-dimensional structure (up and down over time) but a much more complex 3-dimensional system. In addition to moving up/down and sideways, it also moves in volume of space. While it is a little bit difficult to understand at first, please allow me to illustrate. I want you to take a look at the 3-dimensional tunnel above.
Imagine for a second that you are standing at the entrance and looking into the tunnel. Further, imagine that there is a snake in the tunnel that is moving away from you in a screw like fashion while hugging the wall of the tunnel. Got that picture in your mind? Great. That is a good representation of how the stock market truly works. Now, if you are to walk to the outside of the tunnel and stand at the half way point (preferably at a good distance from the tunnel) you will only see up and down movements of the snake as it move along the wall in a screw like fashion throughout the length of the tunnel (from left to right). And indeed, that is exactly what we see on a typical 2-dimensional stock market chart.
Simply put, when we look at any existing stock chart, we see the shadow of the move and not the move itself. In reality, the market moves up/down, over time and in 3-dimensional volume of space (not to be mistaken with transactional volume). Once we understand that the stock market is a 3-dimensional phenomena we can begin to apply all scientific and mathematical rules that could be found/applied in nature. Just as with the human being and the tree seed examples above, the stock market has its own “Genetic/DNA Code” and sequence and once that code/sequence is understood exact forecasts could be made.
Here is the best part. Once we start seeing the market that way we can begin analyzing and measuring the market in a completely different way. Instead of using technical analysis, trend lines, etc… it gives us the ability to bring in exact scientific and mathematical models into the analysis part of the equation. Where typical stock market forecasts are inaccurate at best , this mathematical modeling allows us to bring in precision that was unavailable before. Simply put, it allows us to predict the stock market with astonishing accuracy.
So, how do we measure the stock market in 3-dimensional space? To be continued….
It is now your time to become a Superhuman. To live the life full of love, happiness, joy, bliss, ecstasy, content and success.
The Secret Behind How The Stock Market Works (Part 3)