The Secret 5 Year Stock Market Cycle and What It Is Predicting For 2014

Dow Jones Long Term Chart 2

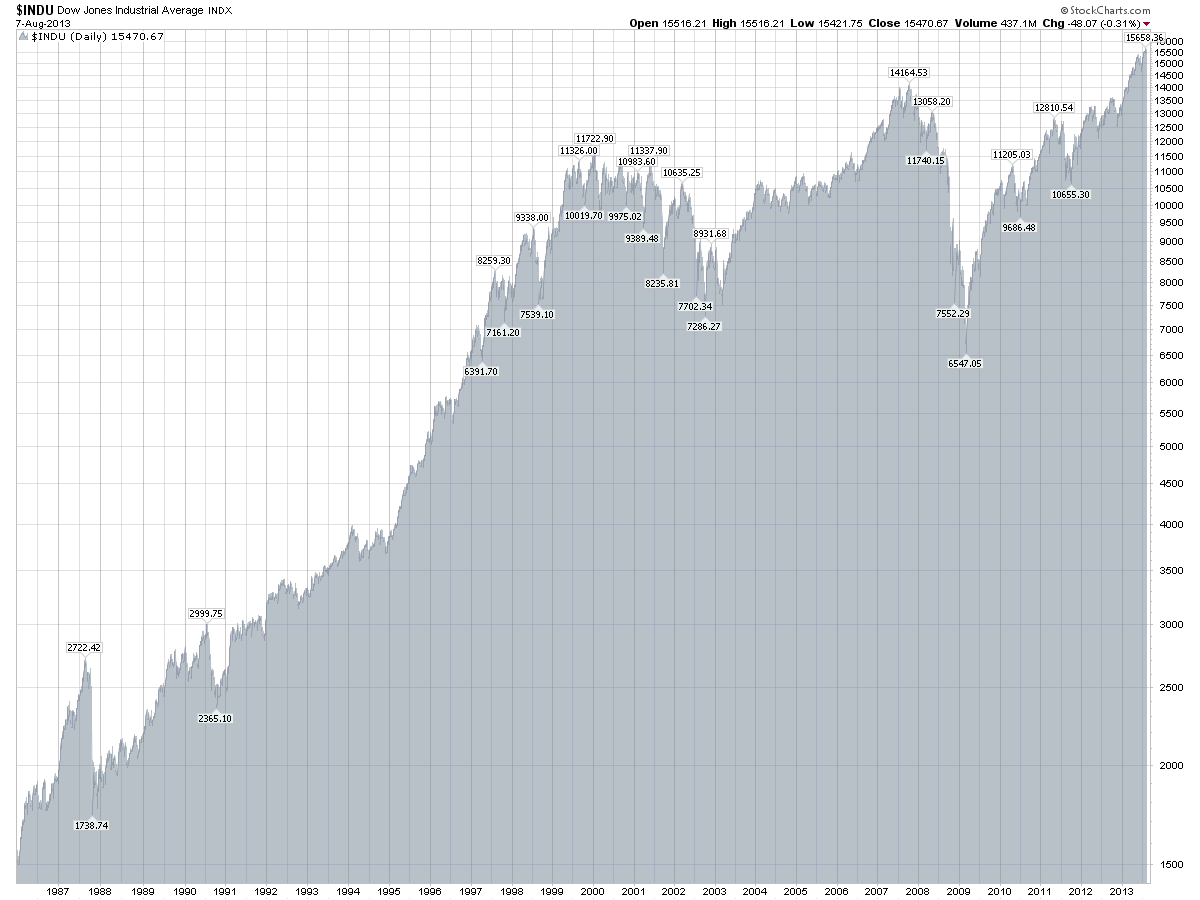
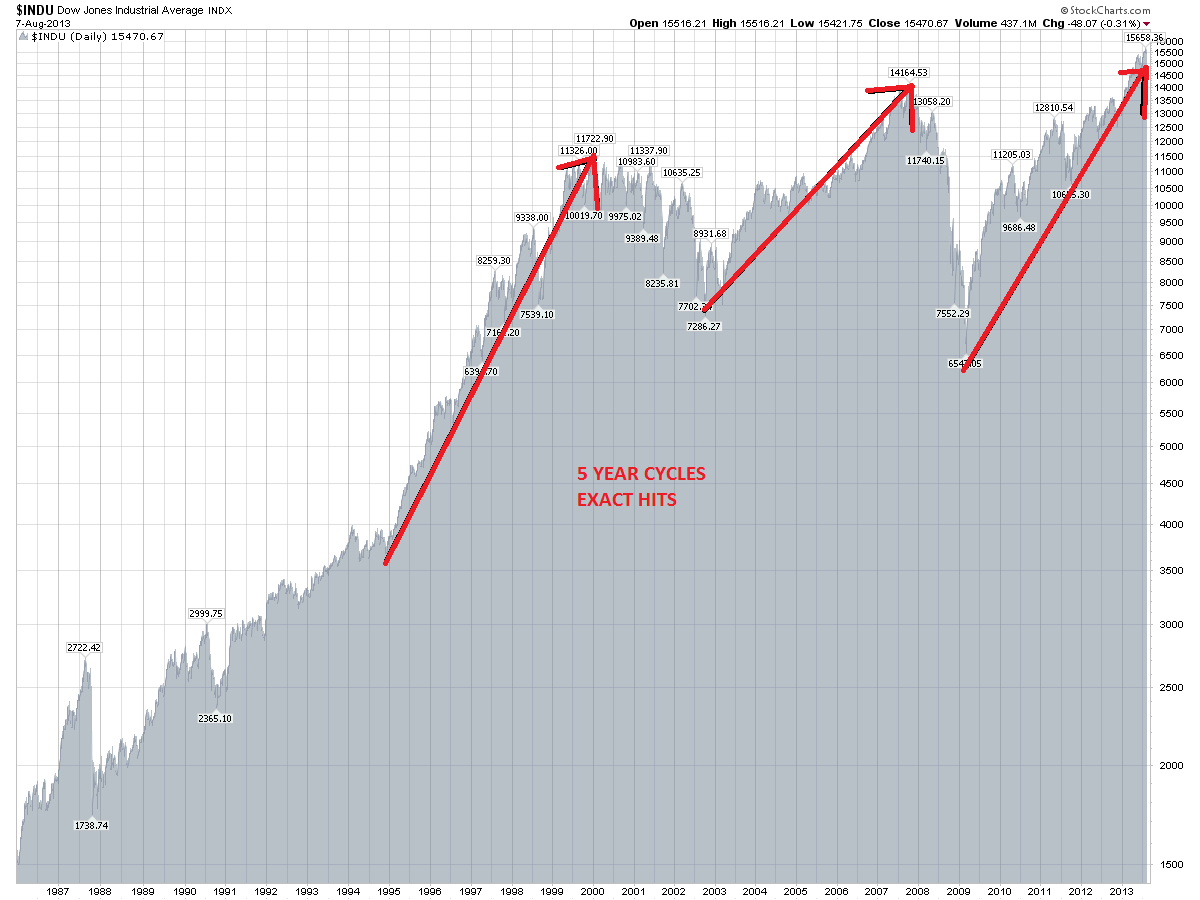
There is a prominent 5 Year stock market cycle that oscillates between the bull and the bear markets. While the cycle does show up as a bear cycle at various points, for the most part this cycle is more clearly identifiable during the bull stage. Let’s take a quick look. More importantly, let’s see what does this cycle can tell us about the future. (We are looking at the DOW)

  1. 1982-1987 From 1982 bear market bottom to pre crash 1987 the cycle lasted exactly 263 week and moved up 1977 points. That is exactly 5 Years + 10 trading days.
  2. 1994-2000 From 1994 bottom on 11/23/1994 to 01/14/2000 the market advanced 8296 points in exactly 1298 trading days. So, this cycle lasted 5 Years +32 trading days.
  3. 2002-2007 From 2002 bottom  on 10/10/2002 to 10/11/2007 top the market advanced 7209 points in exactly 1259 trading days or EXACTLY 5 years.
  4. 2009-2013/14  From 2009 bottom on 03/06/2009 to 9/18/2013 (or march 2014)  the market advanced 9241 points in 1144 days (so far).

AMAZING, isn’t it? I mean we are talking about exact hits. Bottom to top. If you go back and study the market before 1982 you will find the same cycle showing up again and again. The slight deviation by a few trading days at the end of each cycle is caused by other cycles arriving around the same time. Just by knowing this one 5 year cycle you can predict what the market will do and beat 95% of the pros.  

Now, let me warn you. This cycle is not as easy as just timing the 5 year period of time. There is something behind the scenes that causes this cycle to happen. As of right now, I cannot discuss what causes this in the public forum, but the chart above doesn’t lie. Just more prove that the market can be predicted to the day.

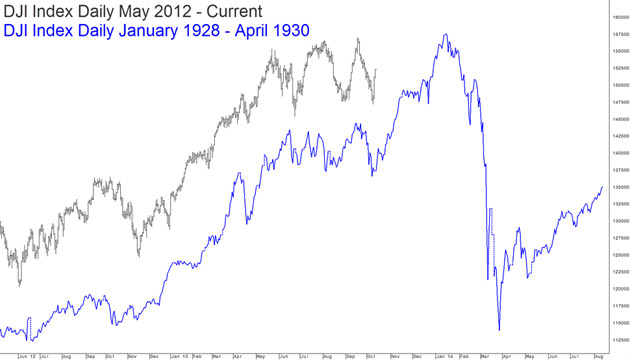
I confirm that another 5 year cycle has indeed started at March 2009 bottom. It is due to complete in March of 2014. However, my other work is showing that the DOW has probably already topped in September of 2013.  There is a lot of interference right now.  

As such, this leads me to believe that the DOW will oscillate here over the next few months until some sort of a top is set in March of 2014 (maybe a little bit higher or lower than September 2013 top). Thereafter, the market should resume its bear market and go down hard into the 2016/17 lows. 

Did you enjoy this article? If so, please share our blog with your friends as we try to get traction. Gratitude!!! 

The Secret 5 Year Stock Market Cycle and What It Is Predicting For 2014

Why I Hate Financial Media


media sheep investwithalex

The only time I really enjoy watching financial media is during the time when financial markets melt down. It is fun to watch their blank faces and their dumb expressions repeating the same two questions “Where is the bottom?” and “How come no one saw this coming?”.

Today was a little bit different, but just as fun.  No one could figure out why the market was surging in the morning. There was no real breakthrough or any concrete type of a debt deal coming out just yet.

Quite the opposite, their Armageddon debt default clock was counting down to a “technical” default with just a few hours left. Why was the market surging? I think everyone of them was spinning doom and gloom, yet the market kept surging.

Here is why.  As I have said many times before, the stock market doesn’t follow the news. It doesn’t care about the US Government nor if it defaults on its debt. The market has an exact mathematical structure that it must trace out. It is a future discounting mechanism, not a reactionary one. It has already discounted what has happened or will happen in Washington a long time ago.

Can it get it wrong and drop down big time if the Government doesn’t pass the bill. Sure, but it will be within the range of the overall trend and not the trend change in itself.

In my future writings I will outline the exact mathematical structure of the stock market discussed earlier to prove once and for all that news have no impact on the financial markets.  

Did you enjoy this article? If so, please share our blog with your friends as we try to get traction. Gratitude!!! 

Secret Structure Of The Upcoming Dow Decline

Dow Jones Long Term Chart


The chart above represents the Dow Jones between 1986 and today. It is clear from the chart that the bear market started at the 2000 top of 11,800 and continues on today even though we have already set two higher tops. Typically the bear/bull markets alternate in a 17 year cycles, so we have another 3-4 years to go before this bear market is over.

However, that is a side point to my main point. What I want you to observe is the structure of the declines between 2000-2003 and 2007-2009. The decline we had in early 2000’s was a more orderly decline with lots of ups and downs, plenty of time (2.5 years) and not to much directional energy. The move in 2007 was quite different. It was directional, it was short (1.5 years), it was high energy and it was violent.    

What’s the point of all of this? First, my work clearly indicates that we are about to start a 2-3 year bear market. All of my technical, fundamental and mathematical work confirm that fact. 

So, what kind of a move should we expect? 

My mathematical work shows that the bear market over the next 2-3 years will be almost identical to the 2000-2003 move. A lot of volatility, overall downtrend, but not too much downside energy. That is not to say that the market will not go low, it is to say that the move over the next few years will not be a violent one. I hope this helps. 

Did you enjoy this article? If so, please share our blog with your friends as we try to get traction. Gratitude!!! 

The Secret Of The Dow Chart

BusinessWeek Writes: Hedge Fund Chart Guru Tom DeMark Sees Dark Days Ahead

DOW JONES -invest with alex 

“The market’s going to have one more rally, then once we get above that high, I think it’s going to be more treacherous,” DeMark says. “I think it’s all preordained right now.” He feels this is probably irrespective of how and when the crippling impasse in Washington is resolved. “If you look at the new highs and new lows on the [New York Stock Exchange],” he says, “every time we made a higher high, there were fewer stocks in the index participating in that high. It’s getting narrower.” And once that happens, you typically get a collapse. The opposite looks to be true for gold, which he expects is making its low right now and should start to move up dramatically.

Read The Rest Of The Article Here

I tend to agree with Mr. DeMark to a certain extent as my own work confirms parts of his analysis. There is no doubt in my mind that we are approaching a major top here in most financial markets. Now, it is just the matter of hard work to pin point it. As I accelerate my timing work over the next few months I should have an exact answer for you by the end of the year.

With that said, there are only two possibilities here (based on my work).

1. The market has already topped. Triple tops are notoriously dangerous and tend to mark the end of a bull market. We have already set 3 tops and as I have suggested before the market finds itself in an exciting spot. We either confirm a bear market here by breaking down below recent lows over the next 4 weeks or….

2. The market will top out in March of 2014. This type of a scenario resembles Mr. DeMark’s forecast above.

Either way, we are approaching the end of a bull leg and you should begin thinking about reallocating your capital in order to avoid losses during the bear market.

Will we experience 1929 type of a decline as Tom suggest? My work doesn’t show that. It shows a slow yet volatile decline into the 8000-9000 range on the DOW over the next 2-3 years

Did you enjoy this article? If so, please share our blog with your friends as we try to get traction. Gratitude!!! 

Stock Market Update: October 10, 2013

daily chart Oct 10, 2013


Summary: Continue to maintain a LONG/HOLD position.

So far, the stock market is acting just as anticipated. In my earlier post Little Known Way To Profit From The US Government Shutdown Default Scare I have suggested that traders should set themselves up for a fast moving rally that is surely to come due to some sort of a government shutdown deal. Today we got that rally. 

With all of the major indexes up over 2%, a large portion of this move is now complete. As I have mentioned before, the market left a lot of gaps on the way down that it must close if we are to anticipate a prolonged bear market decline. If the government shutdown resolution materializes over the next few days I would expect the market to continue going up into the DOW 15500 range. Then pause and possibly reverse itself for good. 

The long term picture remains exciting. While I continue to maintain a LONG HOLD position for the time being, I believe the market is in final stages of setting itself up for beginning of a 2-3 year bear market. We are still waiting for a confirmations here, but things are looking good. Once the market tops here (assuming it won’t go over 15,700) we should start the bear leg. Triple tops are notorious for ending bull markets. 

A little secret for you here. Multiple tops are caused by various cycles hitting at different times. Each top means that the cycle has already reversed itself and is not pointing down. Once the major trend shifts it will be a powerful move down. 

For now we wait while maintaining our long position. 

Did you enjoy this article? If so, please share our blog with your friends as we try to get traction. Gratitude!!!

The Secret Of Upcoming Government Default

Bloomberg Writes: A U.S. Default Seen as Catastrophe 

 Oct 7, 2013 chart

Anyone who remembers the collapse of Lehman Brothers Holdings Inc. little more than five years ago knows what a global financial disaster is. A U.S. government default, just weeks away if Congress fails to raise the debt ceiling as it now threatens to do, will be an economic calamity like none the world has ever seen.

Failure by the world’s largest borrower to pay its debt — unprecedented in modern history — will devastate stock markets from Brazil to Zurich, halt a $5 trillion lending mechanism for investors who rely on Treasuries, blow up borrowing costs for billions of people and companies, ravage the dollar and throw the U.S. and world economies into a recession that probably would become a depression. Among the dozens of money managers, economists, bankers, traders and former government officials interviewed for this story, few view a U.S. default as anything but a financial apocalypse.

Read The Rest Of The Article Here

The media is in overdrive talking up fiscal disaster or catastrophe associated with the “FIRST EVER DEFAULT” over the next few days,  the American people are freaking out, the stock market doesn’t care, the largest bond fund (Bill Gross) is buying bonds while claiming no default…..hysteria and confusion everywhere.

So, what is going on here? What will happen?

To gain clarity all you need to do is step away from all this mess for a second and keep a close eye on only one indicator. The stock market.

Let me put it this way,  if there is a real default, it would indeed be catastrophic. So much so, that I wouldn’t be surprised to see the stock market drop 20-50% within a very short period of time. A crash so to speak. Yet, crashes do not happen when everyone is expecting them (as in this case).

As such and for now, the stock market is predicting that the US Government Fiscal Crisis will be over shortly. In fact, technically speaking the market is setup for a very strong rally here.

Will it be associated with the end of the crisis? I believe so. Take a look at the stock market, everything else is simply noise. I would anticipate the issue to be resolved at any minute now with the stock market surging higher from this point on because of that.  

Did you enjoy this article? If so, please share our blog with your friends as we try to get traction. Gratitude!!! 

Save As Much As You Can. The Storm Is Coming

AP Writes: Five years after crisis, families are hoarding cash

money-saving-investwithalex 

Five years after U.S. investment bank Lehman Brothers collapsed, triggering a global financial crisis and shattering confidence worldwide, families in major countries around the world are still hunkered down, too spooked and distrustful to take chances with their money.

An Associated Press analysis of households in the 10 biggest economies shows that families continue to spend cautiously and have pulled hundreds of billions of dollars out of stocks, cut borrowing for the first time in decades and poured money into savings and bonds that offer puny interest payments, often too low to keep up with inflation.

“It doesn’t take very much to destroy confidence, but it takes an awful lot to build it back,” says Ian Bright, senior economist at ING, a global bank based in Amsterdam. “The attitude toward risk is permanently reset.”

Read A Rest Of The Article Here

A bit of a good news for a change. While most economist will disagree with me, people are starting to act rationally by saving and not spending every single cent that they have. Such economists would argue that by saving (instead of spending) people are slowing down the velocity of the overall economy at the time when the economy needs stimulus the most.

Of course, they would be right. However, in this case saving money is a wonderful idea. In fact, I have been recommending this to my clients and my own family for a long time. My advice is simple, save as much cash as you can and get ready for a buying opportunity of a lifetime at the bear market bottom.

When will such a bottom occur?  My work shows 2016 as the date when the bear market that started in 2000 will finally bottom. At that stage those who have saved and preserved their capital will be presented with an opportunity of a lifetime to buy stocks at give away prices. In net terms, perhaps lower than March of 2009. When the eventual rebound comes, a lot of money will be made by those who are ready.  

Did you enjoy this article? If so, please share our blog with your friends as we try to get traction. Gratitude!!! 

Stock Market Update, October 3rd, 2013

daily chart Oct 3, 2013 

Summary: Continue to maintain a LONG position.

With the US Government shut down, threats of the first ever default and politicians pointing fingers at each other, it has been quite a boring week for the stock market with the Dow down about 250 points (so far) for the week and about 700 points over the last 3 trading weeks.

Let’s attribute that to normal market fluctuations. However, things are starting to get interesting. It is possible that the fundamental and the technical factors are indeed lining up for the confirmation I have been seeking for so long. Please allow me to explain.

The market has opened up a bunch of gap downs over the last 3 weeks. Some of them being as high as 15,600. That means the market will have to go back up in order to close them. As I have mentioned before, I believe the government shut down should be short lived. There are already signs that Republicans are starting to capitulate. If that happens I would expect a short term relief rally that should push stocks higher to close all the gaps.

That COULD be our point of inflection. If the market reverses itself at that point and continues lower by breaking recent lows, I would most likely welcome you to the beginning of the bear market I have been predicting. For now, we continue to wait for our confirmations.

As such and for the time being I continue to maintain my “HOLD” position for the DOW if you are long.  

Did you enjoy this article? If so, please share our blog with your friends as we try to get traction. Gratitude!!!

Jesus Confirms, No Market Crash This Year

World Report Writes: Ignore the Pundits Predicting a Market Crash


jesus and the stock market investwithalex

There are many reasons to be concerned about the market these days. Among them are the government shutdown, the recent run-up of the market and the fear that stocks are currently overvalued.

The problems of trying to time the market are many. Short-term movements are random and unpredictable. Prices change rapidly, making it difficult to predict them with any certainty. Missing a relatively few of the best trading days by “sitting on the sidelines” can have a seriously adverse impact on your returns.

Read The Rest Of The Article Here

I oftentimes use the terms “Collapse” of the US Economy and the stock market too loosely here.  This little note is to correct that. I agree with the first premise of the article that you should ignore anyone who is predicting a market crash at this point in time.

My work doesn’t show that activity. It shows a prolonged 2-3 year decline into the 2016 bottom.  Not a huge drop over a short period of time, but a lot of volatility, up and downs,  with a general trend pointing down. Basically, we have to get into the 8,000-9,000 territory on the DOW over the next few years.

However, I do not agree with the premise that the market cannot be timed. It very well can be.  My mathematical work clearly proves that. It is the authors close mindedness that leads him to that unfortunate conclusion.  Yet, instead of arguing the point I will show you how the market can be timed over the next few months. Keep coming back. 

P.S.  After a short discussion with my office mate Jesus M. he has confirmed that there won’t be a crash either.  

Did you enjoy this article? If so, please share our blog with your friends as we try to get traction. Gratitude!!!

Why Happy Fingers Bernanke Can’t Sleep At Night

BusinessWeek Writes: Slow Job Growth Suggests Fed Was Right to Delay Taper

 bernanke meme

The private sector added 166,000 jobs in September,  fewer than most economists predicted, according to the ADP Research Institute’s monthly tally. ADP (ADP) also revised August’s jobs number down to 159,000 from 176,000.

The September number’s not bad—it’s right in line with the 2013 monthly average of 167,000. But it’s certainly not evidence of a labor market that’s picking up steam.

“The ADP report suggests the Fed was right to delay the tapering of its monthly asset purchases last month,” Paul Ashworth, chief U.S. economist at Capital Economics, wrote in a note this morning.

Read The Rest Of The Article

Here is the bottom line. Happy fingers Bernanke will keep playing with his keyboard as he continues to print $85 Billion of QE per month. That is not even a question. I do not believe they will tapper anytime soon if at all. This is not the real issue here.

The really scary issue is that the QE is having very little impact on the overall economy.  The velocity of the QE money has slowed down so much that it is almost a non issue. 

Imagine a car engine that is stuck on 2000 rpm no matter how much gas or even jet fuel you supply the engine with. No matter what you add to the tank, the engine can’t go over 2000 rpm. What’s worse, after a while it start to sputter and eventually dies.  

You have that picture in mind? Well, that is an accurate representation of the US Economy.  EQ is no longer having an impact. As such, they can’t even consider stopping it now. 

Yet, the worst is yet to come. The economy is now starting to sputter even with QE. When that accelerates the downshift and the subsequent stock market and economic declines will be severe. 

Did you enjoy this article? If so, please share our blog with your friends as we try to get traction. Gratitude!!!