
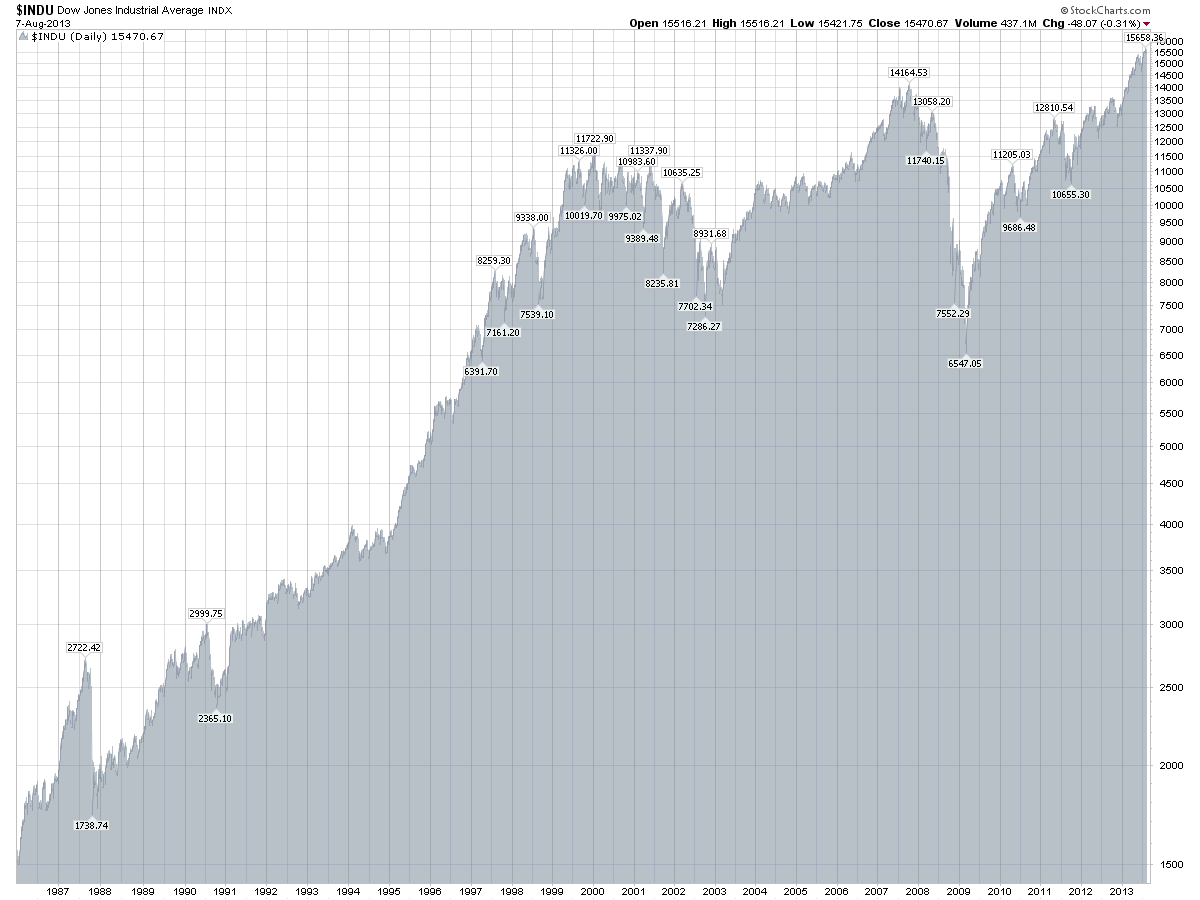
The chart above represents the Dow Jones between 1986 and today. It is clear from the chart that the bear market started at the 2000 top of 11,800 and continues on today even though we have already set two higher tops. Typically the bear/bull markets alternate in a 17 year cycles, so we have another 3-4 years to go before this bear market is over.
However, that is a side point to my main point. What I want you to observe is the structure of the declines between 2000-2003 and 2007-2009. The decline we had in early 2000’s was a more orderly decline with lots of ups and downs, plenty of time (2.5 years) and not to much directional energy. The move in 2007 was quite different. It was directional, it was short (1.5 years), it was high energy and it was violent.
What’s the point of all of this? First, my work clearly indicates that we are about to start a 2-3 year bear market. All of my technical, fundamental and mathematical work confirm that fact.
So, what kind of a move should we expect?
My mathematical work shows that the bear market over the next 2-3 years will be almost identical to the 2000-2003 move. A lot of volatility, overall downtrend, but not too much downside energy. That is not to say that the market will not go low, it is to say that the move over the next few years will not be a violent one. I hope this helps.
Did you enjoy this article? If so, please share our blog with your friends as we try to get traction. Gratitude!!!