Alibaba (BABA): More Money Than Brains?

Abibaba BABA InvestWithAlex

When Alibaba (BABA) went public on September 19th, it marked an important top. Large October sell-off started the following day.  On that day I commented on how ridiculously overpriced and over hyped Alibaba was. Alibaba Stupidity. I continue to maintain this view today.

And while Alibaba (BABA) is down 25% since its top in mid November, I believe the party to the downside is just getting started. If you haven’t noticed, Alibaba is trying incredibly hard to spend its IPO money as fast as they can. What are they doing with this money? Investing in other highly speculative and overpriced Internet business. Case and point…

Alibaba is clearly suffering from a severe case of “More money than brains”. Typically, when bear markets kick in (something that is about to happen), such overextended and overvalued companies, particularly the high tech IPOs, tend to collapse 60-90%. In other words, if you have patience, Alibaba (BABA) is one juicy short here.

z33

Alibaba (BABA): More Money Than Brains? Google

Russia And China Prepare For War Vs. The US/NATO

May 9th soviet parade - investwithrussia

Over the weekend Russia celebrated its victory day over Nazi Germany in World War 2. Roll Independence Day, Thanksgiving and Christmas into one and you will have a fairly good idea of how important this day is for the Russian people. Were the former allies, the US/U.K, there to help mark this historic day? Of course not. Instead, western media spent half the weekend making fun of a Russian tank that apparently broke down or just stopped for a coffee break. The CIA is still unclear on that one.

Guess who was there? That’s right, China.

So, what’s the big deal? First, Russia sees that as yet another slap in the face from the West. If you are history buff, as I am, you would agree that the World War 2 was won in Stalingrad when Germany’s 6th army was destroyed. That was the turning point and not the D-day invasion that happened 1.5 years later.

Most importantly, as I initially outlined in my report (now book) close to two years ago, Nuclear World War 3 Is Coming Soon.When, How & Why, Russia and China are coming closer together to form an eventual military alliance. That is to say, the things that I have predicted at that time continue to align. But don’t freak out just yet. We still have another 15 years before the war starts. Enjoy it.

Z30

Russia And China Prepare For War Vs. The US/NATO Google

Markets Levitate As Divergences Hit Record Highs

Daily Chart May 8th InvestWithAlex

5/8/2015 – A positive day with the Dow Jones up 266 points (+1.49%) and the Nasdaq up 58 points (+1.17%). 

The jobs number missed its expectation? Sell, sell, sell. Wait! What? It’s ideal enough for the FED to pause their proposed interest rate hikes? Buy, Buy, Buy!!! That about summarizes today’s market action. And if you had any doubts that this market is purely FED/Liquidity driven, well, they should be gone by now.

A few important things to get through before the weekend.

First, quite an honest look from Bill Gross of where we are today, what is causing today’s asset valuation bubbles and what the eventual outcome will be. Bill Gross: Central Banks Are Gaming Asset Prices Definitely worth a look. To summarize, we are now in two massive bubbles, stocks and bonds, driven by the FED and their obsession with higher asset prices. To perpetuate the myth of strong economic recovery. It now becomes a matter of time before all of this ends very badly. I cold-heartedly agree.

Second, macro economic data continues to collapse and equity outflows accelerate as the stock market remains near all time highs. Divergences galore. The disconnect in the US stock market just keeps getting bigger. The charts below should send a chill down your spine.

equity outflows investwithalex

Macrodata

Finally, Larry Summers is concerned the US Economy will fall back into a recessionary mode. Larry Summers: I’m Concerned US Growth Won’t Pick Up

I have held a view that the US Economy will start rolling over into an all out recession by the 4th quarter of 2014. We have been witnessing exactly that over the last few months. This is rather simple. The entire US Economic recovery, over the last few years, has been driven by QE, zero interest rates and asset price speculation.

Take that away and we would already be in a severe recession. Further, now that these “prosperity drivers” are withering away, there is absolutely nothing to drive this economy forward. I have already covered the fact that we won’t see CAPEX growth going forward and I am having a really hard time imagining what can push us forward. Considering today’s valuation levels, this will indeed end very badly.

This conclusion is further supported by my mathematical and timing work. It clearly shows a severe bear market between 2015-2017. In fact, when it starts it will very quickly retrace most of the gains accrued over the last few years.  If you would be interested in learning when the bear market of 2014/15-2017 will start (to the day) and its internal composition, please CLICK HERE.

(***Please Note: A bear market might have started already, I am simply not disclosing this information. Due to my obligations to my Subscribers I am unable to provide you with more exact forecasts. In fact, I am being “Wishy Washy” at best with my FREE daily updates here. If you would be interested in exact forecasts, dates, times and precise daily coverage, please Click Here). Daily Stock Market Update. May 8th, 2015  InvestWithAlex.com

Did you enjoy this article? If so, please share our blog with your friends as we try to get traction. Gratitude!!!

Markets Levitate As Divergences Hit Record Highs Google

Why The Stock Market Is Exact And Not Random

Daily Chart May 7th InvestWithAlex

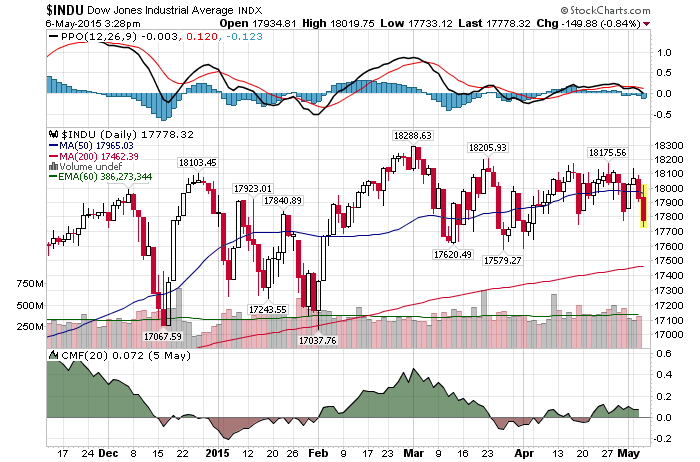
5/7/2015 – A positive day with the Dow Jones up 83 points (+0.47%) and the Nasdaq up 26 points (+0.53%).

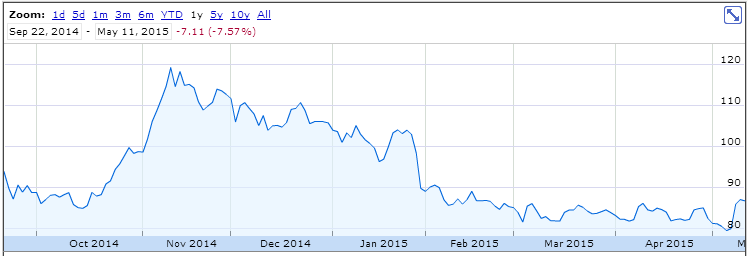
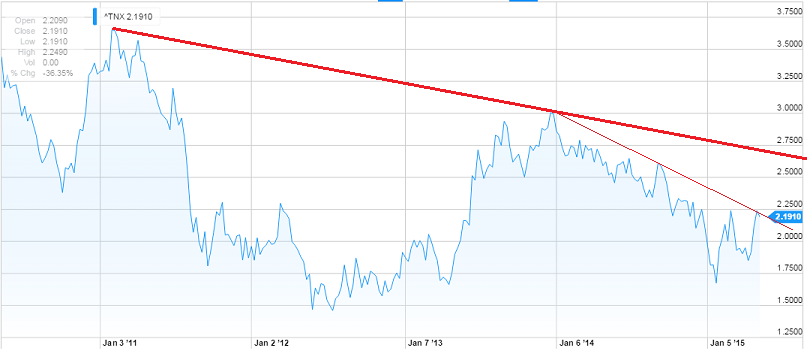
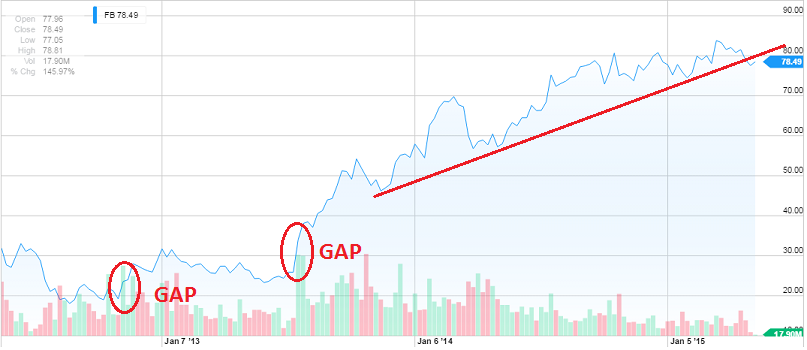
Over the last few months the stock market has been about as exciting as a day at the dentist. So much so that the Dow of today trades exactly where it was on November 21st, 2014. The NYSE is where it was in July of 2014. But do not despair, this period of low volatility will soon end.

Most investors believe that the stock market is random, volatile, and cannot be predicted. Nonsense. If anything, the market is exact. Once you understand how it works behind the scenes (The Secret Behind The Stock Market), exact calculations can be made.

That is precisely what the charts below show.

S&P Symmetry InvestWithAlex

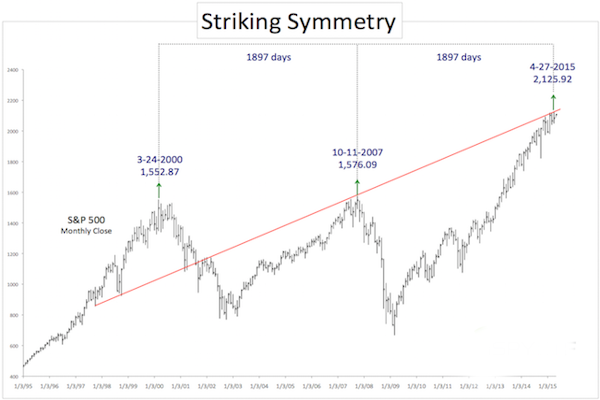
Here is one of my charts showing something similar, but much more accurate.

Long Term Dow Structure35

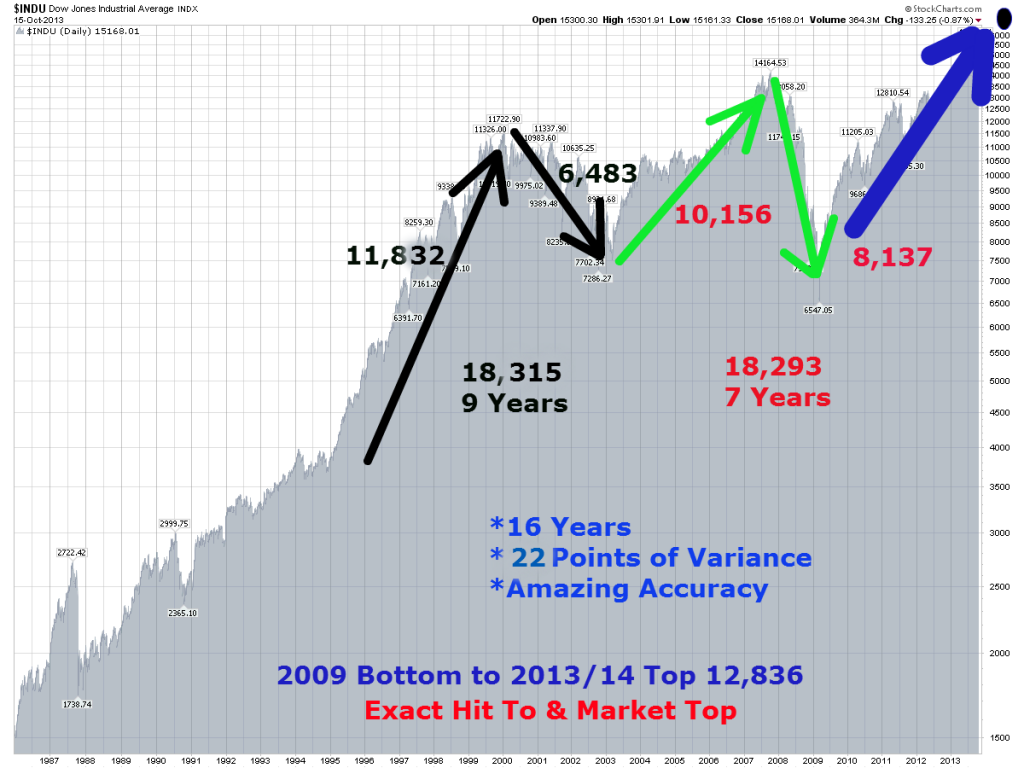
I cannot overstate how amazing this chart is. Just a few points.

  • As we have already discussed, the move between 1994 bottom and 2000 top was 11,832 3-DV UNITS. The Dow topped at exactly 11,866 in January of 2000. Amazing!!!
  • The up move between 1994 bottom and 2000 top was 11,832 3-DV UNITS. The down move between 2000 top and 2002 bottom was 6,483 3-DV UNITS. When you combine both values together you end up with a value of 18,315 3-DV UNITS. The move took 9 years.
  • The up move between 2002 bottom and 2007 top was 10,156 3-DV UNITS. The down move between 2007 top and 2009 bottom was 8,137 3-DV UNITS. When you combine both values together you end up with a value of 18,293 3-DV UNITS. The move took 7 years.

To summarize, the combined move took 16 years and there was only 22 3-DV UNITS of variance between two sections. This variance over the 16 year period of time can be attributed to as little as 2 trading days and a few hundred points on the Dow. This example alone should put to rest all claims that the stock market is random and unpredictable. Once again, when we identify the exact structure of the stock market through using our 3-Dimensional analysis we can time the market with great precision.

For example, if we understand the structure above we know that the move between 2002 bottom and 2009 bottom will be identical in 3-DV UNITS of the move between 1994 bottom and 2002 bottom. Just by having this information alone one should be able to figure out the stock market with great precision. Further, once we have hit the 2007 top on the DOW, any analyst using this technique knows that the upcoming down move will be exactly 8,127 3-DV UNITS. (18283-10156=8,127)

That would mean that once the 2007 top is confirmed you would know exactly where the market would bottom. So, while everyone is freaking out in the late 2008 and early 2009 you are either shorting the market and making a lot of money or you are setting yourself up for the upcoming bull market that you know will start in March of 2009.

I hope this clearly illustrates how powerful this 3-Dimensional analysis can be. Also, please keep in mind that the example above is just a tiny sample of the information available to you once 3-Dimensional analysis is performed. Again, once the market structure is fully understood you would know not only where but WHEN the market would turn.

This conclusion is further supported by my mathematical and timing work. It clearly shows a severe bear market between 2015-2017. In fact, when it starts it will very quickly retrace most of the gains accrued over the last few years.  If you would be interested in learning when the bear market of 2014/15-2017 will start (to the day) and its internal composition, please CLICK HERE.

(***Please Note: A bear market might have started already, I am simply not disclosing this information. Due to my obligations to my Subscribers I am unable to provide you with more exact forecasts. In fact, I am being “Wishy Washy” at best with my FREE daily updates here. If you would be interested in exact forecasts, dates, times and precise daily coverage, please Click Here). Daily Stock Market Update. May 7th, 2015  InvestWithAlex.com

Did you enjoy this article? If so, please share our blog with your friends as we try to get traction. Gratitude!!!

Why The Stock Market Is Exact And Not Random  Google

Are Yields About To Break Out?

10 Year Note Chart InvestWithAlex

The chart above is probably one of the most important charts in finance today. As you can see, the 10-Year Treasure Note is pushing against a fairly significant short-term resistance level at around 2.25%.

Should it break out, it is likely to reach at least 2.6%. Its long-term resistance level. This brings out a number of important questions. In fact, more questions than anyone can answer at this point. For instance,……

  • Was the secondary bottom in yields set in early January?
  • Will yields now stage a multi-year, even a multi-decade advance?
  • Is this signaling the FED will raise rates and soon?
  • Does this spell doom for the stock market?
  • Etc….

Only time and market action can answer the questions above. At least for now, I am sticking to my overall long-term forecast. The secondary bottom in yields of 1.4-1.5% is not yet in and we are on schedule to see it over the next 12-24 months. If the yields don’t turn around and resume their decline at today’s resistance levels, I fully expect 2.6% resistance line to stop any long-term advance.

z33

Are Yields About To Break Out? Google

Holographic Universe And The Secret Behind The Stock Market

holographic universe

I love science and mathematics. Yet, once you start digging deeper you soon come to a realization that our physical 3-dimensional reality doesn’t make sense. So much so that what is available to our human senses is just a small fraction of our true reality. In other words, human existence is nothing more than an advanced computer simulation. Leading physicists across the globe are starting to come to the same realization.

There Is Growing Evidence that Our Universe Is a Giant Hologram

What does any of this have to do with the stock market?

Everything. Just as our human reality is nothing more than a shadow of higher dimensions, the 2-dimensional chart we all follow is just a shadow representation of true market moves. Here is how the stock market really works.

The markets being, at minimum, a 3-Dimensional phenomena, exactly like a large molecule rotating in space, in and out of the Z plane, with DNA coding sequences governing the entire process. Without understanding that the market is 3-D, twisting like a plant governed by the phyllotactic laws of dual number series and harmonic composition and decomposition, all measurements taken on a 2-D chart become misleading.

Mind blowing. By the way, human beings have the ability to jump to this higher dimension of reality through extensive meditation. Most traditions around the world call this “enlightenment”. In scientific terms, it is identical to electrons jumping between quantum levels. Once enough energy is accumulated within the human mind/body structure (through meditation), this quantum jump is automatically made.

Z30

Holographic Universe And The Secret Behind The Stock Market Google

As The Dow Goes Negative For The Year, The Worst Is Yet To Come

Daily Chart May 6th InvestWithAlex

5/6/2015 – Another down day with the Dow Jones down 85 points (-0.48%) and the Nasdaq down 20 points (-0.40%). 

A massive and rather rapid stock market decline is coming later on this year. And while we won’t have a crash, considering the amount of margin debt out there, quite a few people will get wiped out. If you would like to find out exactly when this move will develop, to the day, please Click Here. 

For now, most investors continue to play chicken with the FED. And they will pay dearly for it. I am not sure if the FED can be any more clear here. They WILL raise rates and soon. Plus, when even Janet Yellen suggests that stocks are too expensive….Fed’s Yellen says equity valuations high, warns of ‘potential dangers’…..well, you deserve to lose a lot of money if you maintain a net bullish position going forward.

At the same time, maybe the bulls are right. According to quite a few market pundits, the party in the equity markets hasn’t even started yet. Case and point.

I cannot stop shaking my head in disbelief. To save you some time, here is what was said:

“This is an extraordinary buying opportunity, buy any and all dips, with zero interest rates the price of equities could be infinite, this bull market will continue, valuation don’t matter anymore, etc….”

Valuations don’t matter……infinite run ups are just around the corner …..buy now. That sounds familiar. If I didn’t hear the exact same thing at 2007 and 2000 tops, well, call me a fool.

Again, the underlying assumption in both cases is the same. We are in such a unique monetary easing environment that there is no way in hell the markets can go down. Maybe so, but here is the major point that most investors miss. Today’s market environment becomes a matter of psychological setup as opposed to a fundamental background.

When everyone and their day trading grandmother believe that we are in such a bullish environment, the market is getting ready to reverse. Why? Well, it’s rather simple, everyone has already bought into the long side of the market. Contrary to the opinion of the market pundits above, I would argue that the only opportunity here is on the short side (or in cash).

This conclusion is further supported by my mathematical and timing work. It clearly shows a severe bear market between 2015-2017. In fact, when it starts it will very quickly retrace most of the gains accrued over the last few years.  If you would be interested in learning when the bear market of 2014/15-2017 will start (to the day) and its internal composition, please CLICK HERE.

(***Please Note: A bear market might have started already, I am simply not disclosing this information. Due to my obligations to my Subscribers I am unable to provide you with more exact forecasts. In fact, I am being “Wishy Washy” at best with my FREE daily updates here. If you would be interested in exact forecasts, dates, times and precise daily coverage, please Click Here). Daily Stock Market Update. May 6th, 2015  InvestWithAlex.com

Did you enjoy this article? If so, please share our blog with your friends as we try to get traction. Gratitude!!!

As The Dow Goes Negative For The Year, The Worst Is Yet To Come  Google

Are Social Media Stocks/ETF About To Get Destroyed?

Let’s take a quick look at two charts. Facebook (FB) and Twitter (TWTR).This is rather simple. Fundamentaly speaking, both companies are massively overpriced.  Technically, Twitter is on the verge of breaking below a massive muti-year rising wedge.

Should it do so, I wouldn’t be surprised to see Twitter below $15 a share over the next 12-18 months. Facebook is about to break below a major/important support level. The problem is, Facebook has massive gaps all the way down to $20 a share. Gaps that must be closed sooner or later. That is not a good sign.

Hmm, I wonder what happens next. 

Twitter TWTR - InvestWithAlex

Facebook FB - InvestWithAlex

z32

Are Social Media Stocks/ETF About To Get Destroyed?  Google