Summary: Continue to maintain a LONG/HOLD position
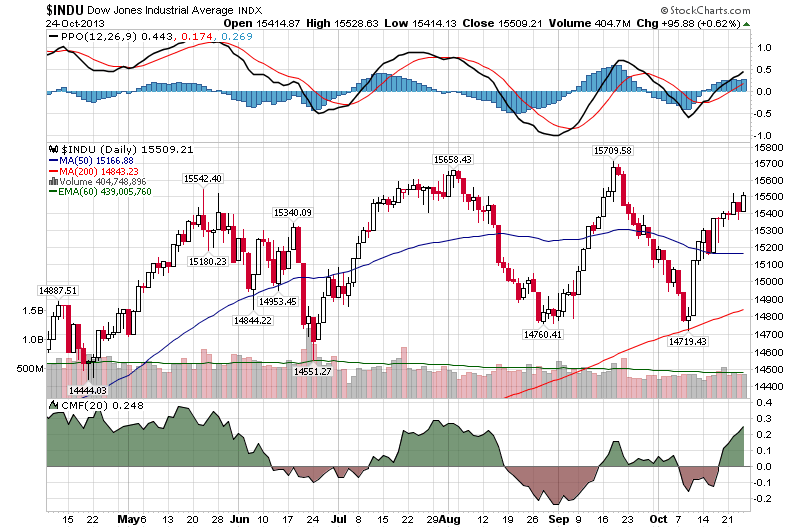
Not much has changed since our last weekly update. Even though the DOW set a new high by a few points, it doesn’t really matter. In fact, I will leave my last weeks update mostly intact while adding a few little things here.
1. Trippe tops spread out over weeks or months are notoriously dangerous. That is exactly where we are. They typically indicate the end of a move and beginning of a counter move (or bear market in our case). Unless the market breaks to the upside here, this might be the end.
2. My mathematical work is showing that this energy level is tapped out. The market has no room nor energy to go higher here. That is why we are seeing the triple top.
3. The market left a huge gap around 14,800, it must go back there before any sustained rally can take place.
LAST WEEKS MARKET SUMMARY: Still Valid
This is where the picture gets a little bit fuzzy. According to my mathematical work there is no doubt that we are at the inflection point with two possible outcomes.
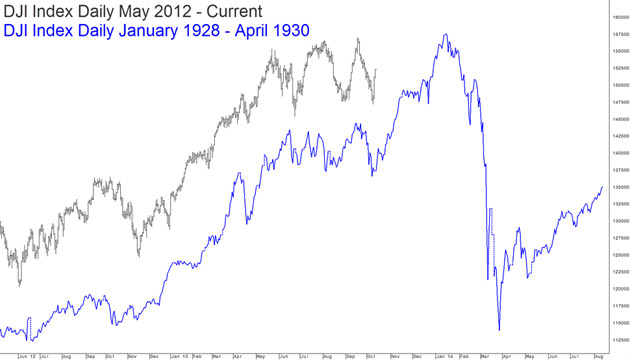
- September 2013 top was indeed the top and the bear market down leg will resume shortly.
- The final top (a little bit higher or lower than September 2013 top) will be set in March of 2014. Thereafter the market will roll over and begin its bear phase.
As I have mentioned many times before, my mathematical work is clearly showing that the bull is ending and the 2-3 year Bear market is just beginning. I would call the exact date, but there is just too much interference right now. Unless a severe down leg starts over the next 2 weeks, we will have to wait until March of 2014 for the Bear to start. Until that happens a lot of ups and downs without so much as going anywhere. The rest of my analysis remains the same.
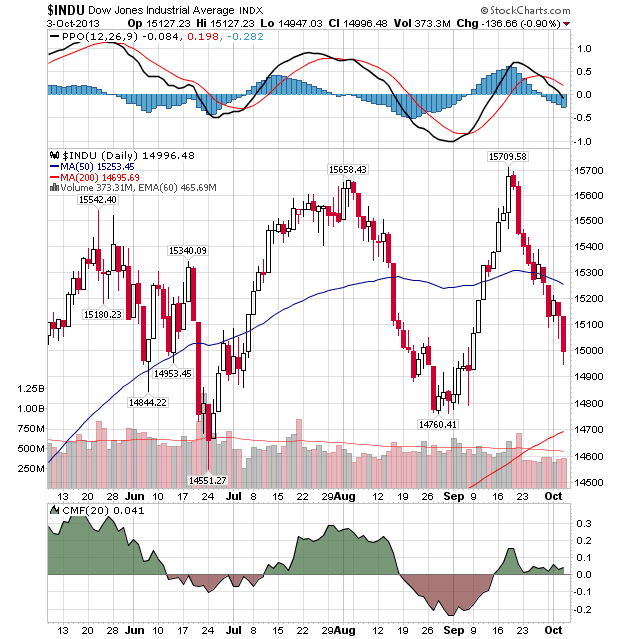
Over the next few weeks we will find out if the if the bear market has already started or will start in March of 2014. Should the market break below 14,600 over the next two weeks, the probability is high that we have already started the bear market leg into the final 2016 bottom. The market is certainly going back into the 14,800 as it left a huge gap there, but a firm break below 14,600 will give us a confirmation that the bear is back.
At the same time we cannot yet ignore the technical picture with the market being near an all time high. As such, I continue to advise you to maintain a LONG/HOLD position while waiting for the confirmation that the bear market has indeed started.
Did you enjoy this article? If so, please share our blog with your friends as we try to get traction. Gratitude!!!