Bears Close Down Shop As Most Market Participants Continue To Scratch Their Heads

Daily Chart AAMarch 2 InvestWithAlex

3/2/2016 – A positive day with the Dow Jones up 34 points (+0.20%) and the Nasdaq up 14 points (+0.29%)

When I was shorting stocks in May of 2015, I distinctly remember Marc Faber throwing in the towel and suggesting that stocks might never go down again. Due to FED’s intervention. He is at it again……

Dr. Not So Doom: Marc Faber says stocks may rally

“That could drive the market up to maybe around 2,050, but I don’t necessarily see new highs, and if new highs happen, they will happen with very few stocks participating,” he said.

Fair enough. Yet, confusion among market participants continues to dominate. And while some attempt to explain away the rally Reasons Behind the Rally in Equity Markets others openly admit confusion, frustration and complexity associated with today’s market environment. TOP HEDGE FUND MANAGER: ‘The future for me is now more uncertain than at any time I can remember’

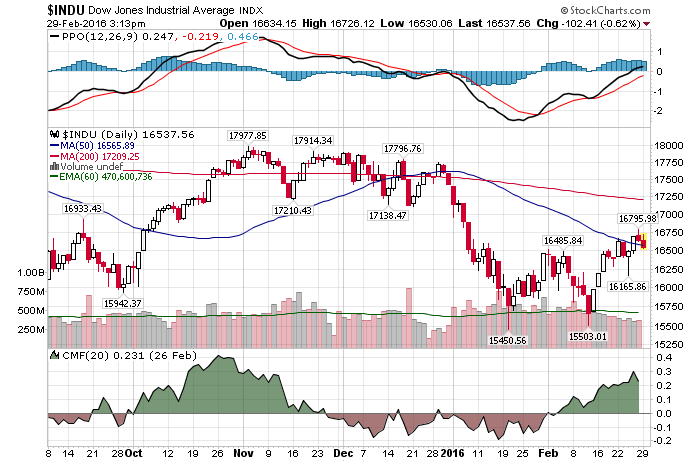
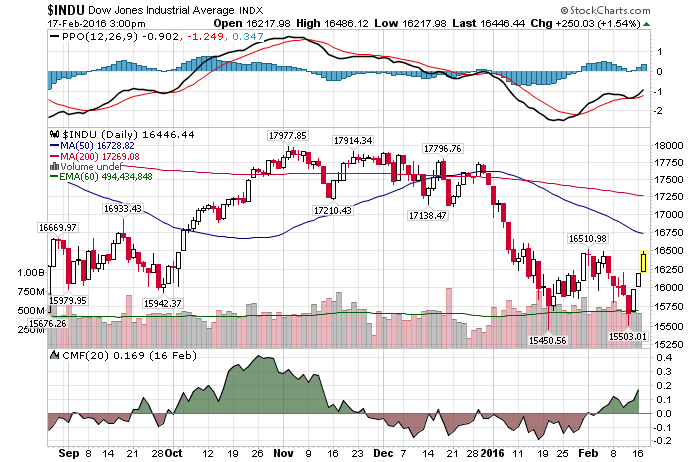
About 4 weeks ago I introduced the following chart to you. Suggesting in the process that the market will drive both bulls and bears up the wall over the next few weeks. And that is exactly what has been happening. Although, one can argue, at least for the time being, that bulls are winning the battle.

February Chart

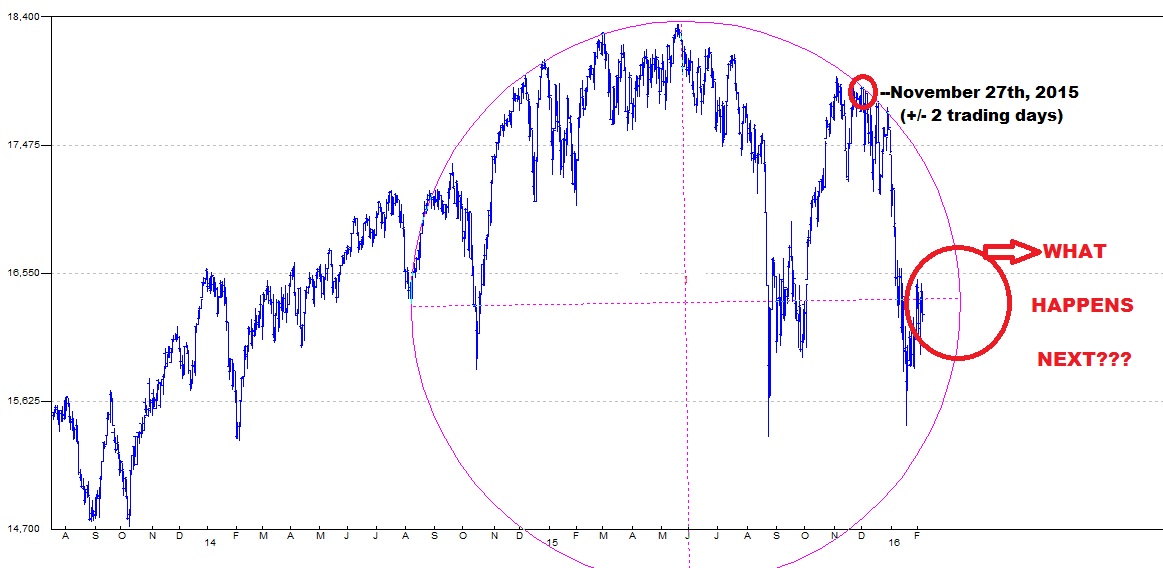
In reality, the market remains within the confines of a trading range or support/resistance levels outlined above. Further, the market will continue to trade within the said trading range until a certain date is reached in the future. When that happens, the market will stage a massive move. Either up or down.

If you would like to find out exactly when, in TIME, the structure above terminates. In addition to in which direction this larger move will develop, please Click Here. 

This conclusion is further supported by my mathematical and timing work. It clearly shows a severe bear market between 2015-2017. In fact, when it starts it will very quickly retrace most of the gains accrued over the last few years.  If you would be interested in learning when the bear market of 2015-2017 will start (to the day) and its internal composition, please CLICK HERE.

(***Please NoteA bear market might have started already, I am simply not disclosing this information. Due to my obligations to my Subscribers I am unable to provide you with more exact forecasts. In fact, I am being “Wishy Washy” at best with my FREE daily updates here. If you would be interested in exact forecasts, dates, times and precise daily coverage, please Click Here). Daily Stock Market Update. March 2nd, 2016  InvestWithAlex.com

Did you enjoy this article? If so, please share our blog with your friends as we try to get traction. Gratitude!!!

Golden Dreams, China’s Upcoming Devaluation & The Stock Market Rally

Daily Chart AFebruary 29 InvestWithAlex

2/29/2016 – A negative day with the Dow Jones down 127 points (-0.76%) and the Nasdaq down 33 points (-0.71%) 

Gold bugs are excited. It appears Gold is breaking out of its multi-year slump after taking out important resistance levels. Fundamentals look right as well. As any financial crisis caused by the overvalued stock market would surely cause massive inflows into the sector.

Why buying gold now could be a lot like buying stocks in 2009.

Perhaps. Yet, a number of things do not add up. Most importantly, various technical and sentiment indicators suggest that the bottom is not yet in. Here is the view expressed by Matt Demeter Find Out Why Gold Is Going Much Lower A view that is just as valid today.

Now, let’s talk about China. The first rule of investing is…….when a government entity issues a strong statement in support of a financial instrument, you know what to do. Run the other way. Here is what China had to say about Yuan devaluation

China assures US no devaluation, pushing reforms forward

Fair enough, but I would rather listen to what hedge fund manager Kyle Bass had to say about the subject matter. We wrote about it just a few days ago Further Yuan Devaluation Imminent In other words, China has no choice. It either devalues or goes through an economic/financial collapse. Invest accordingly.

Finally,there is at least one bull out there who still believes….

Tom Lee: These factors point to higher stocks

Longtime bull Tom Lee said Friday it’s been tough lately to be positive on stocks, but too many investors may have have tilted to the bearish camp. Lee played down the concern about the possibility of a global recession, saying market internals like transport and small-cap stocks are not pointing to a recession. “If we’re actually seeing worsening economic conditions, these should be in a death spiral,” he said. But he noted that these groups have actually been doing better.

I actually would have to agree with Mr. Lee in regards to investor sentiment. I wrote about it just a few days ago. Shocking: Here Is Why The Stock Market Is Rallying

As for the latter, I strongly disagree. Fewer and fewer stocks are keeping this market afloat. On top of that, valuations are still incredibly high as per Shiller’s Adjusted P/E ratio. We are talking about historic highs. All while the S&P earnings are falling at the fastest pace since 2008 financial crisis. Forward guidance was adjusted down a little over 2%.

Put all of that together and it becomes fairly clear which way the market will swing long-term. That is not to say we can’t have substantial rallies along the way, but rather, to suggest that any bullish dreams might have to be adjusted here.

This conclusion is further supported by my mathematical and timing work. It clearly shows a severe bear market between 2015-2017. In fact, when it starts it will very quickly retrace most of the gains accrued over the last few years.  If you would be interested in learning when the bear market of 2015-2017 will start (to the day) and its internal composition, please CLICK HERE.

(***Please Note: A bear market might have started already, I am simply not disclosing this information. Due to my obligations to my Subscribers I am unable to provide you with more exact forecasts. In fact, I am being “Wishy Washy” at best with my FREE daily updates here. If you would be interested in exact forecasts, dates, times and precise daily coverage, please Click Here). Daily Stock Market Update. February 29th  InvestWithAlex.com

Did you enjoy this article? If so, please share our blog with your friends as we try to get traction. Gratitude!!!

Golden Dreams, China’s Upcoming Devaluation & The Stock Market Rally  Google

Shocking: Here Is Why The Stock Market Is Rallying

Daily Chart AFebruary 25 InvestWithAlex

2/25/2016 – A positive day with the Dow Jones up 213 points (+1.29%) and the Nasdaq up 39 points (+0.87%) 

I don’t remember the last time when financial media sentiment has been so bearish. Maybe in early 2009?  It is a complete reversal from our May 2015 top, a time when you couldn’t find a single bearish article even if your life dependent on it.

Simply put, everyone now believes that financial Armageddon is just around the corner. Here is just a small sample from today.

My God!!!…..no wonder the market is rallying here. In other words, if you are a bear, you should be very concerned. There are just too many people jumping on the bearish bandwagon at the present moment.

Luckily, I then saw this ray of hope Historical pattern says the risk of a 2016 bear market is zero

Every single time the S&P 500 gained more than 1.5% a day for three consecutive days, it traded higher a year later.

The S&P 500 violated the low set prior to the kickoff move only twice (1987, 2000). Both times it bounced back quickly.

In 2016, the S&P 500 closed at a 52-week low before its kickoff rally. In 1970, 1987 and 2011, the S&P 500 also closed at a 52-week just before soaring higher.

Obviously, kickoff rallies like this are not the only factor driving stocks, but this particular pattern confirms the six reasons for a stock market rally listed by the February 11 Profit Radar Report (all six reasons are available here).

The Feb. 11 Profit Radar Report recommended buying the S&P 500 at 1,828 (after it fell as low as 1,810) in anticipation of a sizeable rally.

As compelling as this historic pattern may be, tunnel vision is a luxury investors can’t afford. It’s worth noting that the 2016 kickoff is weaker (in terms of consecutive percentage gains) than prior kickoff rallies, and our major-market-top liquidity indicator raised a caution flag in May 2015.

The scope of this rally has yet to be revealed, and a break below the February low is still possible (like in 1987 and 2002).

Regardless of the S&P’s near-term path, history says we shouldn’t under estimate this kickoff rally. Acting on the sentiment-based buy signal at S&P 1,828 provided a low-risk entry point and insurance against a runaway rally.

Ummm…so let me get this straight. The market has rallied 3 days in the row and now there is ZERO chance of 2016 being negative? Only an idiot would follow this line of thinking. This reminds me of “Years ending in 5 are always positive” myth propagated last year. At least it was until both the S&P and the Dow finished the year in the negative territory. And there went that 120+ year myth.

In reality, we are dealing with a very complex market environment.

That is exactly what I proposed on this free blog forum 2-3 weeks ago. After presenting the chart below and suggesting that the current market will drive both bulls and bears up the wall over the next few weeks. And that is exactly what has been happening.

That is, until we reach a certain point in both Time and Price. Most importantly TIME. When we do, the market will deliver a jaw dropping move. It could be up or it could be down. I am simply not willing to release that information here. However, if you wish to know the timing and the direction, please Click Here. 

February Chart

his conclusion is further supported by my mathematical and timing work. It clearly shows a severe bear market between 2015-2017. In fact, when it starts it will very quickly retrace most of the gains accrued over the last few years.  If you would be interested in learning when the bear market of 2015-2017 will start (to the day) and its internal composition, please CLICK HERE.

(***Please NoteA bear market might have started already, I am simply not disclosing this information. Due to my obligations to my Subscribers I am unable to provide you with more exact forecasts. In fact, I am being “Wishy Washy” at best with my FREE daily updates here. If you would be interested in exact forecasts, dates, times and precise daily coverage, please Click Here). Daily Stock Market Update. February 25th, 2016  InvestWithAlex.com

Did you enjoy this article? If so, please share our blog with your friends as we try to get traction. Gratitude!!!

Shocking: Here Is Why The Market Is Rallying   Google

Market Confusion Index Hits An All Time High

Daily Chart AFebruary 22 InvestWithAlex

2/22/2016 – A positive day with the Dow Jones up 225 points (+1.37%) and the Nasdaq up 66 points (+1.47%) 

Make any sort of a declaration or a market statement today, and chances are, you can make a nearly bulletproof case that you are right. Let me show you what I mean…..

And that’s just a small sample from today.

In other words, if your Charles Schwab financial adviser is telling you that he knows where the market is going, well, he is probably lying through his teeth.

That is why fundamental analysis becomes absolutely worthless in a complex market environment we are experiencing today. And even though both bulls and bears might eventually be right, it is the sequence of events that will determine what the market will do next. A better approach is needed.

A TIMING approach.  I have been publishing the chart below over the last few weeks with the following explanation.

We remain in a very complex market environment. Here is the chart I presented to you almost two weeks ago. Suggesting at the time that the market will remain within a certain trading range until the structure below (sphere) completes itself on a certain date and price. When it does, a powerful directional move will start. If you would like to find out when that PRICE/TIME arrives (to the day) and where the market will push next, please Click Here. 

February Chart

This conclusion is further supported by my mathematical and timing work. It clearly shows a severe bear market between 2015-2017. In fact, when it starts it will very quickly retrace most of the gains accrued over the last few years.  If you would be interested in learning when the bear market of 2015-2017 will start (to the day) and its internal composition, please CLICK HERE.

(***Please NoteA bear market might have started already, I am simply not disclosing this information. Due to my obligations to my Subscribers I am unable to provide you with more exact forecasts. In fact, I am being “Wishy Washy” at best with my FREE daily updates here. If you would be interested in exact forecasts, dates, times and precise daily coverage, please Click Here). Daily Stock Market Update. February 22th, 2016  InvestWithAlex.com

Did you enjoy this article? If so, please share our blog with your friends as we try to get traction. Gratitude!!!

Market Confusion Index Hits An All Time High Google

Is Janet Yellen Being Tested?

Daily Chart AFebruary 18 InvestWithAlex

2/18/2016 – A negative day with the Dow Jones down 41 points (-0.26%) and the Nasdaq down 46 points (-1.03%)

Here is something that I haven’t seen anyone cover. Basically, every FED Chairman since Paul Volcker, and to a certain extent before, has been baptized by fire of a large scale market sell-off. Let me give you an example.

  • Paul  (The Iron Will) Volcker: Took office in August of 1979. Last down leg of a 1966-1982 bear market started in April of 1981. Baptized by fire 1.5 years into his tenure.
  • Alan (The Master Printer) Greenspan: Took office in August of 1987. Baptized by fire just two months later, when the crash of 1987 took place.
  • Ben (The Savior) Bernanke: Took office in February of 2006. The 2007-2009 bear leg started in October of 2007. Baptized by fire 1.75 years into his tenure.
  • Janet (Everything is Peachy) Yellen: Took office in February of 2014. Now exactly two years into her tenure.

I am sorry to tell you this Ms.Yellen, but if the trend above holds true, you are about to get creamed along with every other bull out there.

Not only that, it appears that Ms. Yellen’s test might have actually started last year and right on schedule (1.5 years into her tenure).

This conclusion is further supported by my mathematical and timing work. It clearly shows a severe bear market between 2015-2017. In fact, when it starts it will very quickly retrace most of the gains accrued over the last few years.  If you would be interested in learning when the bear market of 2015-2017 will start (to the day) and its internal composition, please CLICK HERE.

(***Please NoteA bear market might have started already, I am simply not disclosing this information. Due to my obligations to my Subscribers I am unable to provide you with more exact forecasts. In fact, I am being “Wishy Washy” at best with my FREE daily updates here. If you would be interested in exact forecasts, dates, times and precise daily coverage, please Click Here). Daily Stock Market Update. February 18th, 2016  InvestWithAlex.com

Did you enjoy this article? If so, please share our blog with your friends as we try to get traction. Gratitude!!!

Is Janet Yellen Being Tested?  Google

What You Ought To Know About “Buying The Dip” Here

Daily Chart AFebruary 17 InvestWithAlex

2/17/2016 – Another positive day with the Dow Jones up 257 points (+1.59%) and the Nasdaq up 98 points (+2.21%)

What a difference a few trading days make. Last Wednesday, or right before an important bottom, I wrote the following. Financial Media Predicts Armageddon – Time To Go Long?

Open any financial media outlet and you will be hard pressed to find anything positive. So much so that quite a few prominent market “pundits” are calling for an outright financial Armageddon. Soup lines in tow.

Today, bottom callers are once again out in force. For instance, Cramer: Bullish signals to spot a raging buy  Although, even though the market is now overbought, the sentiment is not as bullish as it was at the end of December or right before the most recent market collapse.

What does all of that mean? 

We remain in a very complex market environment. Here is the chart I presented to you almost two weeks ago. Suggesting at the time that the market will remain within a certain trading range until the structure below (sphere) completes itself on a certain date and price. When it does, a powerful directional move will start. If you would like to find out when that PRICE/TIME arrives (to the day) and where the market will push next, please Click Here. 

February Chart

Now, here is a very good technical take on today’s market. I would have to agree with most things Mr.Griffiths talks about.

This conclusion is further supported by my mathematical and timing work. It clearly shows a severe bear market between 2015-2017. In fact, when it starts it will very quickly retrace most of the gains accrued over the last few years.  If you would be interested in learning when the bear market of 2015-2017 will start (to the day) and its internal composition, please CLICK HERE.

(***Please NoteA bear market might have started already, I am simply not disclosing this information. Due to my obligations to my Subscribers I am unable to provide you with more exact forecasts. In fact, I am being “Wishy Washy” at best with my FREE daily updates here. If you would be interested in exact forecasts, dates, times and precise daily coverage, please Click Here). Daily Stock Market Update. February 17th, 2016  InvestWithAlex.com

Did you enjoy this article? If so, please share our blog with your friends as we try to get traction. Gratitude!!!

What You Ought To Know About “Buying The Dip” Here  Google

Is It Possible We Are Still In A Bull Market?

Daily Chart AFebruary 4 InvestWithAlex

2/4/2016 – A positive day with the Dow Jones up 78 points (+0.48%) and the Nasdaq up 5 points (+0.12%) 

Until the recent “China driven” sell-off, mainstream financial media was bursting at the seams with all sorts of bullish articles. Here is one of them.

“It’s not old age, it’s excesses. And we’re not seeing excesses, we’re not overspending, we’re not over buying, we’re not over borrowing, we’re not over leveraged, and we’re not overvalued,” added White on why the bull market will not die in 2016.

I strongly disagree with all of the above, but let’s save it for another time. Basically the bulls are playing the game of musical chairs by expecting a clear blow off top at even more ridiculous valuation levels. Yet, no one is asking the most important question.

What if the music is no longer playing?

I remember shorting stocks into May 19th, 2015 top on the Dow/S&P.  Let me assure you, it sure the hell felt like a blow off top to me. Not that much dissimilar from 2000 and 2007 tops. You couldn’t find a bear if your life depended on it (except yours truly). Even prominent bears like Marc Faber and Peter Schiff were throwing in the towel. And when the Nasdaq was putting in a top on July 20th, I posted the following sentiment picture on this blog.

investment grin of the day 73 investwithaelx

So, let me ask you again, is it possible that most bulls are waiting for a top that has already arrived?

That is exactly what I discuss in my last weekly update to my premium subscribers Click Here. And as you can very well understand, the right answer can make all the difference between being trapped in another massive leg down or moving harmoniously with the overall market.

This conclusion is further supported by my mathematical and timing work. It clearly shows a severe bear market between 2015-2017. In fact, when it starts it will very quickly retrace most of the gains accrued over the last few years.  If you would be interested in learning when the bear market of 2015-2017 will start (to the day) and its internal composition, please CLICK HERE.

(***Please Note: A bear market might have started already, I am simply not disclosing this information. Due to my obligations to my Subscribers I am unable to provide you with more exact forecasts. In fact, I am being “Wishy Washy” at best with my FREE daily updates here. If you would be interested in exact forecasts, dates, times and precise daily coverage, please Click Here). Daily Stock Market Update. February 4th, 2016  InvestWithAlex.com

Did you enjoy this article? If so, please share our blog with your friends as we try to get traction. Gratitude!!!

Is It Possible We Are Still In A Bull Market?  Google

Bottom Callers Are Out In Force – Bearish?

Daily Chart AFebruary 1 InvestWithAlex

2/1/2015 – A mixed day with the Dow Jones down 17 points (-0.10%) and the Nasdaq up 6 points (+0.14%) 

The Dow is up a miserly 1,000 points since its bottom on January 20th,  but all sorts of bottom calling creatures are out in force. For instance….

“If China suffers a hard landing — we don’t expect that — but if it does, it will impact other emerging markets,” he said. “And when you look at other emerging markets, along with China, that can spill over not only to the United States, but to the rest of the global economy.For that reason, Chan puts the chances of a U.S. recession at roughly 25 percent.

I am just curious about where they were when I was calling and/or looking for a bottom….Should Investors Be Panicking Right About Now? (published on January 20th)

I am literally dumbfounded by how blind or how much in denial these people are. I predicted this recession two years ago. It is a simple matter of QE, interest rates and credit velocity. As soon as it is withdrawn, even at the margins, this Ponzi economy perpetuated by easy credit will collapse. It as simple as that.

Further, let me ask you a few simple questions. If the US Economy is doing so well, why has the Baltic Dry Index collapsed? Hitting its historic lows daily now. Why is the yield curve is as flat as a pancake and nearing inversion? Why has oil collapsed? Why was forward earnings guidance down 2% (biggest adjustment down since 2008) in Q-3?

Are we expected to believe that this is a mid-cycle slowdown? If so, please enlighten me, just what will propel us forward?

But here is the scariest part of all. The stock market hasn’t yet reacted to any of the above and/or readjusted. As I have mentioned at least a thousand times by now, the market is sitting at the 4th highest valuation level in history. According to Shiller’s Adjusted S&P P/E Ration. Right behind 1929, 2000 and 2007 tops.

And it shouldn’t take a genius to figure out what happens next. In fact, a proper investment allocation here should be as easy as it would be for Bernie Madoff to steal girl scout cookies on a Sunday afternoon.

This conclusion is further supported by my mathematical and timing work. It clearly shows a severe bear market between 2015-2017. In fact, when it starts it will very quickly retrace most of the gains accrued over the last few years.  If you would be interested in learning when the bear market of 2015-2017 will start (to the day) and its internal composition, please CLICK HERE.

(***Please Note: A bear market might have started already, I am simply not disclosing this information. Due to my obligations to my Subscribers I am unable to provide you with more exact forecasts. In fact, I am being “Wishy Washy” at best with my FREE daily updates here. If you would be interested in exact forecasts, dates, times and precise daily coverage, please Click Here). Daily Stock Market Update. February 1st, 2016  InvestWithAlex.com

Did you enjoy this article? If so, please share our blog with your friends as we try to get traction. Gratitude!!!

Bottom Callers Are Out In Force – Bearish? Google

Cash Holders Are Fools…..

Daily Chart AJanuary 25 InvestWithAlex

1/25/2015 – A negative day with the Dow Jones down 209 points (-1.30%) and the Nasdaq down 73 points (-1.58%) 

At least according to mainstream media and numerous financial pundits. Case and point…..

“The global financial crisis created such a high level of risk aversion that people didn’t just wait for the start of the rebound. In some cases, they waited for years,” said Kristina Hooper, U.S. investment strategist at Allianz Global Investors. “I can’t tell you how many investors I came across in 2011, 2012 and even 2013 who had missed out on a lot of the comeback in the stock market and were still sitting in cash.”

Fair enough, but there is another side to the story. Cash has been one of the best performing assets since 2000 top.  Let’s run a simple calculation. In January of 2000 (major top on the Dow), both the 10-Year Note and the 30-Year Bond were yielding around 6%. Flat yield curve at the time – forecasting recession.

Now, lets take $100,000 and compound it at 6% for 15 years. I get $239,655 or a return of roughly 140% (not considering taxes here). Most importantly, don’t forget, the return above is essentially risk free.

And what did the stock market do during this time?  Boy am I glad you have asked.

  • Nasdaq: -10% from 2000 top.
  • Dow: Up 35% since January 18th, 2000 top (About 2% annualized return)
  • S&P: Up 28% since 2000 top. (About 1.7% annualized gain).

But I am not done yet. Feast your eyes on this S&P inflation adjusted chart.

S&P inflation adjusted

Yes, as of May 2015 top, inflation adjusted S&P has returned nothing. Zilch, nada, zero. Same story with the Dow. Nasdaq is still down 30% – inflation adjusted that is.

But I am not done yet. I continue to maintain that today’s market is selling at incredible valuations levels and about to correct in a major way. When it hits bottom again, I fathom that the cash above will outperform the market by a factor of 10x. Inflation adjusted or not.

In other words, while your stock market return will be negative since 2000 top, you could have at least doubled your money in a risk free fashion if you held US Treasury Bonds/Notes during the same time. I understand the yields above are no longer available, but we have compare apples to apples here. Meaning, the same initiation date of January 2000.

So, the next time financial advisers tell you that it’s a fools game to hold cash, pushing you towards the always “undervalued” stock market, show them the chart above and tell them to go pound sand.

This conclusion is further supported by my mathematical and timing work. It clearly shows a severe bear market between 2015-2017. In fact, when it starts it will very quickly retrace most of the gains accrued over the last few years.  If you would be interested in learning when the bear market of 2015-2017 will start (to the day) and its internal composition, please CLICK HERE.

(***Please NoteA bear market might have started already, I am simply not disclosing this information. Due to my obligations to my Subscribers I am unable to provide you with more exact forecasts. In fact, I am being “Wishy Washy” at best with my FREE daily updates here. If you would be interested in exact forecasts, dates, times and precise daily coverage, please Click Here). Daily Stock Market Update.January 25th 2016  InvestWithAlex.com

Did you enjoy this article? If so, please share our blog with your friends as we try to get traction. Gratitude!!!

Cash Holders Are Fools…..Google

Shocking: Here Is Exactly Where The Market Will Bottom

Daily Chart AJanuary 21 InvestWithAlex

1/21/2016 – A positive day with the Dow Jones up 113 points (+0.72%) and the Nasdaq up 1 point (+0.01%)

I was incredibly excited when I first saw this article.

Finally, someone else who knows exactly where this “bear market” will end. Instead, the author deflated it with the following whimper…..

The selloff will end when investors feel prices have fallen by enough to account for whatever bad news might still be lurking, undiscovered. The problem is that nobody knows with precision how much asset prices need to correct. “Rarely do financial markets find the fair value that’s fundamentally justified, and stop,” says Jeffrey Rosenberg, a managing director at money manager BlackRock (BLK). “They overshoot. It’s really hard to say whether we’re at fair value, or we’ve overshot.”

And five times five is twenty five. But I would have to disagree with this earth-shattering revelation. It IS possible to predict and to know. That is exactly what my mathematical and timing work does.

For instance, in October and November of 2015 I told my subscribers that the Dow was looking for a lower low (below May of 2015). And that once that low is in and confirmed, we would know, with a high degree of certainty, exactly WHERE and WHEN the Dow will bottom. To the day and to the point.

And as buffoonish as it may sound, I stand by that statement. Not only do I stand by it, I am currently looking at the said calculation projecting the market into an exact bottom. One thing is clear. If it is correct, and I  am confident that it is, crocodile tears will soon flood the neighborhood of where the wall meets the street.  Click Here to learn more.

And those who proclaim the impossibility of the above should understand the following.

But it certainly casts a cloud over any bargain hunting. And note that these numbers only measure how far the market would have to fall to reach average levels. They do not reflect what would happen if the market did what it has done frequently in the past, and plunged back down to very cheap levels. Maybe that will never happen. Let’s hope. Because when you factor in those numbers, it’s a long way down.

Precisely. Despite the recent sell-off, today’s stock market is still incredibly overpriced. And I don’t care if your Charles Schwab financial adviser disagrees. Today’s stock market is the 4th most expensive in history. Right behind 1929, 2000 and 2007 tops. I have covered this fact on this blog extensively…..here is just a small sample Is Our Overvaluation Premise Wrong?

This conclusion is further supported by my mathematical and timing work. It clearly shows a severe bear market between 2015-2017. In fact, when it starts it will very quickly retrace most of the gains accrued over the last few years.  If you would be interested in learning when the bear market of 2015-2017 will start (to the day) and its internal composition, please CLICK HERE.

(***Please Note: A bear market might have started already, I am simply not disclosing this information. Due to my obligations to my Subscribers I am unable to provide you with more exact forecasts. In fact, I am being “Wishy Washy” at best with my FREE daily updates here. If you would be interested in exact forecasts, dates, times and precise daily coverage, please Click Here). Daily Stock Market Update.January 21st, 2016  InvestWithAlex.com

Did you enjoy this article? If so, please share our blog with your friends as we try to get traction. Gratitude!!!

Shocking: Here Is Exactly Where The Market Will Bottom  Google