Why Most Stock Market Bears Will Be Disappointed.

Fedreservestockchart-investwithalex

If you pay attention to today’s bearish community and to the likes of Elliotwave.com or Zerohedge.com you would walk away with a perception that the Dow Jones is going to 1,000 or lower. In fact, according to them you would be better off stock pilling guns, ammo and canned food. If you have the same point of view, I am sorry, but you will lose a lot of money over the next few years.  

Yes, our incredibly accurate timing and mathematical work confirms that there will be a bear market over the next few years. Between 2014-2017 to be exact. Yet, it will not be as severe as the bears would like you to believe. In fact, it won’t be half as severe as the bear market leg between 2007-09. Now, most of the Perma Bear will dismiss this notion as nonsense. They want the market to collapse and they won’t be happy until we see a 1929 type of a crash. Yet, it a dangerous delusion that will cost them a lot of money. Just as it did over the last 5-Years when the stock market completely annihilated all of their short positions.   

Instead, if you would like to know exactly when the bear market of 2014-2017 will start and it’s exact internal composition (forecastered to the day), please check out our work on this site….. Click Here. 

Did you enjoy this article? If so, please share our blog with your friends as we try to get traction. Gratitude!!!


Click here to subscribe to my mailing list


Why Most Stock Market Bears Will Be Disappointed  Google

Unprofitable IPOs Don’t Scare Investors…Great

As WSJ reports, 74% of all IPO’s today are not making any money and/or are not profitable. Guess when that happened before?  That’s right, right before the 2000 Nasdaq collapse. 

But don’t worry. It’s different this time. After all, the investors are “NOT Scared” this time around….whatever that means.  This is just another indication that the bear market is about to start and destroy bulls. Particularly, those playing in the IPO market. Earlier today I posted a good “Short List” that should get you started. 

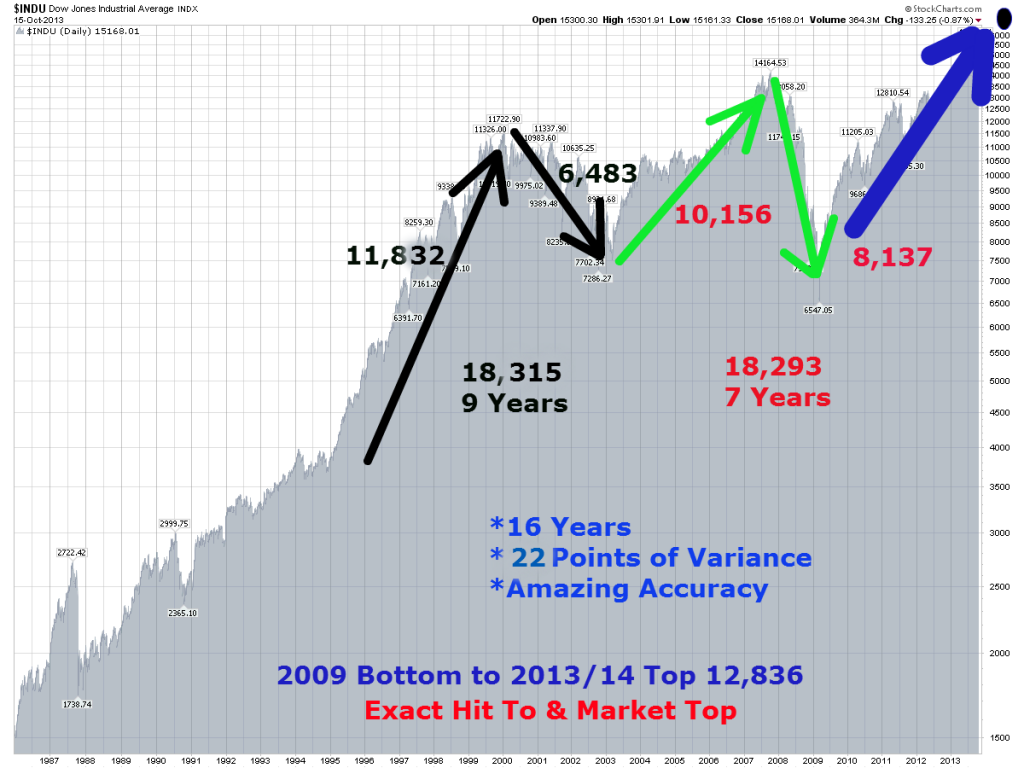
Since January of this year I have argued that the Dow Jones topped out on December 31st 2013 at 16,588. We continue to maintain this position as it is based on our precise mathematical and timing work. With the Dow pushing this level again, it is up to you to figure out what happens next. However, if you would like an exact breakdown and bear market composition of (2014-2017) please Click Here.  

ipo investwithalex

Did you enjoy this article? If so, please share our blog with your friends as we try to get traction. Gratitude!!!


Click here to subscribe to my mailing list


Unprofitable IPOs Don’t Scare Investors…Great Google

A hot IPO market isn’t necessarily an optimistic development for the aging bull market.

Companies are going public at a pace reminiscent of the 1990s Internet heyday, a positive sign for young companies aiming to cash in on the rallying stock market. But analysts say the underlying mix of companies rushing to go public represents a warning sign for the stock rally.

Some 74% of companies that went public over the past six months weren’t profitable, the highest level since March 2000 when about four out of five new companies were money-losers, according to Jason Goepfert, founder of Sundial Capital Research and author of the SentimenTrader Daily Report. That same month, the Nasdaq Composite peaked before tumbling into a deep bear market as the dot-com bubble burst.

Since 1990, 42% of companies that have gone public, on average, haven’t been profitable, Mr. Goepfert says. In the early-to-mid 1990s less than 1/3 of these companies didn’t generate profits. This percentage rose through the tech bubble, fell afterward and rose again through the 2007 market peak before tumbling to as low as 15% in October 2009, seven months after the bear-market bottom.

In the past several years the percentage of unprofitable companies going public has hovered predominantly between 55% and 65%. It moved back above 70% early last month.

“This kind of behavior is troubling,” Mr. Goepfert said. “Not only do we have a willing public market ready to provide capital to these companies, but in many cases these are instances of professional investors selling their claims to a less-sophisticated public,” he added.

The list of newly minted money-losing public companies in the past six months includes microblogging platform Twitter Inc. and cybersecurity firm FireEye Inc.FEYE -0.08%Twitter shares have more than doubled off the IPO price; FireEye has more than quadrupled.

Investors don’t seem too perturbed by the trend. If anything, recent IPOs boast better returns than the broader market. The average U.S. IPO this year rose 19% from its debut through Feb. 28, and 5% from where it closed after its first day of trading, according to Dealogic. The S&P 500 index, meanwhile, has edged only slightly higher for the year.

To be sure, the IPO market has a long way to go before reaching tech-bubble levels. In the first two months of this year, 42 companies went public in the U.S., compared to 77 in the same period in 2000, according to Dealogic.

That’s why many stock investors aren’t willing to turn bearish right now.

In his weekly commentary, BlackRock strategist Russ Koesterich didn’t sound enamored with stocks, but he still considered them to be better than other alternatives.

“To start, we would say equities are no longer cheap and that stronger economic growth will be needed to drive earnings and prices higher,” he said. “But we do believe stock prices are more likely to head higher rather than lower from here,” Mr. Koesterich added, while cash investments “are effectively paying nothing, and traditional areas of the bond market offer little return after factoring in the effects of inflation and taxes.”

Even with a pricey stock market and an increasingly frothy IPO market, the fact that inflation and interest rates are low and the economy is gradually improving offers “sound arguments for overweighting stocks,” he says.

Morning MoneyBeat Daily Factoid: On this day in 1888, a brutal blizzard smacked the Northeast, resulting in a shutdown of communication and transportation lines along the U.S. Atlantic Seaboard. More than 400 people died from the storm.

Yes, Keep Buying This Market, If You Like Losing Money

Bullish articles on the market at this stage of the game, really get me going.  “It’s full steam ahead….We are just getting started.”

What a bunch of BS.

Of course, you are free to listen to this nonsense, but keep one thing in mind. Our mathematical and timing work shows that the bull market is nearly over and the bear market is just starting. Over the next three years, the bear market of 2014-2017 will take the market much, much lower. When its all said and done investors who are buying today will lose a substantial portion of their capital.  You have been warned. 

Did you enjoy this article? If so, please share our blog with your friends as we try to get traction. Gratitude!!!


Click here to subscribe to my mailing list

Yes, Keep Buying This Market, If You Like Losing Money  Google

crazybull

American household net worth is at an all-time high, surpassing $80.66 trillion dollars, according to the Federal Reserve Bank’s latest “Z.1” release.

Of the $9.8 trillion added in 2013 alone, $2.19 trillion came from real estate while $3.85 trillion were added thanks in large part to a rising stock market; the benchmark S&P 500 index was up 29.6% in 2013, going up to 31.9% if dividends are added.

With equities being an important factor in household net worth accounting for one-sixth of total assets, will it continue to do so in the weeks and months ahead?

Andrew Busch, editor and publisher of The Busch Update, believes the market is headed higher and says the technicals for the S&P 500 prove it.

“I think what’s interesting about this move in the stock market is just how powerful it is,” says Busch. “With technical analysis, we’re always trying to figure out what patterns are out there so that we can trade off of them and make money.”

For Busch, one such pattern is that three of the S&P 500’s moving averages have been moving together well over a year now. Those moving averages are the 50-day, 100-day, and 200-day moving averages and they continued to stay more or less parallel despite the market drop in January.

“These three stack on top of each other,” says Busch, “with the top line 50, the middle one 100, and the bottom 200, meaning everything’s pointing up. Even the selloff in January couldn’t get the 50-day moving average to move below the 100.”

Busch also notes that whenever the S&P 500 would hit new highs over the past year, it would drop a little but always to a point higher than its previous drop.

“That also underscores how powerful this move up has been for stocks overall,” says Busch, who notes the January drop was to 1,773. “If we see a low below that level, then we change the pattern and then you want to start unloading some stocks. Until that happens, it’s full steam ahead.”

Chad Morganlander, portfolio manager at Sifel’s Washington Crossing Advisors, agrees with Busch’s bullish outlook on the S&P 500.

“We believe that the US equity markets for 2014 will be up perhaps 7% or 8%,” says Morganlander, who thinks the economy will show better-than-expected growth this year. “Our GDP forecast is for over 3% for 2014. And, what really drives the stock market – and, it’s about 90% correlated – is earnings. We believe S&P earnings for 2014 will be up roughly 7% to 8% and that ties into our price target.”

According to Morganlander, the economy’s growth is based on more credit, capital investment, and job creation. “We hit a pothole over the last several months,” says Morganlander, “but over the next several months, as we start to warm up and the great ‘Ice Age’ starts to melt, we’re going to start to better employment numbers and better employment data coming out.”

Happy Birthday Mr. Bull Market

z11

The Dow Jones bottomed on March 6th, 2009 at 6,469 in a trauma type of a bottom and then surged higher. It has been surging higher ever since. I remember that day very well. The talking heads on CNBC had this “deer in the headlights scared look” wondering if they should run out to buy guns and canned tuna.

I was looking for something else. My mathematical and timing work showed that the market would bottom on March 7th around 6,550. When it was all said and done I was 1 day and 100 points away. Good enough. 

Today, the situation is reversed. Instead of looking for the bottom we are looking for the top. While most market pundits, financial advisers and money managers expect this bull market to continue for the foreseeable future, I will leave you with this…..

1924-1929, 1932-1937, 1961-1966, 1982-1987, 1994-2000, 2002-2007 – all bull markets that terminated EXACTLY at 5 years. 

Will it be the same for our 2009-2014 bull market, are we at a turning point? 

Yes, we are. If you need more information and if you need to know the exact structure of the upcoming bear market (2014-2017) please Click Here.  

Did you enjoy this article? If so, please share our blog with your friends as we try to get traction. Gratitude!!!

Click here to subscribe to my mailing list


Happy Birthday Mr. Bull Market  Google

Investor Intelligence Reports: All Bears Are Dead. Massive Bear Market About To Start?

percent bears investwithalex

Most of the bears in the stock market have been dealt with. Over the last few years they have been taken behind the dumpster and shot. As the Investor Intelligence chart shows (see chart inside)the % of bears today stands at 15%. The lowest it has been since the survey started. That’s right, even lower than 2000 and 2007 tops. Does that mean the bear market is about to start?

The bear market has already started. As my mathematical and timing work indicated, the Dow topped out on December 31st, 2013, ushering in the bear market that will last between 2014-2017. Click on the Bear Market Report to see a comprehensive report on why, how & when. If you would like to learn more about the exact dates, prices and turning points within the composition of this upcoming bear market please check us out HERE 

Did you enjoy this article? If so, please share our blog with your friends as we try to get traction. Gratitude!!!

Click here to subscribe to my mailing list


Investor Intelligence Reports: All Bears Are Dead. Massive Bear Market About To Start? Google

Why The Market Top Is In and What You Should Do Next – Update

Long Term Dow Structure35

Update: 

The blog post below was published in January, warning readers that the bull market has topped out on December 31st, ushering in the next leg of the bear market. The bear market that will take us into the 2017 cyclical bear market bottom. Thus far, the market has performed just as anticipated. A substantial decline and a bounce.

However, with the Nasdaq hitting an all time high today, the question is…..is my forecast wrong?

No. Here is why. What you have to understand is that every single market and stock will have its own internal mathematical structure and it’s own rate of vibration. My mathematical work follows the Dow Jones in particular. As such, the market structure remains intact and just as we have been forecasting within our member section. In fact, an important turning point is coming up shortly, pushing and pulling the Dow towards the completion of secondary top in March of 2014. Something I have talked about on this blog a number of times.

Exactly when, where and what steps will the Dow take to get there? I highly encourage you to visit this site tomorrow in order to read our weekly update. I will answer most, if not all, of the questions.  

End Of Update…..

In my earlier blog posts I have mentioned that we had a cluster of very important turning points showing up around December 31st, 2013 and January 1st of 2014 (based on my cycle work). Indicating a significant turning point. 

Yet, my mathematical work at the time didn’t confirm. That is until Tuesday of this week. You can blame a simple brain fart or a lack of sleep on my part.  

I have shown the chart above before. To prove to you that the stock market is not random, but quite the opposite, it is exact. Showing you that there was only a 22 point variance over a 16 year period of time. Further, when we take the values on the chart above and do a few simple calculations we get a value of 12,935.

So what? 

Based on my calculations, the move between March 2009 bottom to December 31st, 2013 top on the DOW was exactly 12,836. That is an exact hit with 0.7% variance. With cycle work and mathematical confirmations coming together, I have no choice but to call for a market TOP.  

(***What calculation? You can learn more about it in my book “Timed Value” by getting two free chapters on timing HERE,  purchasing it on Amazon HERE or getting it as a free bonus HERE). 

Now, even though the market top is in, we have to wait for a technical confirmation before taking our short position. Based on my previous experience that is a prudent thing to do. 

What should you do next?

Option #1: If you are in stocks, start getting out and going into cash. Earning 2-5% annually is heck of a lot better than losing 30-40% over the next 3 years (the length of upcoming bear market). Plus, you will have money when the bottom comes to buy some wonderful companies at give away prices. 

Option #2: Profit on the short side. At the same, this will be a very difficult thing to do. The upcoming bear market is unlikely to be directional. My work shows that it will closely resemble the 2000-2003 bear market with a lot of ups and downs. As such, it will be difficult to make money on the short side.

The best advice I can give you is this. Protect and accumulate cash. Once we hit bottom in 2017, the market will start its 18 year bull market.  

Did you enjoy this article? If so, please share our blog with your friends as we try to get traction. Gratitude!!! 

Why The Market Top Is In and What You Should Do Next – Update  Google

Stock Market Update. InvestWithAlex.com. February 3rd, 2014

Daily Chart February 3, 2014Continue to maintain a LONG/HOLD position if invested -OR- be in CASH if not. 

2/3/2014 – Another ugly day for the market with the Dow Jones being down -326 points (-2.08%) and the Nasdaq being down  -107 points or (-2.61%).

Again, based on my mathematical work, this is not a correction. As my earlier post “Market Top” from two weeks ago outlined and explained, December 31st, 2013 was indeed the top of the bull market that started in March of 2009 and the beginning of the final bear market leg that will take us into the 2017 cyclical bear market bottom.

Even though the market continues to go down, we still need a confirmation before taking a short position. As such, I continue to anticipate the market to bounce into the March time frame before resuming its bear market. If you remember, the market left a number of open gaps in the 16,400 area that will “technically” need to be closed.

Short-Term Projections:

(***This is the only time I will provide short-term projections here. They will only be available in our premium section thereafter). 

My mathematical work shows two points of force coming in February. One coming up this Friday and the other one on February 17th.  Based on my mathematical work, I believe February 17th will be the bottom of this bear move, reversal and subsequent bounce into the March of 2014. If market confirms, we are looking at the 15,025 on the DOW  as our projected negative price target.

However, if the market gets there sooner, there is a good chance that this Friday will be a turning point. I will keep you posted. Either way, we have to wait for a confirmation before taking our long position.

Did you enjoy this article? If so, please share our blog with your friends as we try to get traction. Gratitude!!!      

Book Formlead Big

Stock Market Update. InvestWithAlex.com. February 3rd, 2014 Google

Why The Bear Market Is Already Here

CNBC Writes: ‘Huge amount of downside’ in S&P: Fleckenstein

bearmarket-investwithalex

Bill Fleckenstein is not ready to call the top for the market just yet. But pointing to the S&P 500‘s valuation, he says that once stocks do start to fall, the decline could prove extremely painful.

“The [price-to-earnings ratio] is 16, 17 times earnings,” Fleckenstein said on Tuesday’s episode of “Futures Now.” “Why would you pay 16 times for an S&P company? I don’t care about where rates are, because rates are artificially suppressed. Why isn’t that worth 11 or 12 times? Just by that analysis, you’d be down by a quarter or 30 percent. So there’s a huge amount of downside.”

For Fleckenstein, a noted short seller who is famous for making money in the 2008 crash, the Federal Reserve‘s quantitative easing program has led investors to badly misprice stocks.

The Fed “printing money does not make the economy work, but it sometimes makes stocks go wild,” Fleckenstein said. “The reason the stock market did well last year is because the Fed printed $1 trillion.”

Read The Rest Of The Article

Bill is right on the money and while he is not ready to call the top, I am. In one of my previous posts MARKET TOP, I have identified December 31st, 2013 as the top of the bull run from the 2009 bottom.

It has also been my premise all along that fundamentals no longer matter.  Not in terms of identifying some sort of a new stock market environment, but as of right now.  The fundaments do matter a great deal under “normal” circumstances, yet normal circumstances have been greatly distorted by massive infusion of credit into our financial system. 

Credit that drove our stock market prices beyond any reasonable valuation and well above 2000 and 2007 tops. Sure, earnings, P/E ratios and other metrics matter.  Yet, most metrics we revert to today have been distorted by the same credit infusion. Leading to higher earnings and corporate profits. The bottom line is, when credit collapses so will all other metrics.  Do not be fooled, all of this is nothing but an illusion.

As I have said so many times before, my mathematical work shows that we are in for a 3 year bear market that will take us into the 2017 cyclical bear market bottom that started in 2000. Do you need more information and exact price/time targets? My premium subscription service will be available next Monday.  

Did you enjoy this article? If so, please share our blog with your friends as we try to get traction. Gratitude!!!

Stock Market Update, InvestWithAlex.com, January 24, 2014

Daily Chart January 24 2014


Summary: Continue to maintain a LONG/HOLD position. 

1/24/2014 – A horrific day in the market today with the DOW being down -318 points or (-1.96%). While not the end of the world, it got people to pay attention. 

This type of a move is consistent with the beginning of a bear market. In my earlier blog post today, MARKET TOP, I have indicated that it is highly probable that the market topped out on December 31st, 2013. Both my mathematical and my cycle work confirm the conclusion. Now, the market gapped down again leaving another 100 point hole in the structure of the market. This indicates (at least to me) that while the long-term bull market has topped out, the market is likely to bounce into the 16,400 category to close the gaps before any sustained bear market move can take place. While I do anticipate further downside over the short-term, the market should bounce in order to give us a technical indication that the bear market is indeed here. 

I will have more details on this in my weekly update tomorrow. 

Did you enjoy this article? If so, please share our blog with your friends as we try to get traction. Gratitude!!!