
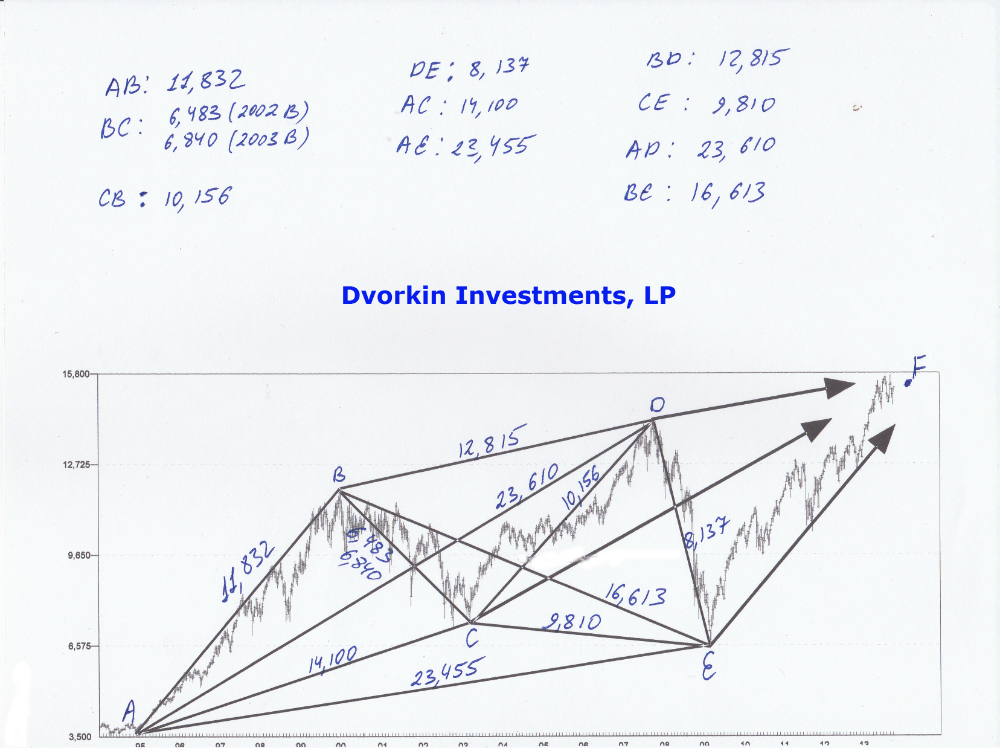
Once again the chart above represents 3-Dimensional movements within the stock market. The numbers above unify price and time into one number and are calculated as per Pythagorean Theorem formula given to you earlier.
While we have already looked at the number of these moves before let’s take a look at one more to cement our knowledge. Let’s take a look at the DE move as an example. During this bear market decline of 2007-2009, the market moved exactly 7809 points in exactly 2288 trading hours. When we apply our 3-Dimensional calculation we get a 3-DV of 8,137, which is the number you see on the chart. I highly encourage you to run every number on the chart above to confirm the numbers and to gain a better understanding.
Now, understand something very important. While the chart above is a long term chart representing the DOW between 1994-2013, it doesn’t have to be. The chart above could be the stock market chart over the last century or it could be a daily chart representing 2 hours of trading. The time frame doesn’t matter. The same rules of 3-Dimensional analysis apply to all time frames.
What are the rules?
Rule #1: By identifying 3-DV on the chart you know exactly what the next move will be. It will either be identical to the one preceding it or a derivative of it. Meaning that once you know what the DE on the chart is, you can predict with great accuracy what the EF move will be. To the day and to the point. That’s how accurate this work is. Much more on that later.
Rule #2: Make sure you know the time frame you are analyzing. If you are using a long term chart, as above, make sure you do not shift to the short term chart and anticipate the same size movements. For example, do not take DE 8,137 value and they try to find it on the daily chart. It will not work. You will only be able to find this value or the value of its derivative on the long term chart.
Rule #3: Always square price and time. When calculating your 3-DV make sure your time variable and your price variable are squared(match in size). In simple terms, at certain times you would have to shift your time variable between minutes, hours, days and month. Let me illustrate what I mean by showing you the right and the wrong way to do this.
Let’s assume for a second that you are looking at the chart above. Current market is a high energy, fast moving market. As such you have to use the hourly time frame to square the chart. It would be wrong to use any other TIME variable. Let’s take a look at the move labeled CD. Between 2003 bottom and 2007 top the market moved…
Price Move: 6,838 POINTS
Time Move: 7510 TRADING HOURS OR 1,155 TRADING DAYS -OR- 231 WEEKS -OR- 58 MONTH (there are 6.5 trading hours in 1 trading day)
If you want to generate a proper 3-DV measurement you have to use 7,510 trading hours as your primary TIME input. That input squares (matches) the price movement. If you were to use trading days or weeks or months, the PRICE portion of the formula would overwhelm the equation and you would end up with a worthless measurement that is not applicable to the stock market analysis. Let me show you what I mean.
To be continued……
Did you enjoy this article? If so, please share our blog with your friends as we try to get traction. Gratitude!!!