
Continuation of Part 8
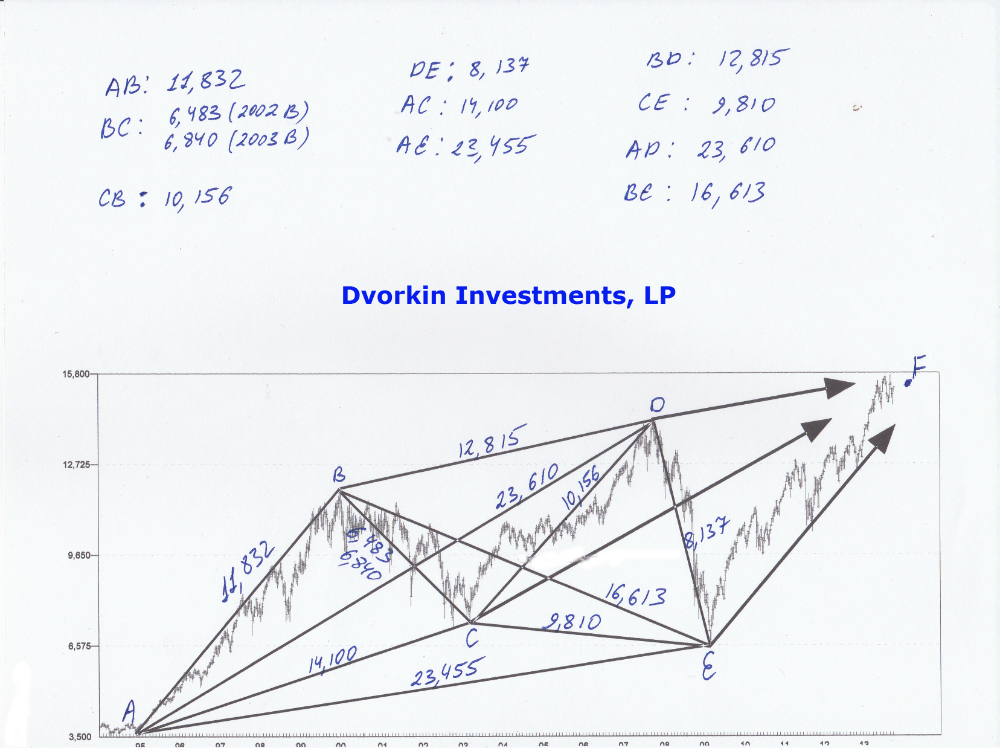
Let’s take a look at the real stock market example for clarification. Let see if we would have been able to identify point E on the chart by using triangulation. As discussed earlier, point E had 4 major 3-DVs associated with it.
1. AE, value of 23,455. Once again and as discussed earlier, this move was the derivative (square root of 5) of 9,922 move prior to 1994. The more than typical variance of the move was caused by the growth spiral in the market.
2. CE, value of 9,810. As shown earlier, this move was the derivative (square root of 2) of AC move of 14,100.
3. BE, value of 16,613. As discussed earlier, this move was the derivative (square root of 2) of AB move of 11,832.
4. DE, value of 8,137. From earlier discussion I have shown you that AB+BC=CD+DE=18,293. Therefore, by knowing CD, we would automatically know the value of DE (18,293-10,156)=8,137
To identify point E, well ahead of point E occurring, we would calculate where all of the 3-DVs above come together at one point. Well, a point that makes sense. After performing triangulation calculations and running the circumference of the circle for each 3-DV in question you would realize that they all come together in March of 2009.
In other words, they all intercept each other in March of 2009, between 6,750 and 6,250 on the DOW. Further, you would be able to get a visual confirmation that the market is indeed headed towards that same point of force you have identified through using triangulation.
In fact, this particular method has allowed me to confirm my other analysis and has allowed me to identify the March of 2009 bottom (between 6,750 and 6,250) as the highly probable turning point. I did that in October of 2008, when the DOW was still trading between 10,000-9,000. So, as everyone was losing their minds and predicting the next Great Depression or the end of the world, an analyst familiar with 3-Dimensional analysis would know that a significant turning point is coming up in March of 2009.
Not only that, but an investor familiar with this type of analysis would simple reverse from a short position to a long position at point E to attain maximum benefit. Once the confirmation that the point E was indeed the major turning point arrives, the investor is fully aware that the next BULL move will be a prolonged one. By reallocating capital from the short side to the long side at that instance, one is able achieves maximum profitability.
In summary, triangulation of 3-DVs allows you to find high probability turning points in 3-Dimensional space. It allows you to confirm the lattice structure if your lattice structure analysis has not advanced to the point of certainty. Further, by having multiple 3-DV’s intersect at the same point in the future, you have a fairly good idea of where the market is headed.
(Don’t forget that this applies on all time frames).
To Be Continued…..
Did you enjoy this article? If so, please share our blog with your friends as we try to get traction. Gratitude!!!
Stock Market And 3-Dimensional Analysis (Part 9)