
Continuation of part 5
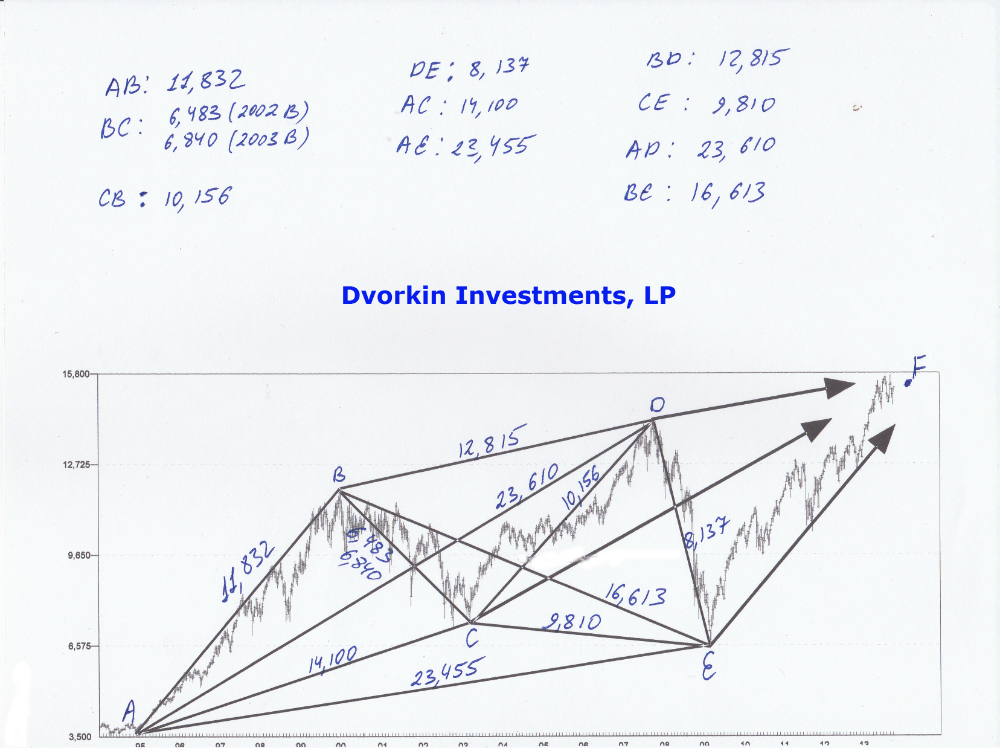
7. The move AB was an exact square and continuation of another 3-DV prior to 1994 bottom. This move was a perfect square. The market moved exactly 8,296 points in exactly 8,437 trading hours. Giving us a 3-DV of 11,832. This 3-DV was identical to the actual top set on January 14th, 2000 of 11,854. Proving, once again, how accurate this analysis can be.
8. Finally, the move BC was the derivative from the move AB. If you divide 11,832 by the square root of 3 you end up with a value of 6,831. With move BC having a 3-DV of 6,840, it gives us 0% variance. As 2003 secondary bottom was approaching an analyst using 3-DV analysis would be very well aware that a turning point was coming up. Using the techniques above the analyst would be about 10 trading points away from the actual bottom.
This concludes the analysis and explanation of the 3-DV moves above. The explanation above went over every single value and showed you how they can be used in order to predict the markets with great accuracy. Going further and by understanding the lattice structure within the market you would be able to know precise angles and directional moves of any upcoming market or individual stock moves. For the first time attaining the ability to predict the markets in both time and price. On any time frame. From daily resolution to decades from now.
This section is written on November 29th, 2013 with the DOW at 16,097
If you follow my daily blog you are very well aware that my mathematical work is predicting a severe bear market between 2014 and 2017. This bear market will represent the final leg down of the bear market that started in early 2000. This brings us to point F on the chart above and further explanation on how to predict exact turning points by using 3-DV analysis. Please keep in mind that point F represents the actual turning point in 2014 and the ushering in of the bear market leg. It hasn’t happened yet. We are predicting the future here. Let’s take a look.
Step #1: Measure 3-DV from all major turning points (E, D, C, B and A) to today’s DOW close. They are..
- EF: 12,364
- DF: 10,610
- CF: 20,190/20,900
- BF: 24,100
- AF: 34,750
Step #2: Calculate all derivative values for the numbers above.
To Be Continued…..
Did you enjoy this article? If so, please share our blog with your friends as we try to get traction. Gratitude!!!
Stock Market And 3-Dimensional Analysis (Part 6)