
Continuation of part 2
For simplicity sake, here is all you need to know. When we apply lattice structure thinking to the existing stock market structure, we soon realize that the most common derivatives are the 2x and the square roots of 2, 3 and 5. The next step in our analysis would be to calculate these derivatives for each one of our 3-DV determined above. We do so for both upside and downside by multiplying and dividing each value. The calculations are very simple.
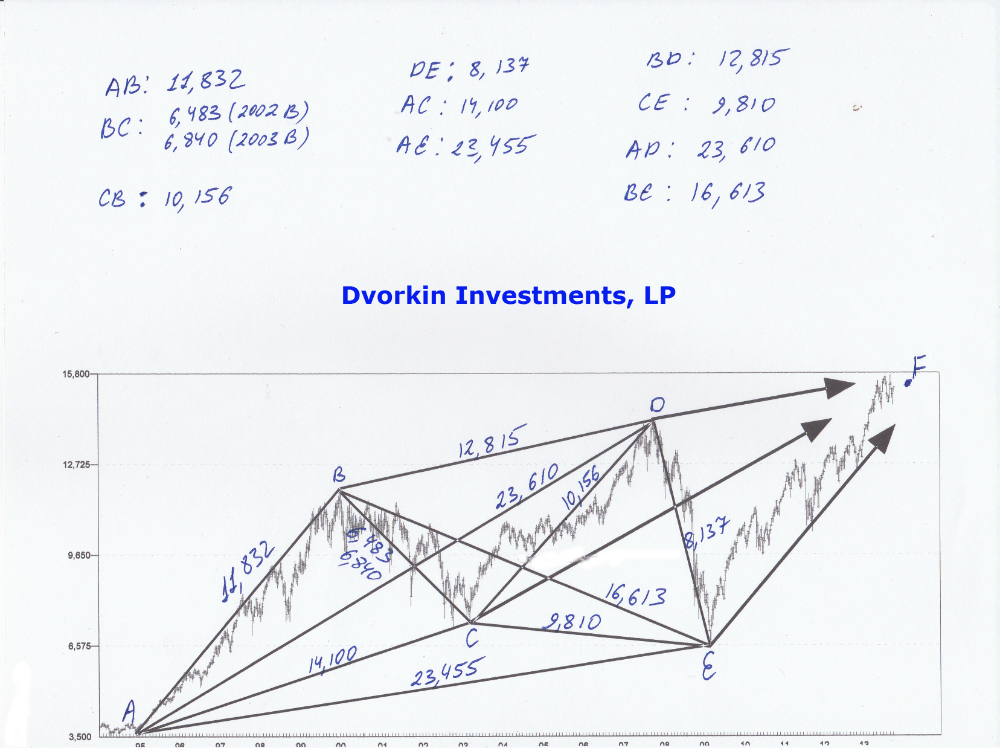
For example, lets figure out derivative for the move AC of 14,100
|
(ORIGINAL 3-DV 14,100) |
Multiply |
Divide |
|
SQRT 2 |
19,940 |
9,970 |
|
SQRT 3 |
24,421 |
8,140 |
|
SQRT 5 |
31,528 |
6,305 |
|
2X |
28,200 |
7,050 |
What do these numbers represent?
They represent all possibilities of the next move. Basically, we know that the next move (starting at point C) will either be 14,100 or the other 8 numbers representing the derivatives of the original number above. This helps us determine the next turning point with stunning accuracy. For instance, please note that the move CE (the move between 2003 bottom and 2009 bottom) was exactly 9,810 points. The square root of 2 derivative above stands at 9,970. This represents a 1.6% variance from the actual value. Fairly accurate if you ask me. Particularly if you know the exact structure and the direction of the move years before it happens.
Further, at the time of this writing (November 26th, 2013) the 3-DV of the move CF (2003 bottom to 2013/2014 top) is sitting at 20,050 and thus far has had an exact hit of 19,935 if you take 2013 September top into consideration. While I will not make exact predictions in this book, this gives you an indication of how powerful this 3-Dimensional analysis can be.
For example, in my other writings I have clearly indicated that the 2013/2014 tops will be the completion of the bull move that started at 2009 bottom. After the move completes itself we should experience a 3 year bear market that will take us into the 2017 bottom. As you now can see, by looking at the market through the 3-DV analysis we can predict with great accuracy when the top of 2013/2014 will take place. For example, just by looking at this one 14,100 3-DV alone (or its derivative of 19,940), we know that the market is toping right now and should reverse itself shortly.
To Be Continued…..
Did you enjoy this article? If so, please share our blog with your friends as we try to get traction. Gratitude!!!
Stock Market And 3-Dimensional Analysis (Part 2)