
If you would like to find out what the stock market will do next, in both price and time, please Click Here

If you would like to find out what the stock market will do next, in both price and time, please Click Here
Yet another perfect hit…….If you would recall, we posted the following forecast on July 11th, 2023.
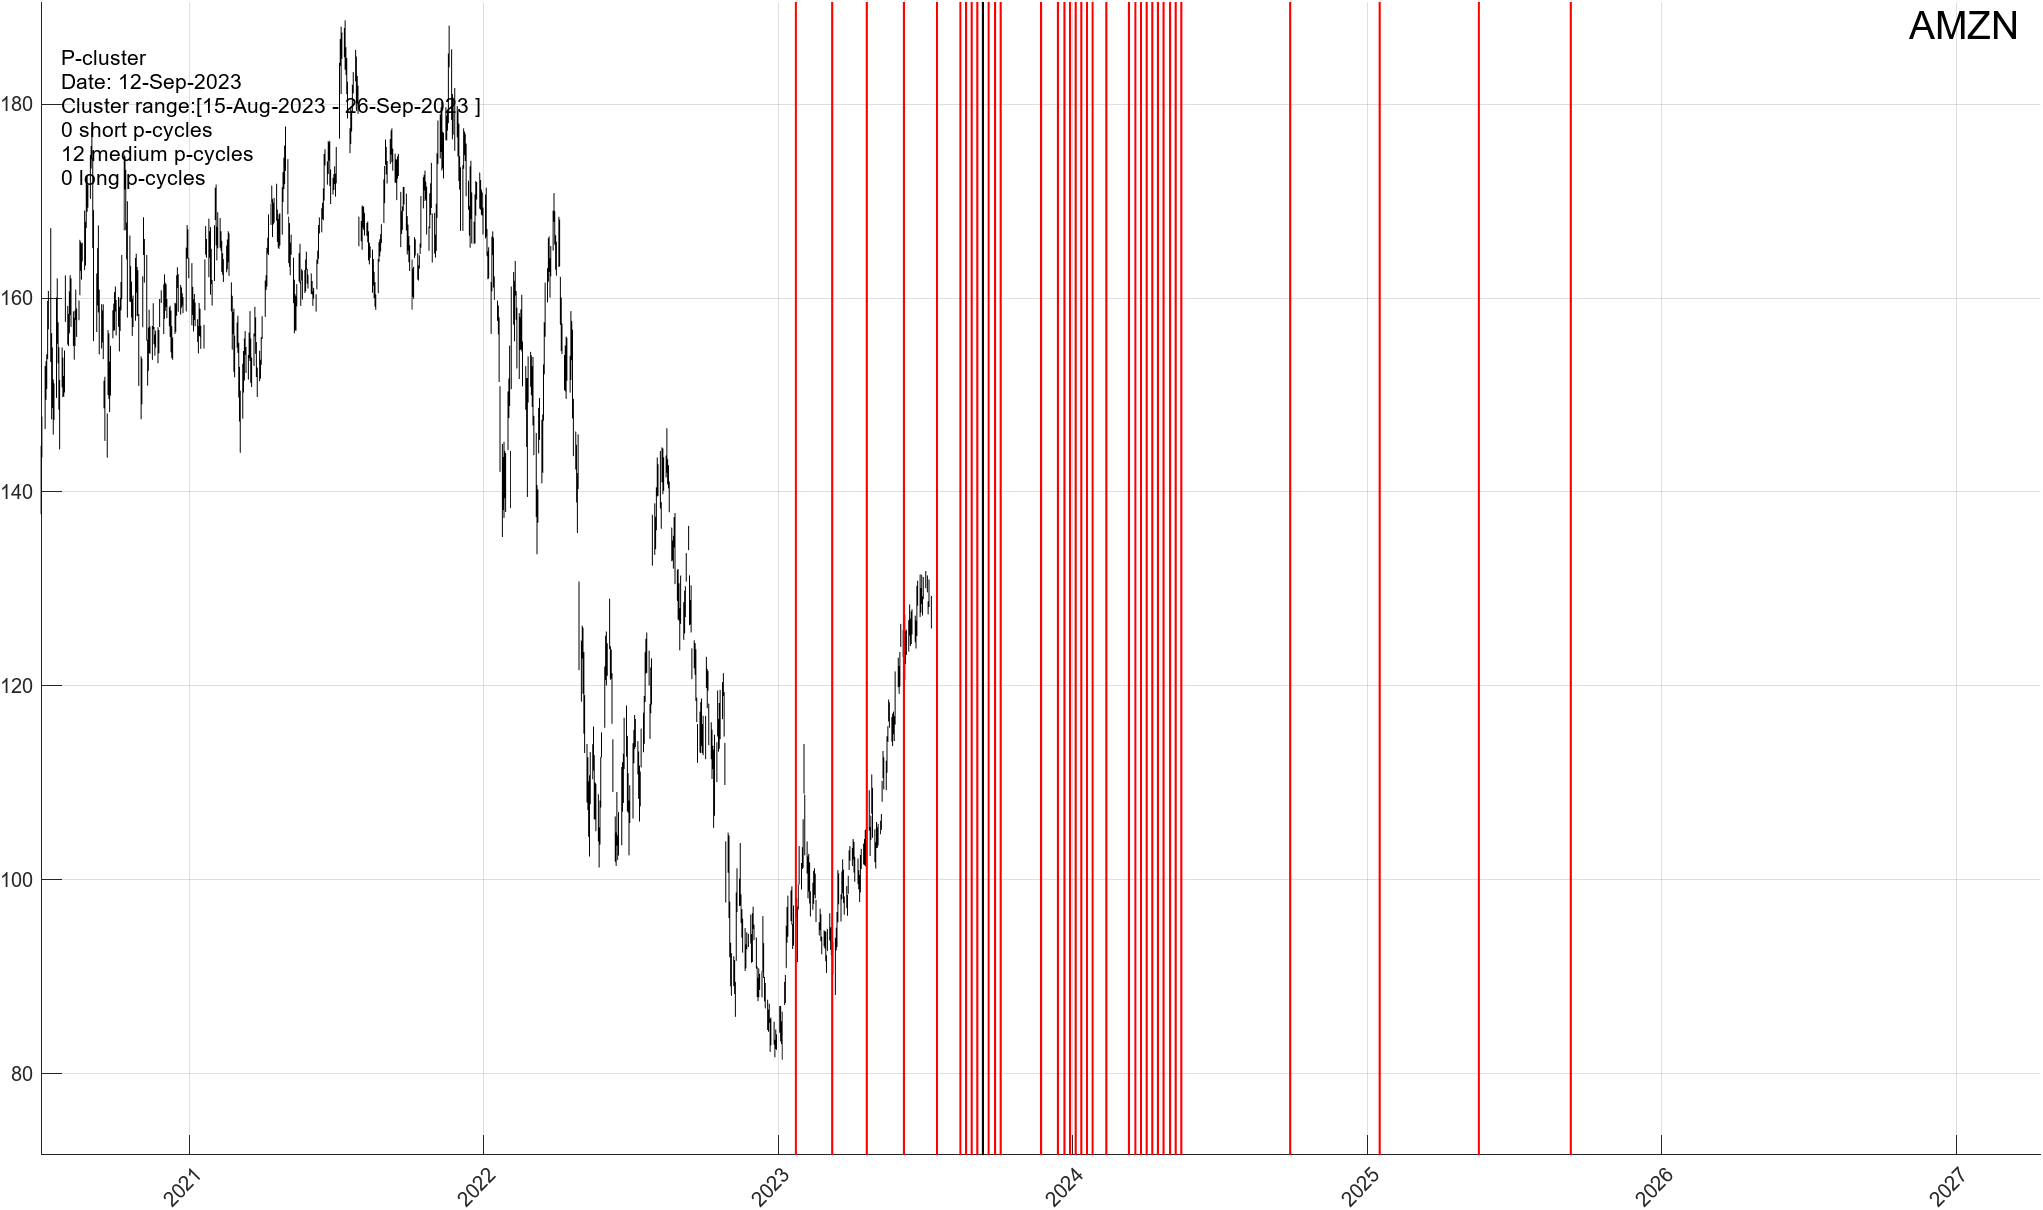
Analysis Update For Amazon (AMZN)
Date of Update: July 11th, 2023
Yet another direct hit from our prior analysis (see below).
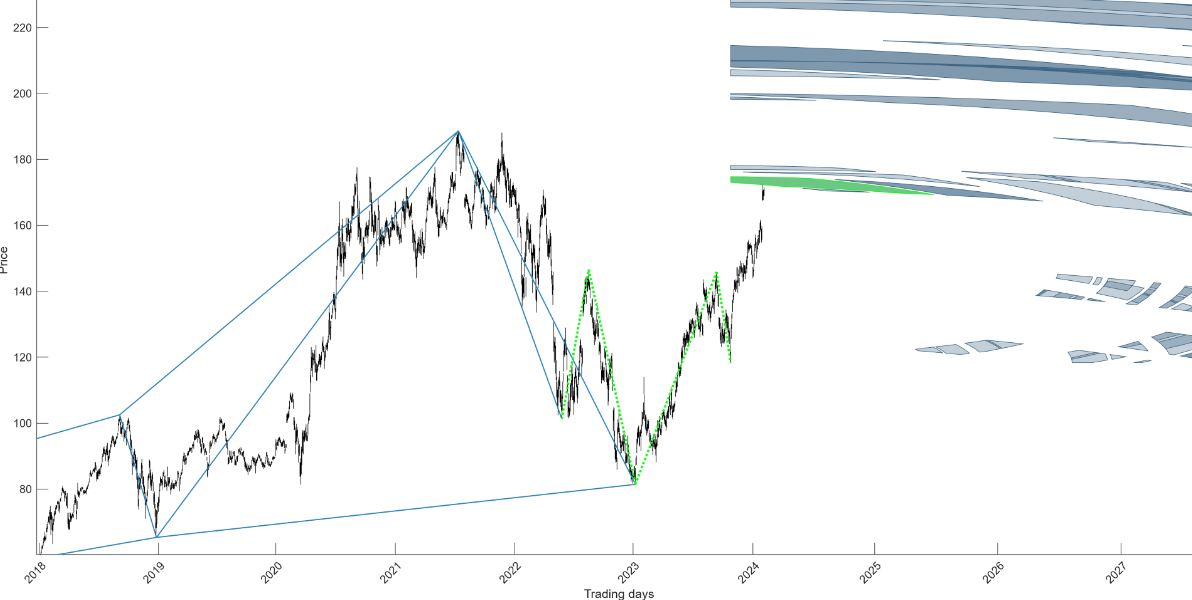
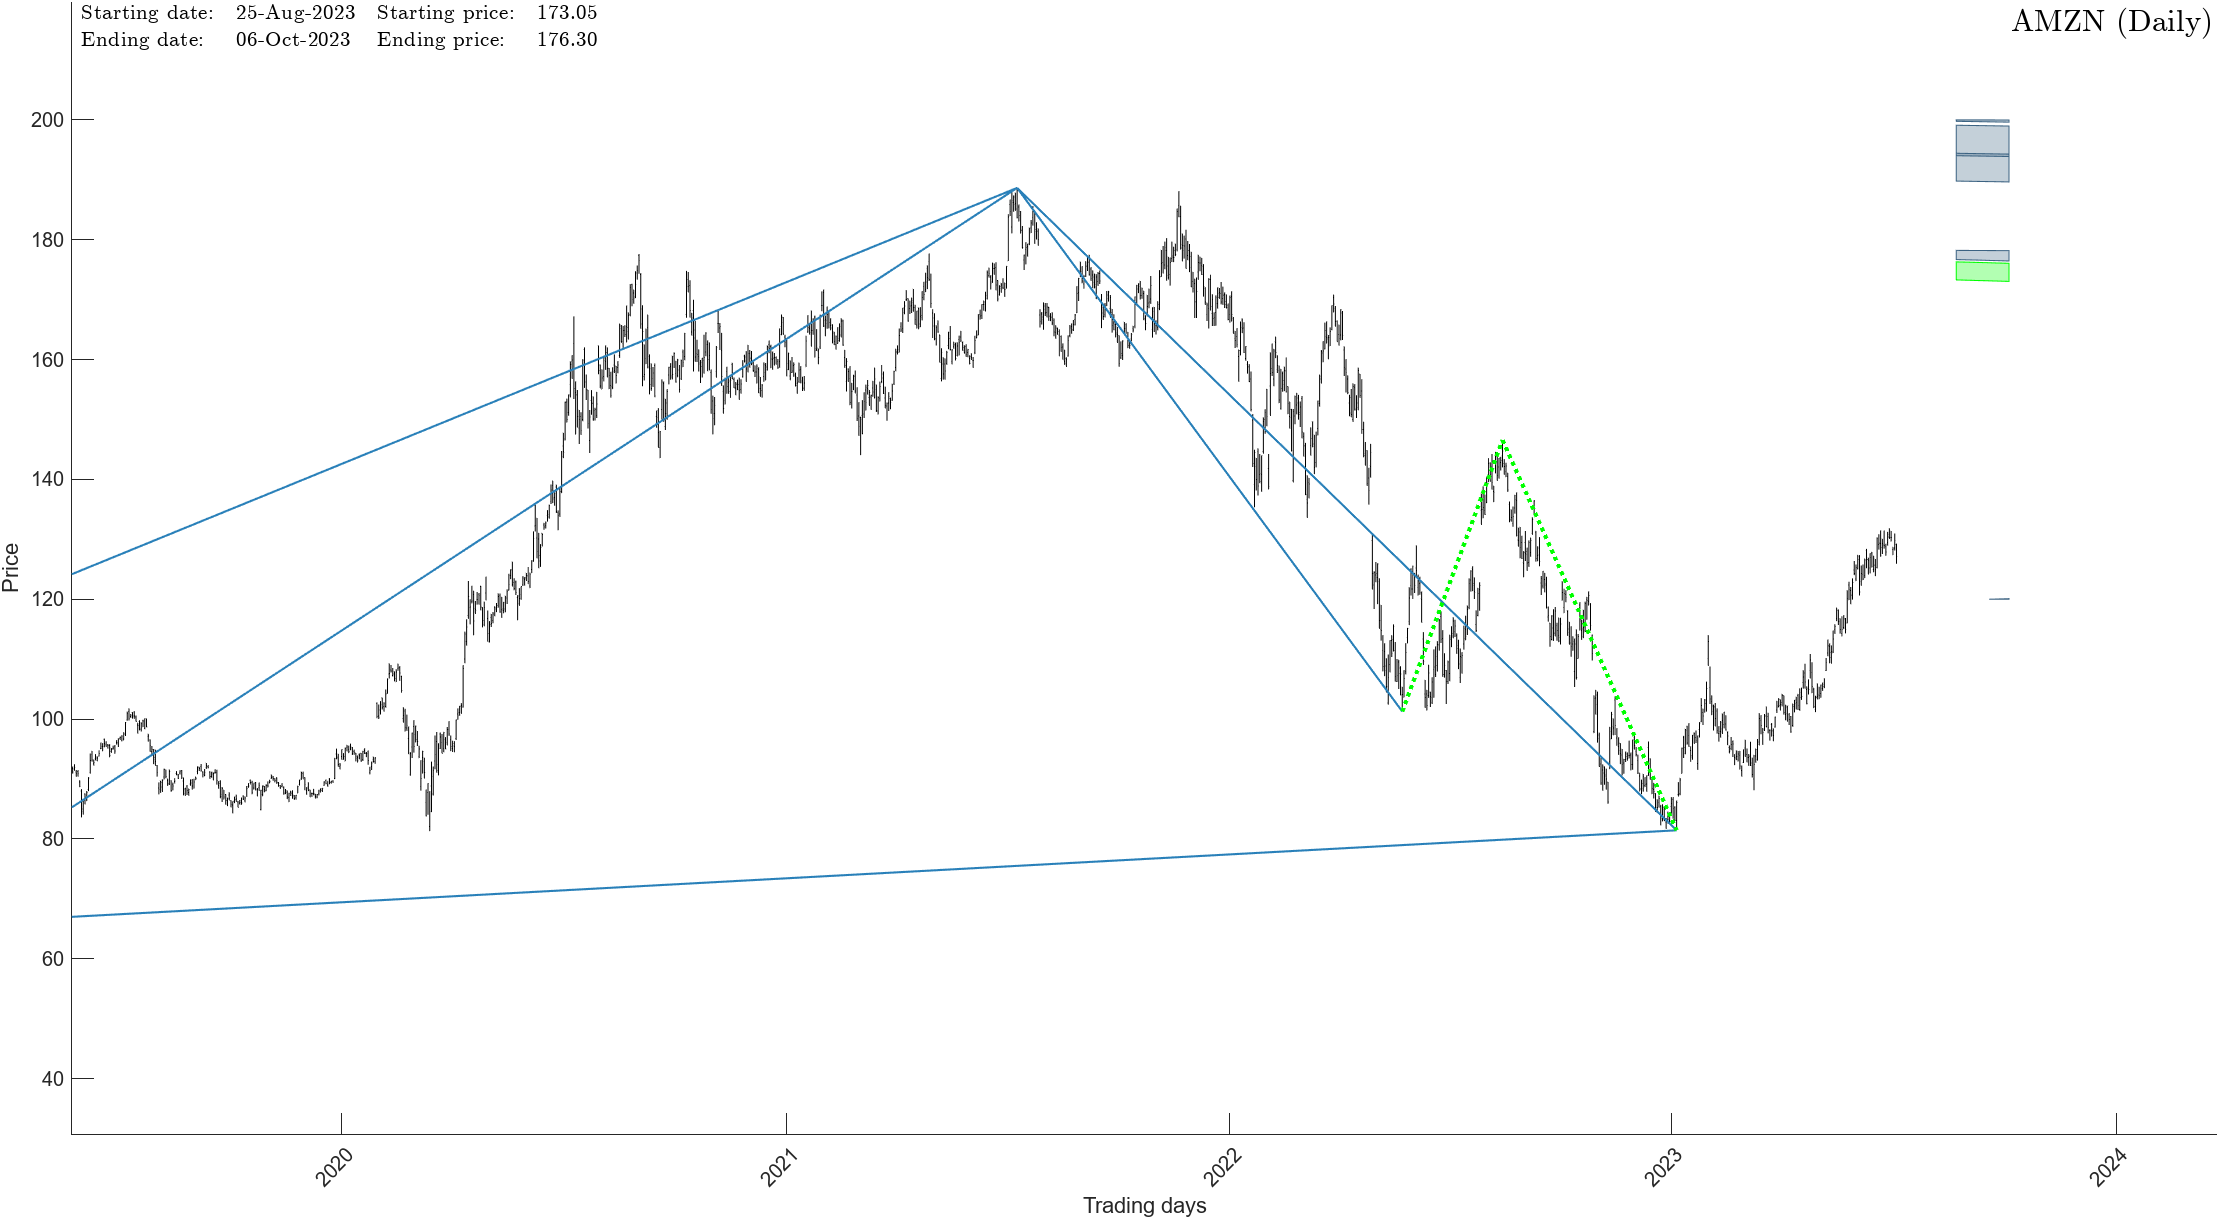
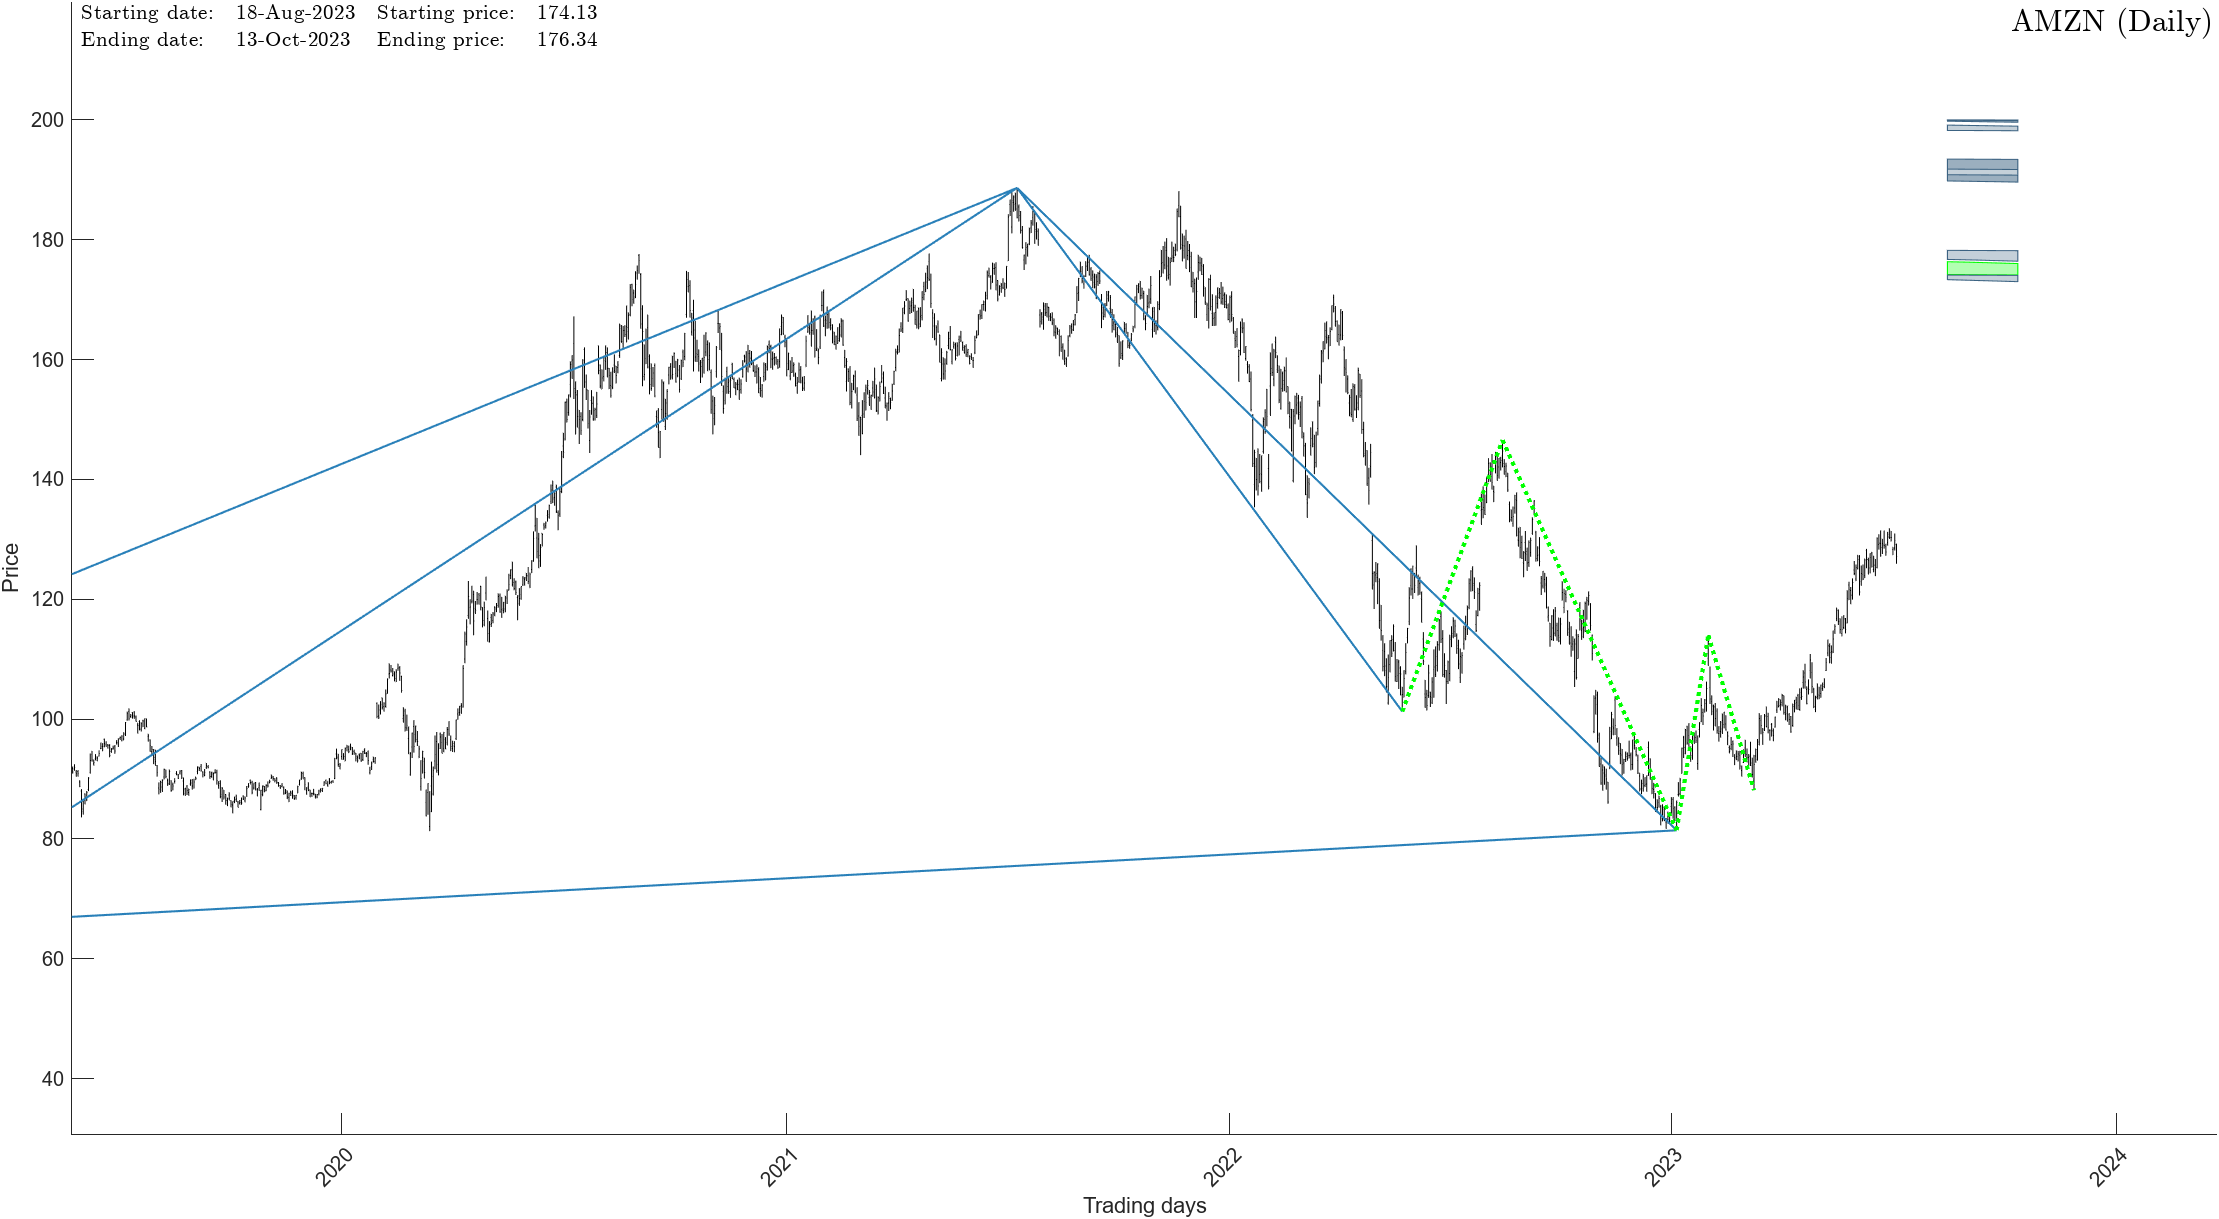
At that time we stated “The other interpretation suggests the stock will bottom this December 29th (+/- 5 trading days) at $82 (+/- $2)”
The actual bottom arrived January 6th at $81.43. We’ll take it.
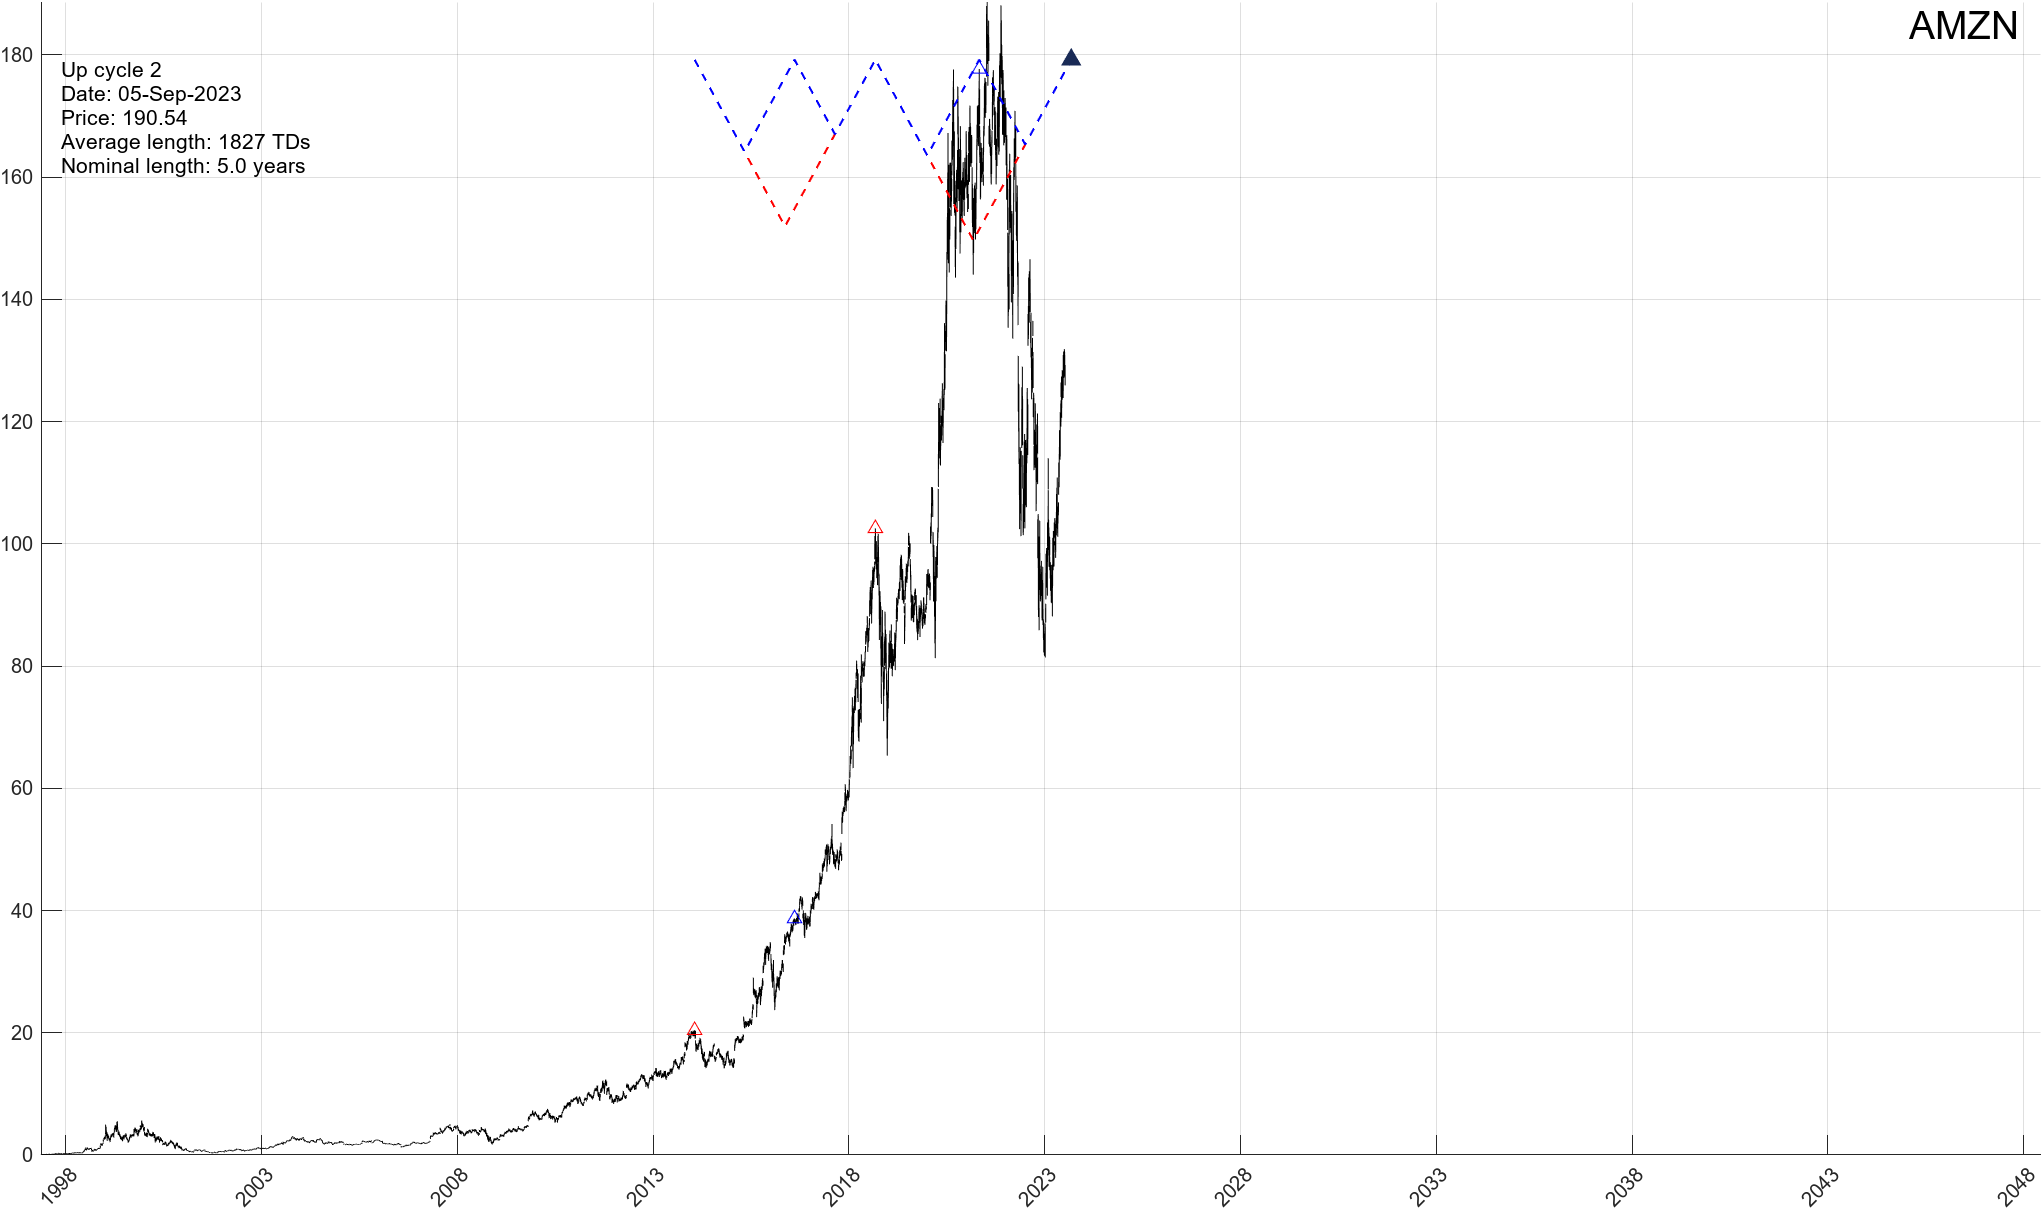
Going forward, we have a few adjustments to our prior upside projection. The price is rather clear. AMZN should top out at $174 (+/- $2). The associated TIME variable is a bit more tricky. We have a good TIME point of force arriving in September and then in January of 2024.
And while our September TIME turning point appears structurally better, it suggests AMZN is about to stage a substantial, although short lived, rally. While not impossible, we view this as unlikely at this time. We put the probability of this move developing at 20%.
Hence, we put the probability of AMZN reaching $174 by January of 2024 at 80%. Once this top arrives, AMZN should ………………………..
If you would like to find out what happens to Amazon (AMZN) next, please Click Here
The overall stock market continues to behave as anticipated. If you would like to find out when the stock market will top out, in both price and time, please Click Here.
So, picture this: two weeks ago, the crypto world was as confused as a chameleon in a bag of Skittles. Why, you ask? Well, turns out the launch of the long-awaited Bitcoin ETFs triggered a crypto-sell-a-thon of epic proportions. But fear not, dear reader, for we’ve unearthed the culprit behind this digital debacle: none other than the bankrupt FTX, playing a real-life game of “Dump the Assets” with the GBTC Bitcoin Trust.
But hold onto your hats, because amidst the chaos, a glimmer of hope emerged. GBTC outflows slowed down faster than a sloth on a sugar rush, while inflows into new spot Bitcoin ETFs surged like a kid in a candy store. And guess who’s leading the pack? The Fidelity FBTC ETF, raking in a whopping $130 million! That’s more cash than you can shake a blockchain at!
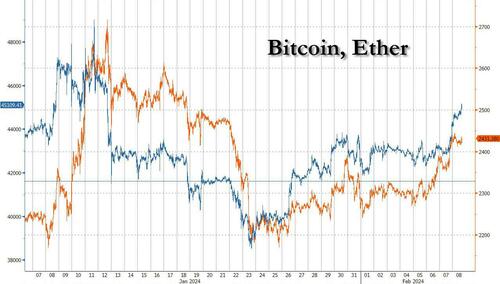
But wait, it gets even better! Bloomberg, the Wall Street oracle, is now singing the praises of ETFs, dubbing them the “chosen ones” with steady inflows. And lo and behold, this morning, Bitcoin strutted its stuff, topping $45,000 for the first time in ages! It’s like watching a digital phoenix rise from the ashes, fueled by the financial fervor of investors with more risk appetite than a goat at a buffet.
And get this: Bitcoin’s dance to the top wasn’t a solo act. It had its trusty sidekick, Ethereum, by its side. Sure, Ether hit a multi-year high of $2700 in January, but then it hit a snag. But fear not, crypto enthusiasts, for Ether is like that sneaky neighbor who always throws the best parties when you least expect it. Standard Chartered predicts it’ll hit $4,000 by May, all thanks to the SEC’s tantalizing promise of Ethereum ETFs.
So, dear reader, buckle up and enjoy the wild ride that is the crypto market. It’s a world where chaos reigns supreme, but every tumble and turn brings with it a hint of hilarity and a sprinkle of hope. After all, in the land of Bitcoin and Ethereum, anything is possible—even if it involves more drama than a soap opera on steroids!
Having said the above, it pays to know exactly what Bitcoin will do going forward. If you would recall, back in February of 2023 we confirmed 2022 bottom and have suggested that BTC would stage a significant bounce, most likely into the 40K range to close prior gap downs.
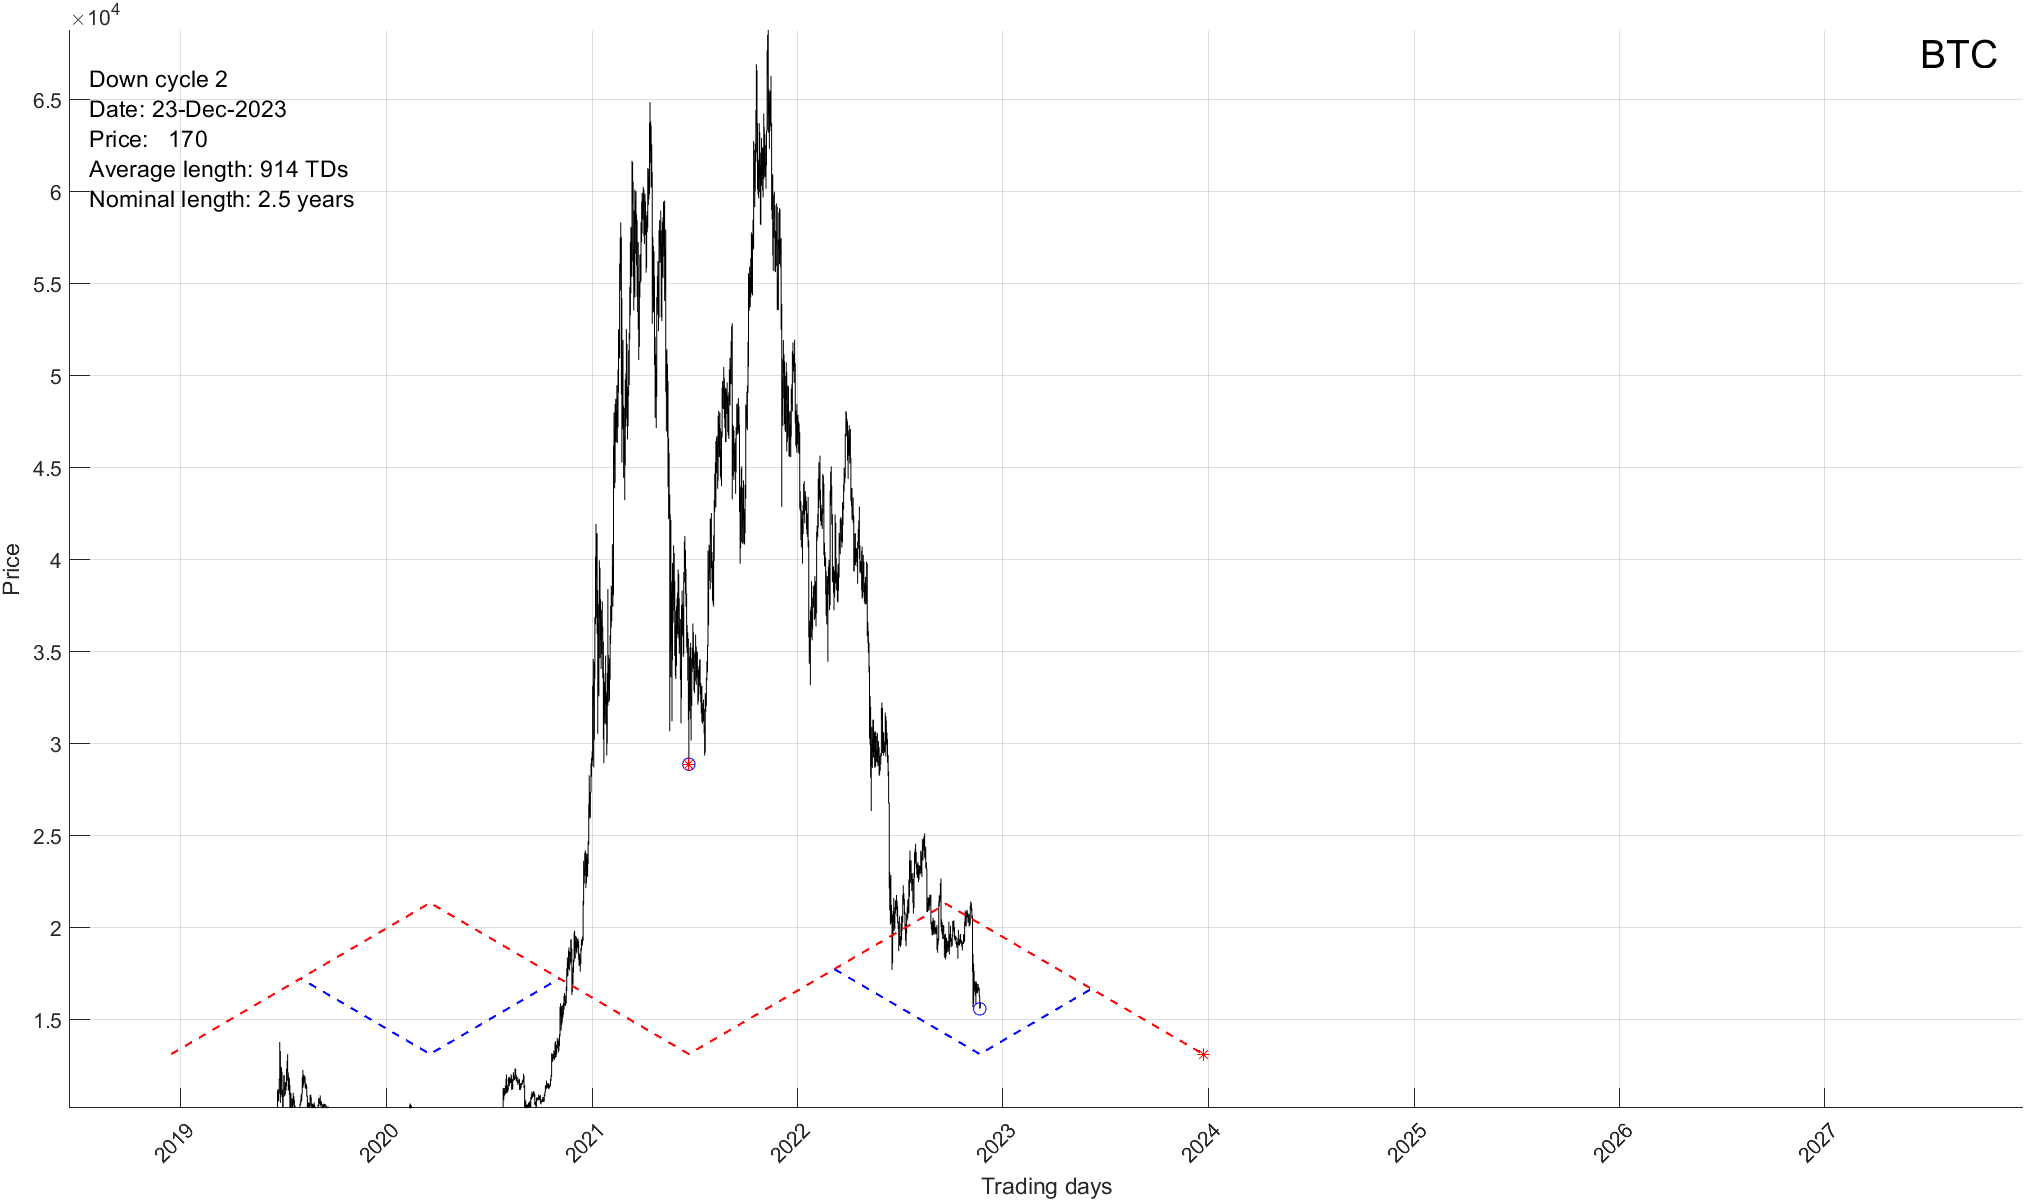
Yet, the rest of the forecast is where it gets interesting. According to our mathematical time and price calculations BTC hasn’t yet put in a major bottom. Not only that, it is quite a bit lower.
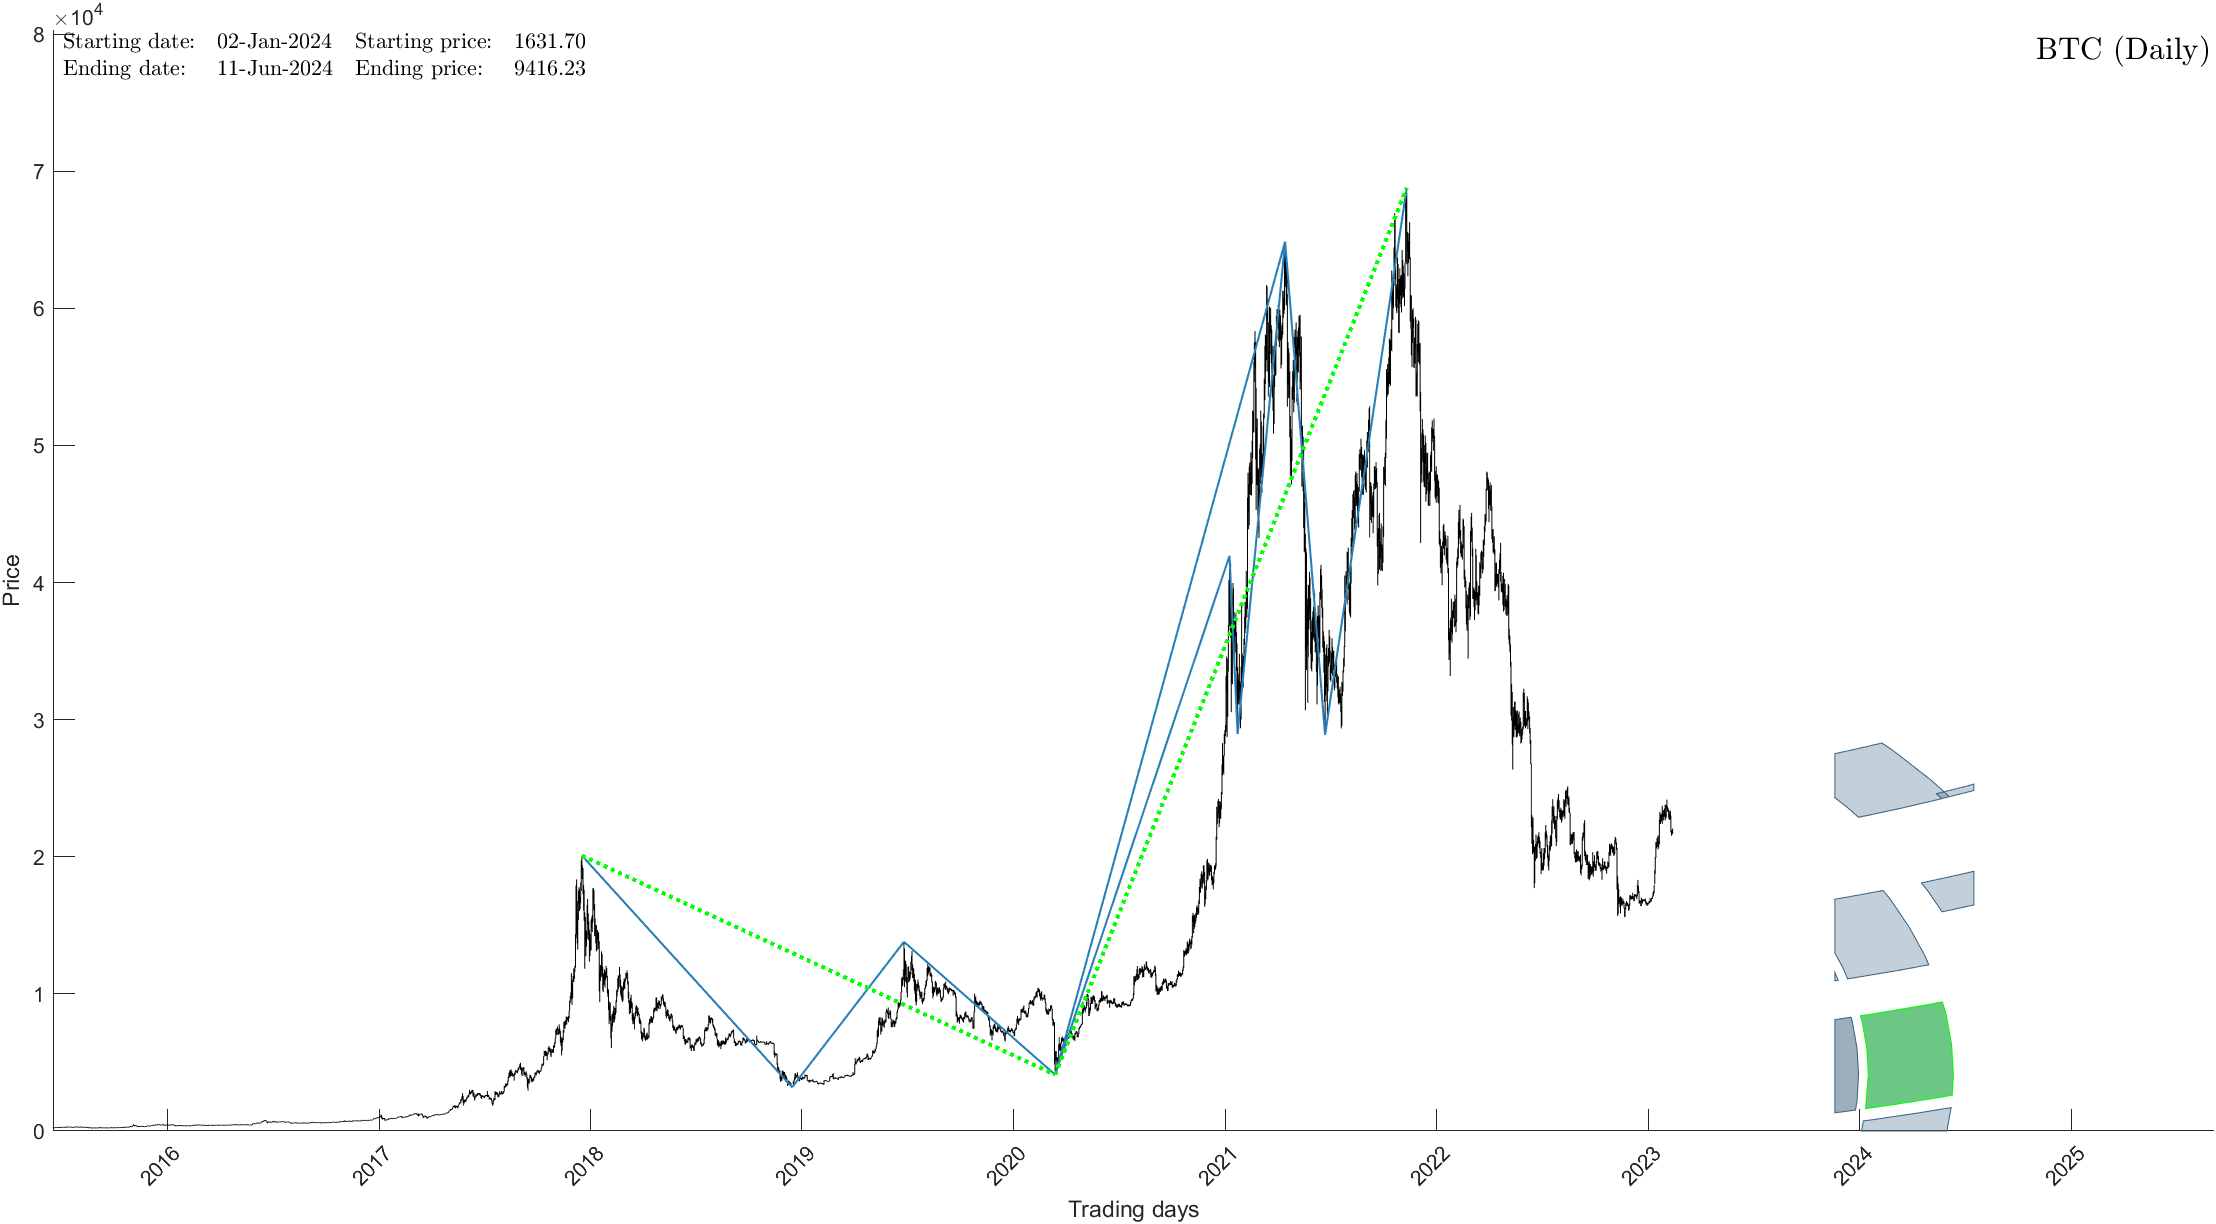
In other words, while the fools are once again projecting Bitcoin to hit $100K and above, you might want to hold off. If you would like to find out what BTC will do next, in both price and time, please Click Here.

If you would like to find out what the stock market will do next, in both price and time, please Click Here
YET ANOTHER DIRECT HIT.
Analysis Update For Amazon (AMZN)
Date of Update: July 11th, 2023
Yet another direct hit from our prior analysis (see below).
At that time we stated “The other interpretation suggests the stock will bottom this December 29th (+/- 5 trading days) at $82 (+/- $2)”
The actual bottom arrived January 6th at $81.43. We’ll take it.
Going forward, we have a few adjustments to our prior upside projection. The price is rather clear. AMZN should top out at $174 (+/- $2). The associated TIME variable is a bit more tricky. We have a good TIME point of force arriving in September and then in January of 2024.
And while our September TIME turning point appears structurally better, it suggests AMZN is about to stage a substantial, although short lived, rally. While not impossible, we view this as unlikely at this time. We put the probability of this move developing at 20%.
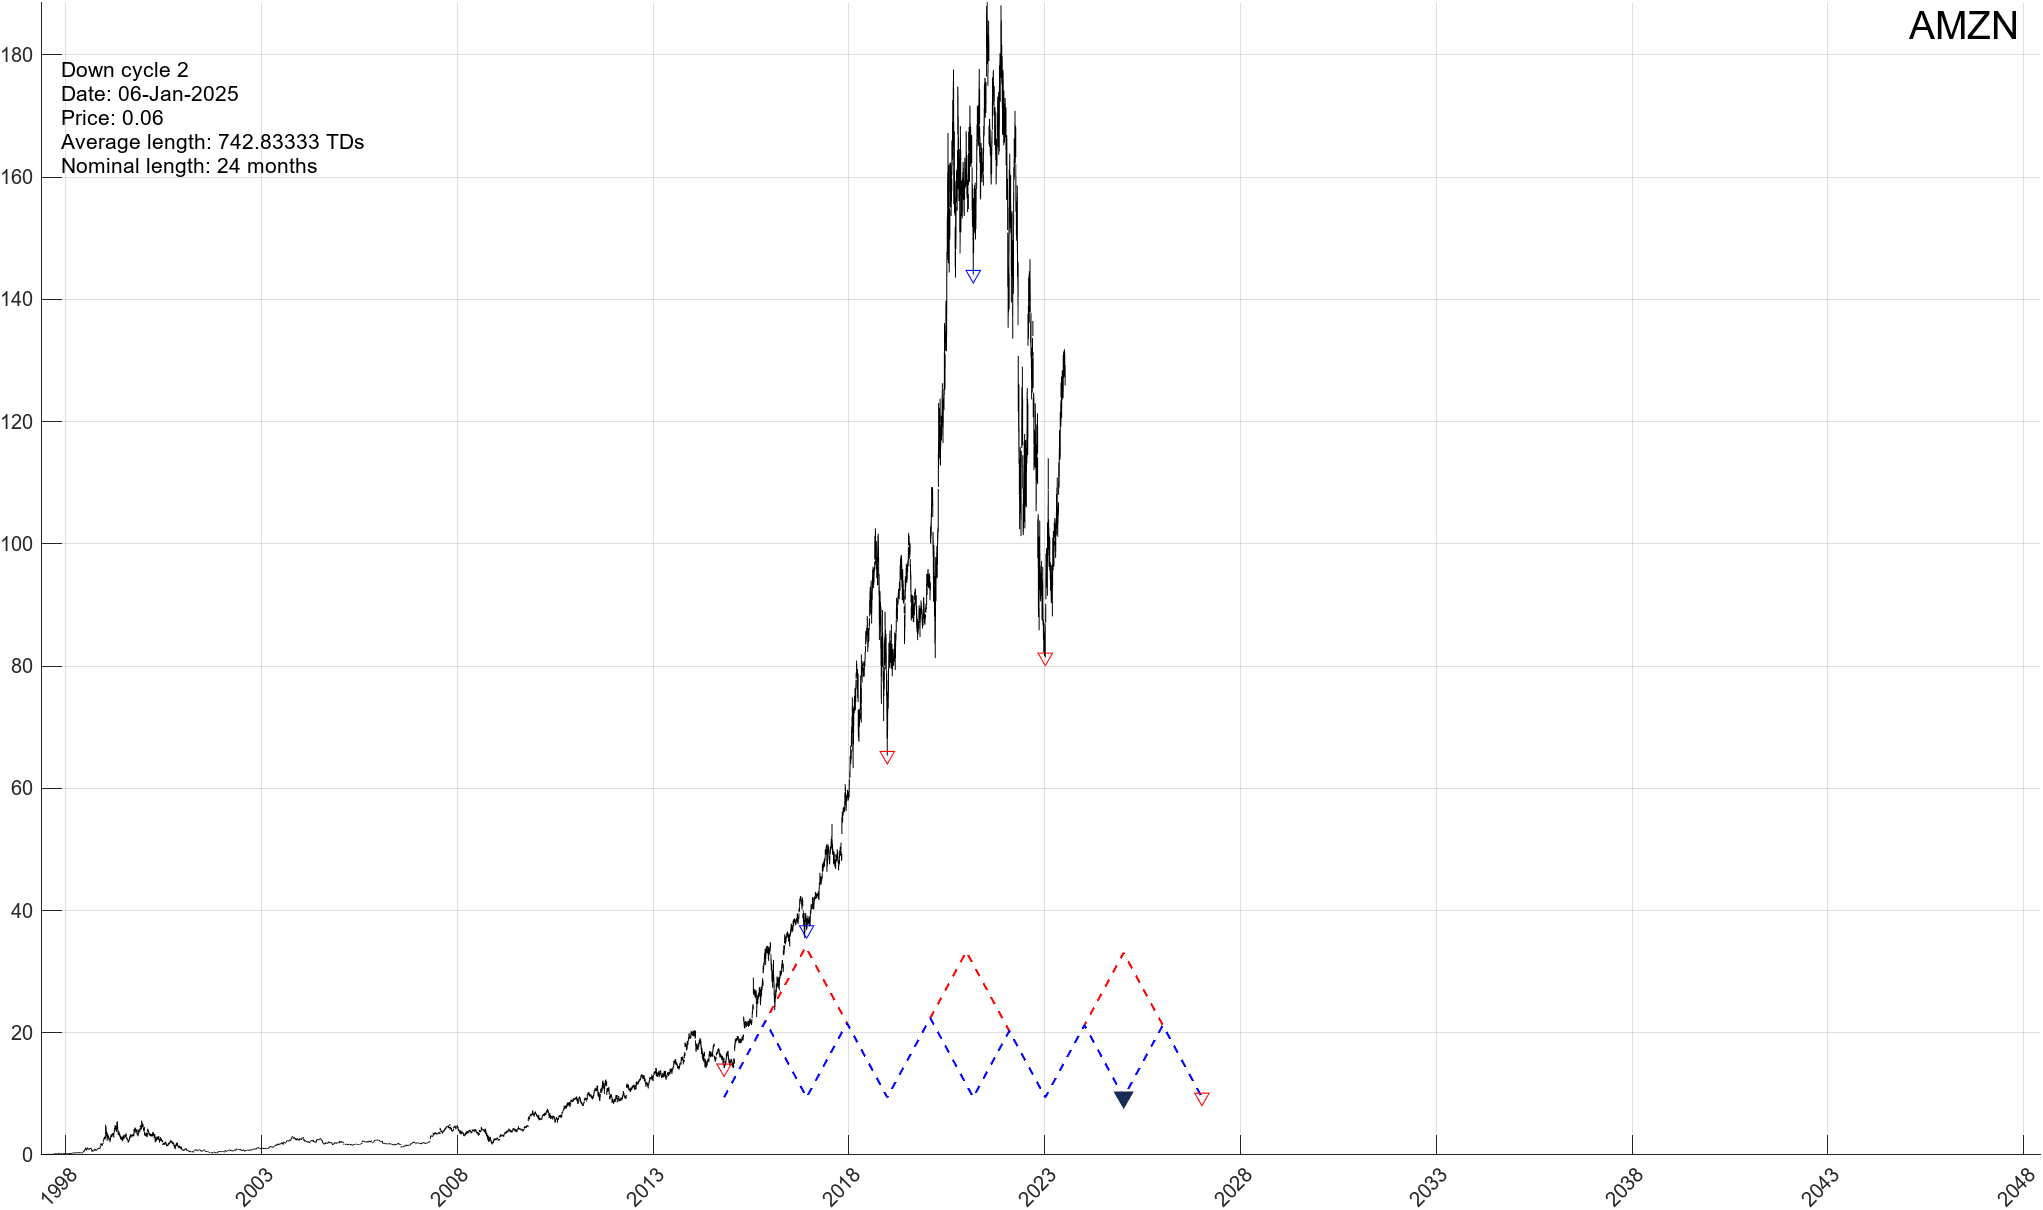
Hence, we put the probability of AMZN reaching $174 by January of 2024 at 80%. Once this top arrives, AMZN should swiftly move to the downside.
Subsequently, we have a number of downside projections for AMZN, as low as ………If you would like to find out what happens next, please Click Here

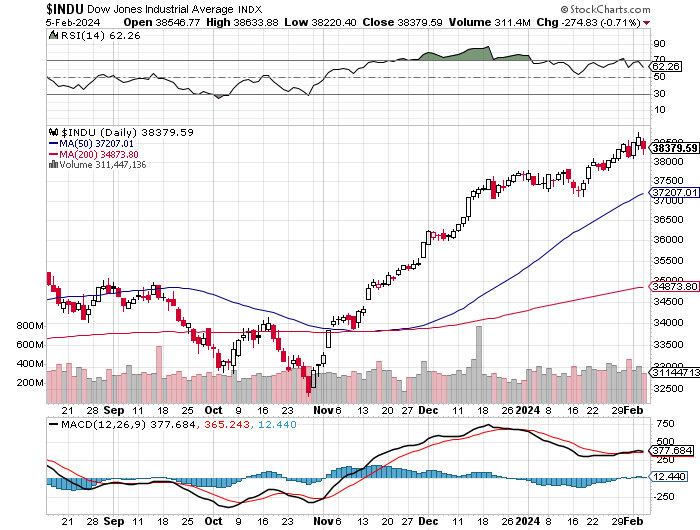
2/5/2024 – A negative day with the Dow Jones down 274 points (-0.71%) and the Nasdaq down 31 points (-0.20%)
The stock market continues to behave as anticipated. If you would like to find out exactly when and where the top will arrive, please CLICK HERE
This is yet another must watch from Catherine Austin Fitts and Greg Hunter

If you would like to find out what the stock market will do next, in both price and time, please Click Here
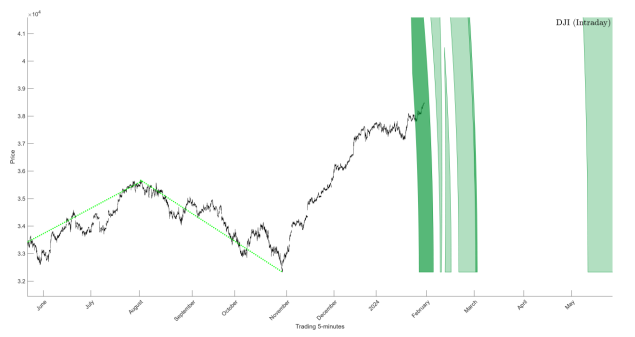
Our daily report for the Dow Jones Intraday analysis has been posted. To see it, please Click Here.
If you would like to find out what the stock market will do next, in both price and time, short-term and/or long-term, please Click Here
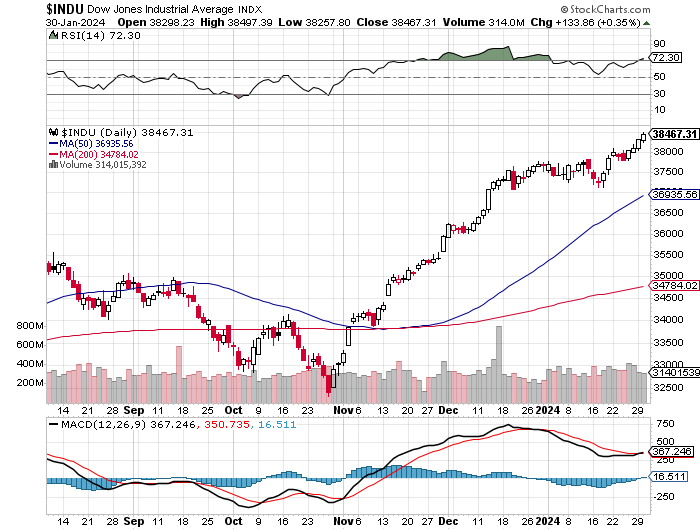
1/30/2024 – A mixed day with the Dow Jones up 133 points (+0.35%) and the Nasdaq down 118 points (-0.76%)
The stock market continues to behave exactly as anticipated/projected.
It has been a long time since we have looked at Shiller’s PE Ratio……
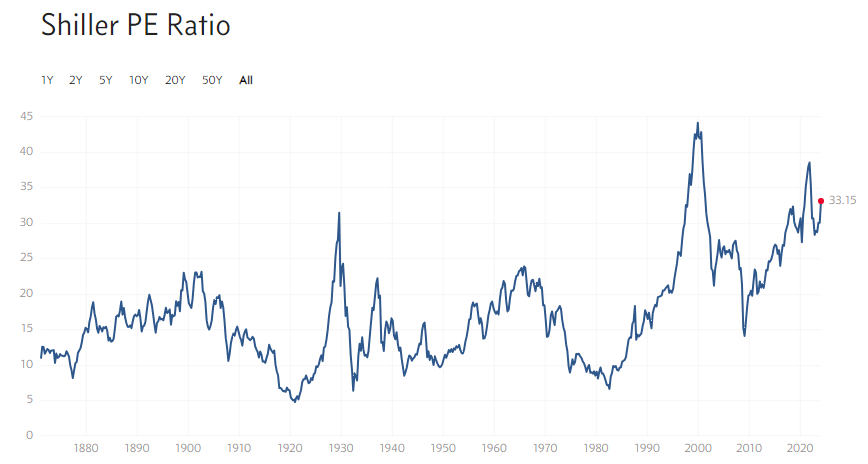
Why do I bring this up?
JPMorgan Warns Today’s Market Is “Far More Similar Than One May Think” To The Dotcom Bubble Peak
And I wouldn’t necessarily disagree.
As you can see we have been sitting at extraordinary valuation levels for nearly 10 years now. Today’s valuation levels are on par with 1929 and slightly below 2000 highs. But 2000’s P/E record is somewhat misleading as the index was heavily weighted in tech stocks that didn’t have any earnings.
Long story short, yes, absolutely, the stock market is once again selling at record valuation levels.
Having said that, it has yet to reach its top. As we have been suggesting for some time, the stock market will not complete this bull move until it hits its mathematical Time/Price point of force. If you would like to find out exactly where this point is, in both price and time, please Click Here.

If you would like to find out what the stock market will do next, in both price and time, please Click Here