
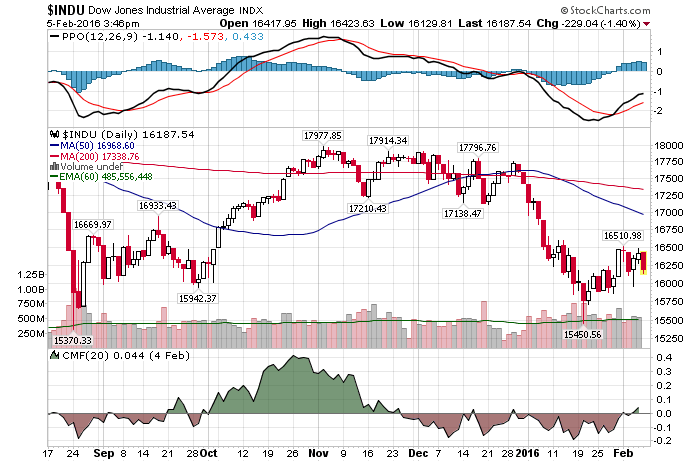
2/5/2016 – A down day with the Dow Jones down 212 points (-1.29%) and the Nasdaq down 146 points (-3.25%).
I’ll be very frank and to the point here. This update falls under my “$100,000 Guarantee”
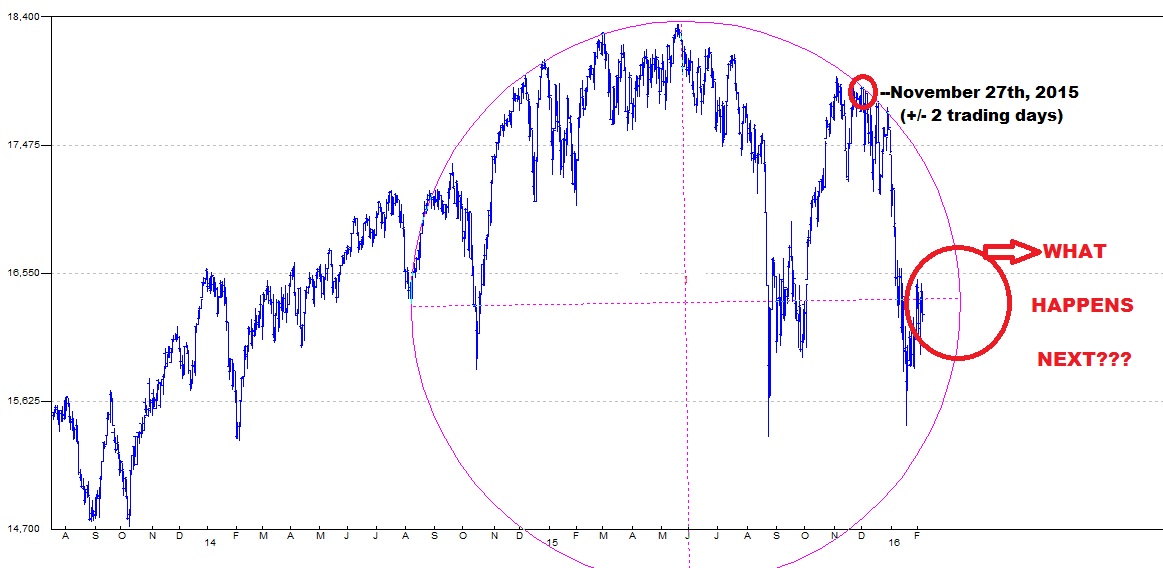
I first introduced my TIME turning point of November 27th (+/- 2 trading days) to my subscribers in early September of 2015. At that point I have suggested that this TIME turning point is one of the most powerful TIME turning points of the year. Just as strong as May 19th TIME turning point was.
As the market bottomed (higher low) on September 29th and then surged higher it became evident that Nombember 27th would be a top and not a bottom. As a result, I then introduced the elliptical structure above. Displaying clear resistance levels.
To summarize, as we pushed into this top we knew two things.
- The exact TIMING – Nobember 27th and…
- The price level where the market is likely to top out (at resistance).
In fact, this is the chart to my subscribers, first posted in our subscriber section on October 31st, 2015. Before the projected top was put in and subsequent decline.
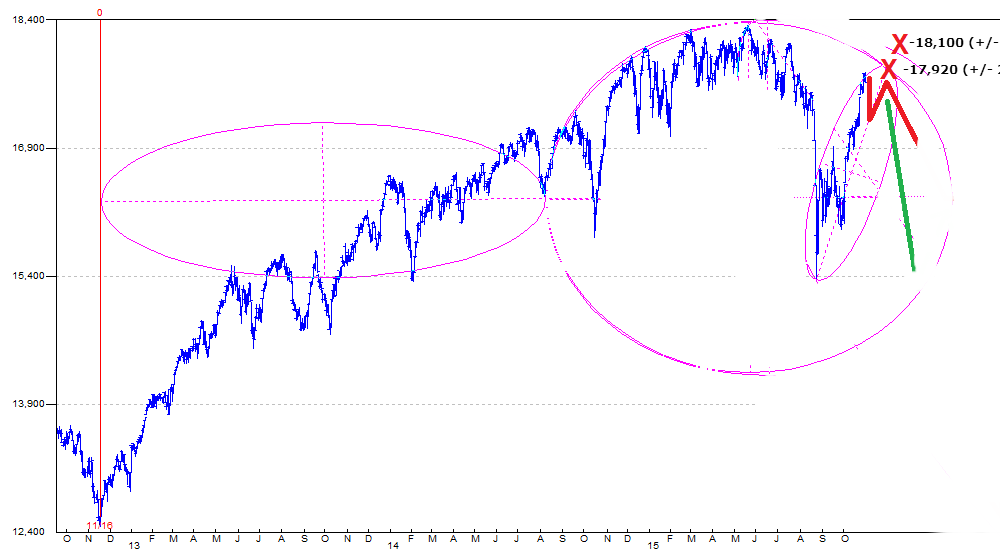
Actually, this top was quite a bit uglier than the work above indicates. The actual PRICE top on the Dow arrived on November 3rd. The top on our TIME turning point of November 27th was slightly lower (secondary top). Then, the market proceeded to run into our elliptical resistance at lower levels twice more. Once on December 17th and once on December 29th, before the massive sell-off in early January. I discuss why we had those attempts at resistance in our subscriber section in greater detail.
The chart above also helps explain the market action thus far and most importantly, what happens next. There are two things to consider at this time……
- The market will remain within a tight trading range until the elliptical structure above terminates. My subscribers know the exact date and price of such termination.
- Something incredibly important will happen as soon as this structure terminates. Unfortunately, what that is, is only available to my subscriber.
If this type of Price/Time analysis is of interest to you, please Click Here
This conclusion is further supported by my mathematical and timing work. It clearly shows a severe bear market between 2015-2017. In fact, when it starts it will very quickly retrace most of the gains accrued over the last few years. If you would be interested in learning when the bear market of 2015-2017 will start (to the day) and its internal composition, please CLICK HERE.
(***Please Note: A bear market might have started already, I am simply not disclosing this information. Due to my obligations to my Subscribers I am unable to provide you with more exact forecasts. In fact, I am being “Wishy Washy” at best with my FREE daily updates here. If you would be interested in exact forecasts, dates, times and precise daily coverage, please Click Here). Daily Stock Market Update. February 5th, 2016 InvestWithAlex.com
Did you enjoy this article? If so, please share our blog with your friends as we try to get traction. Gratitude!!!
