
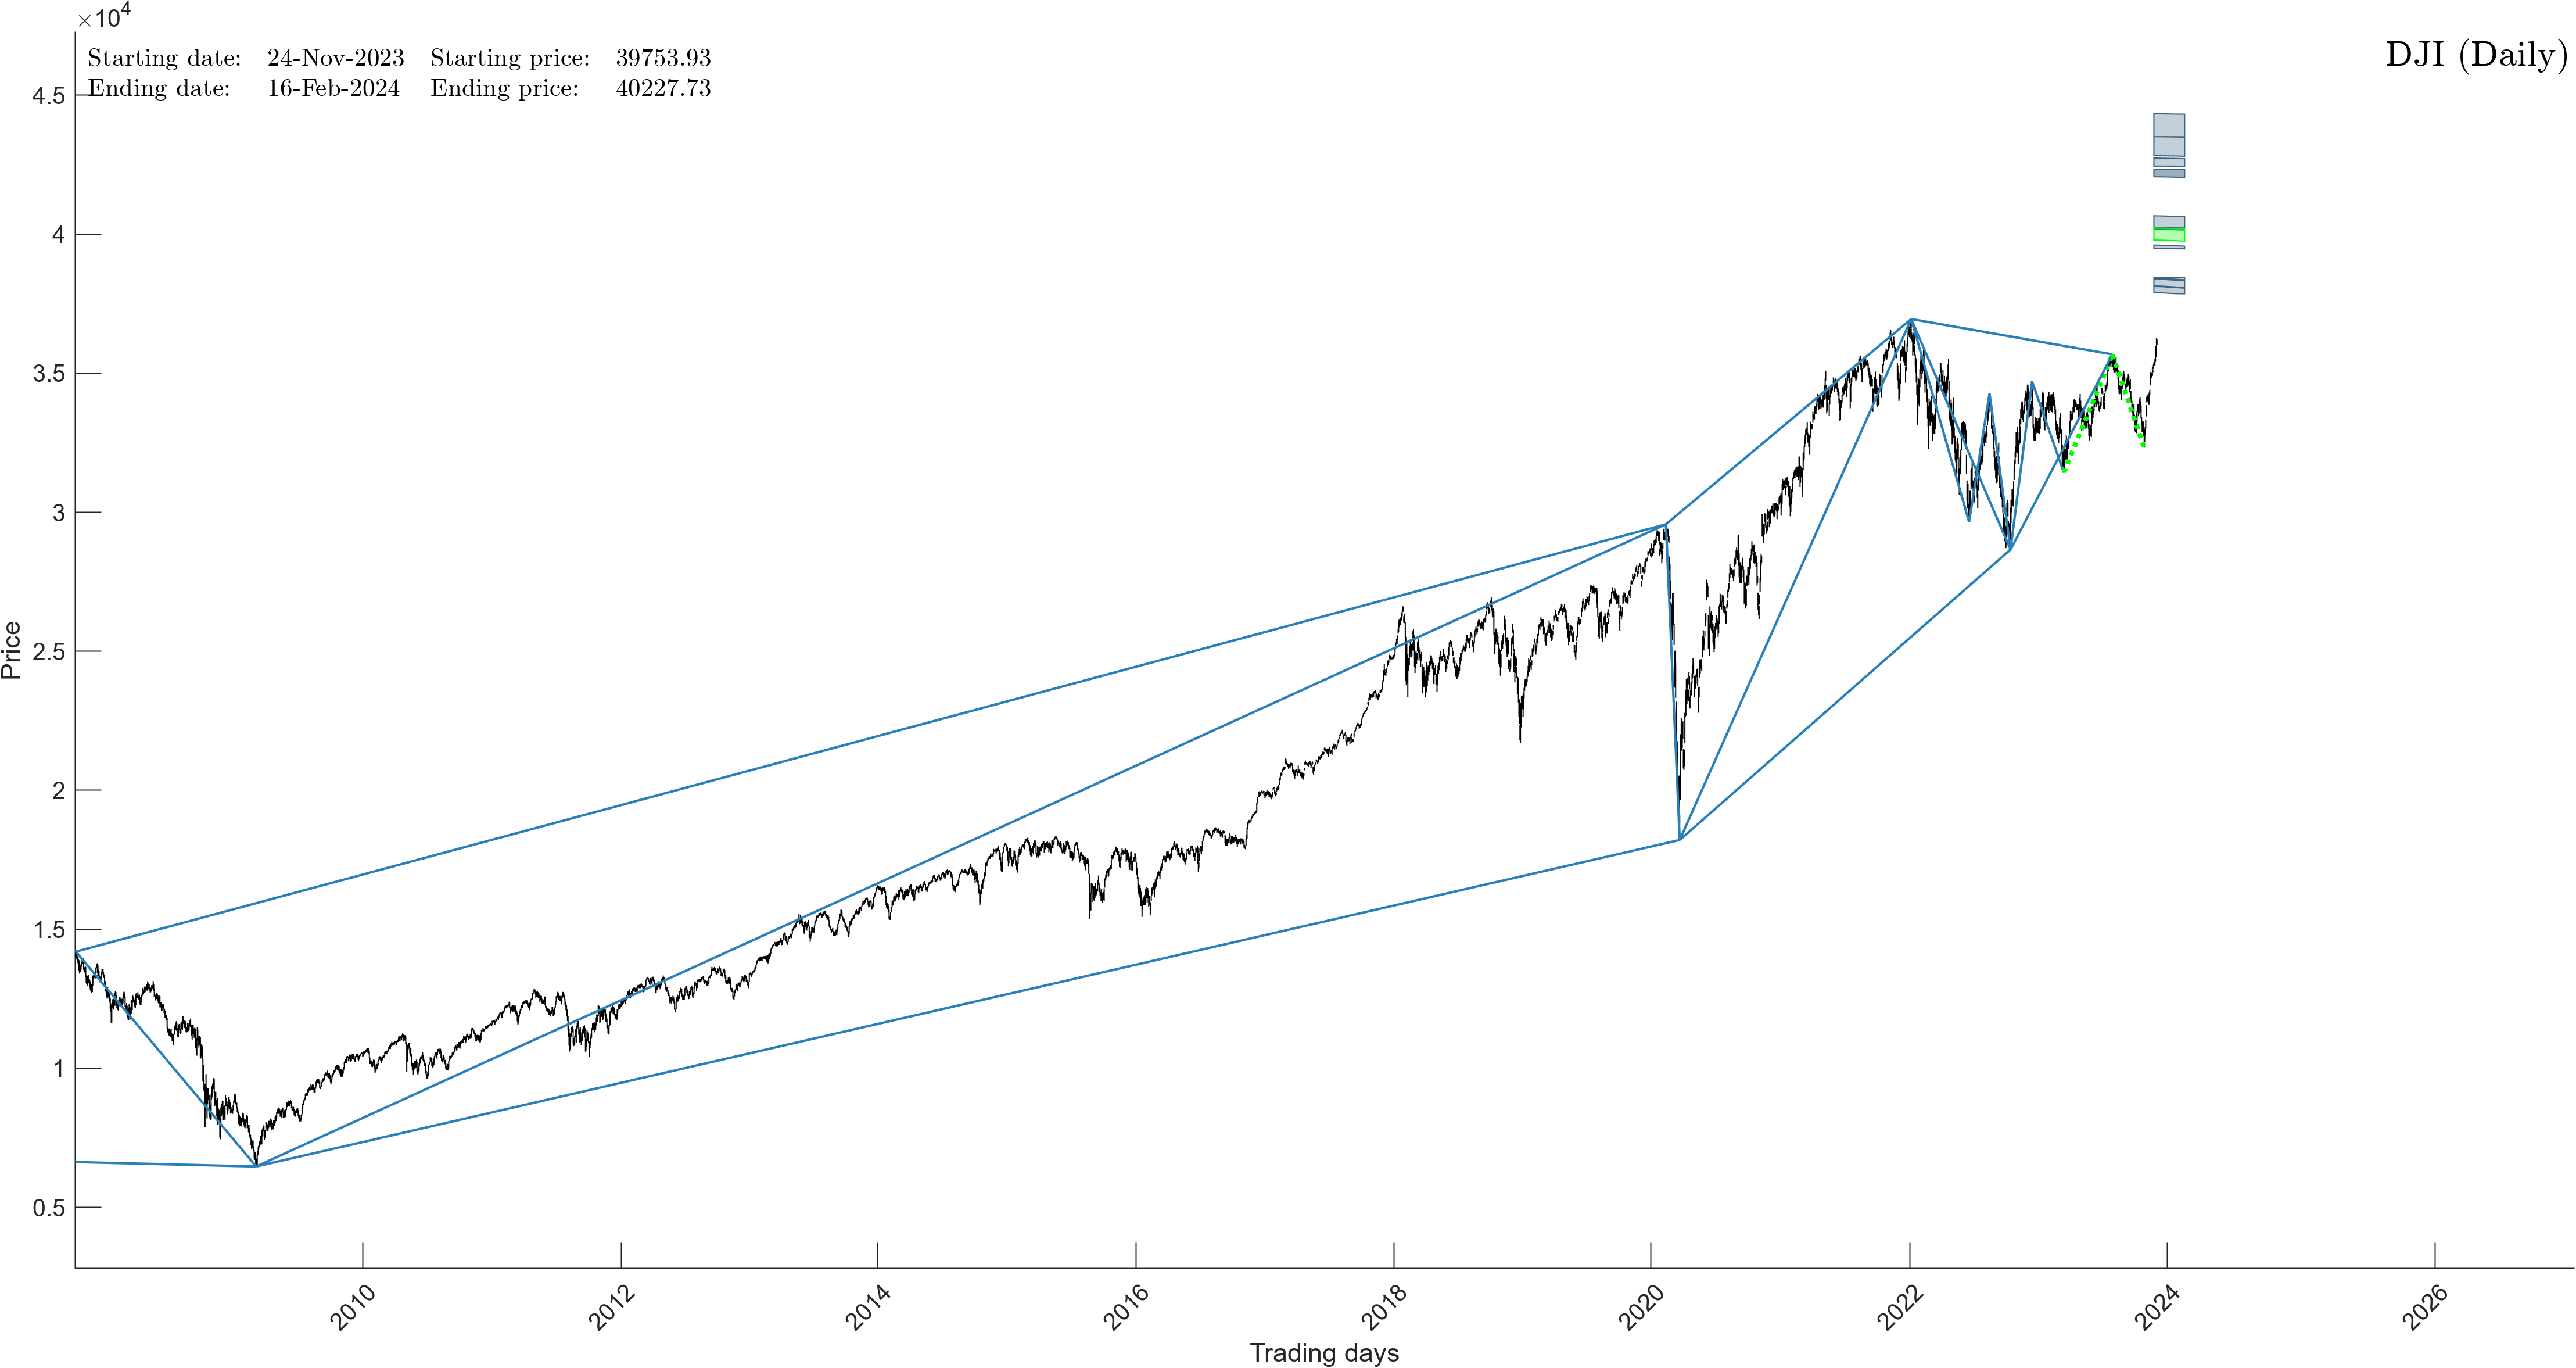
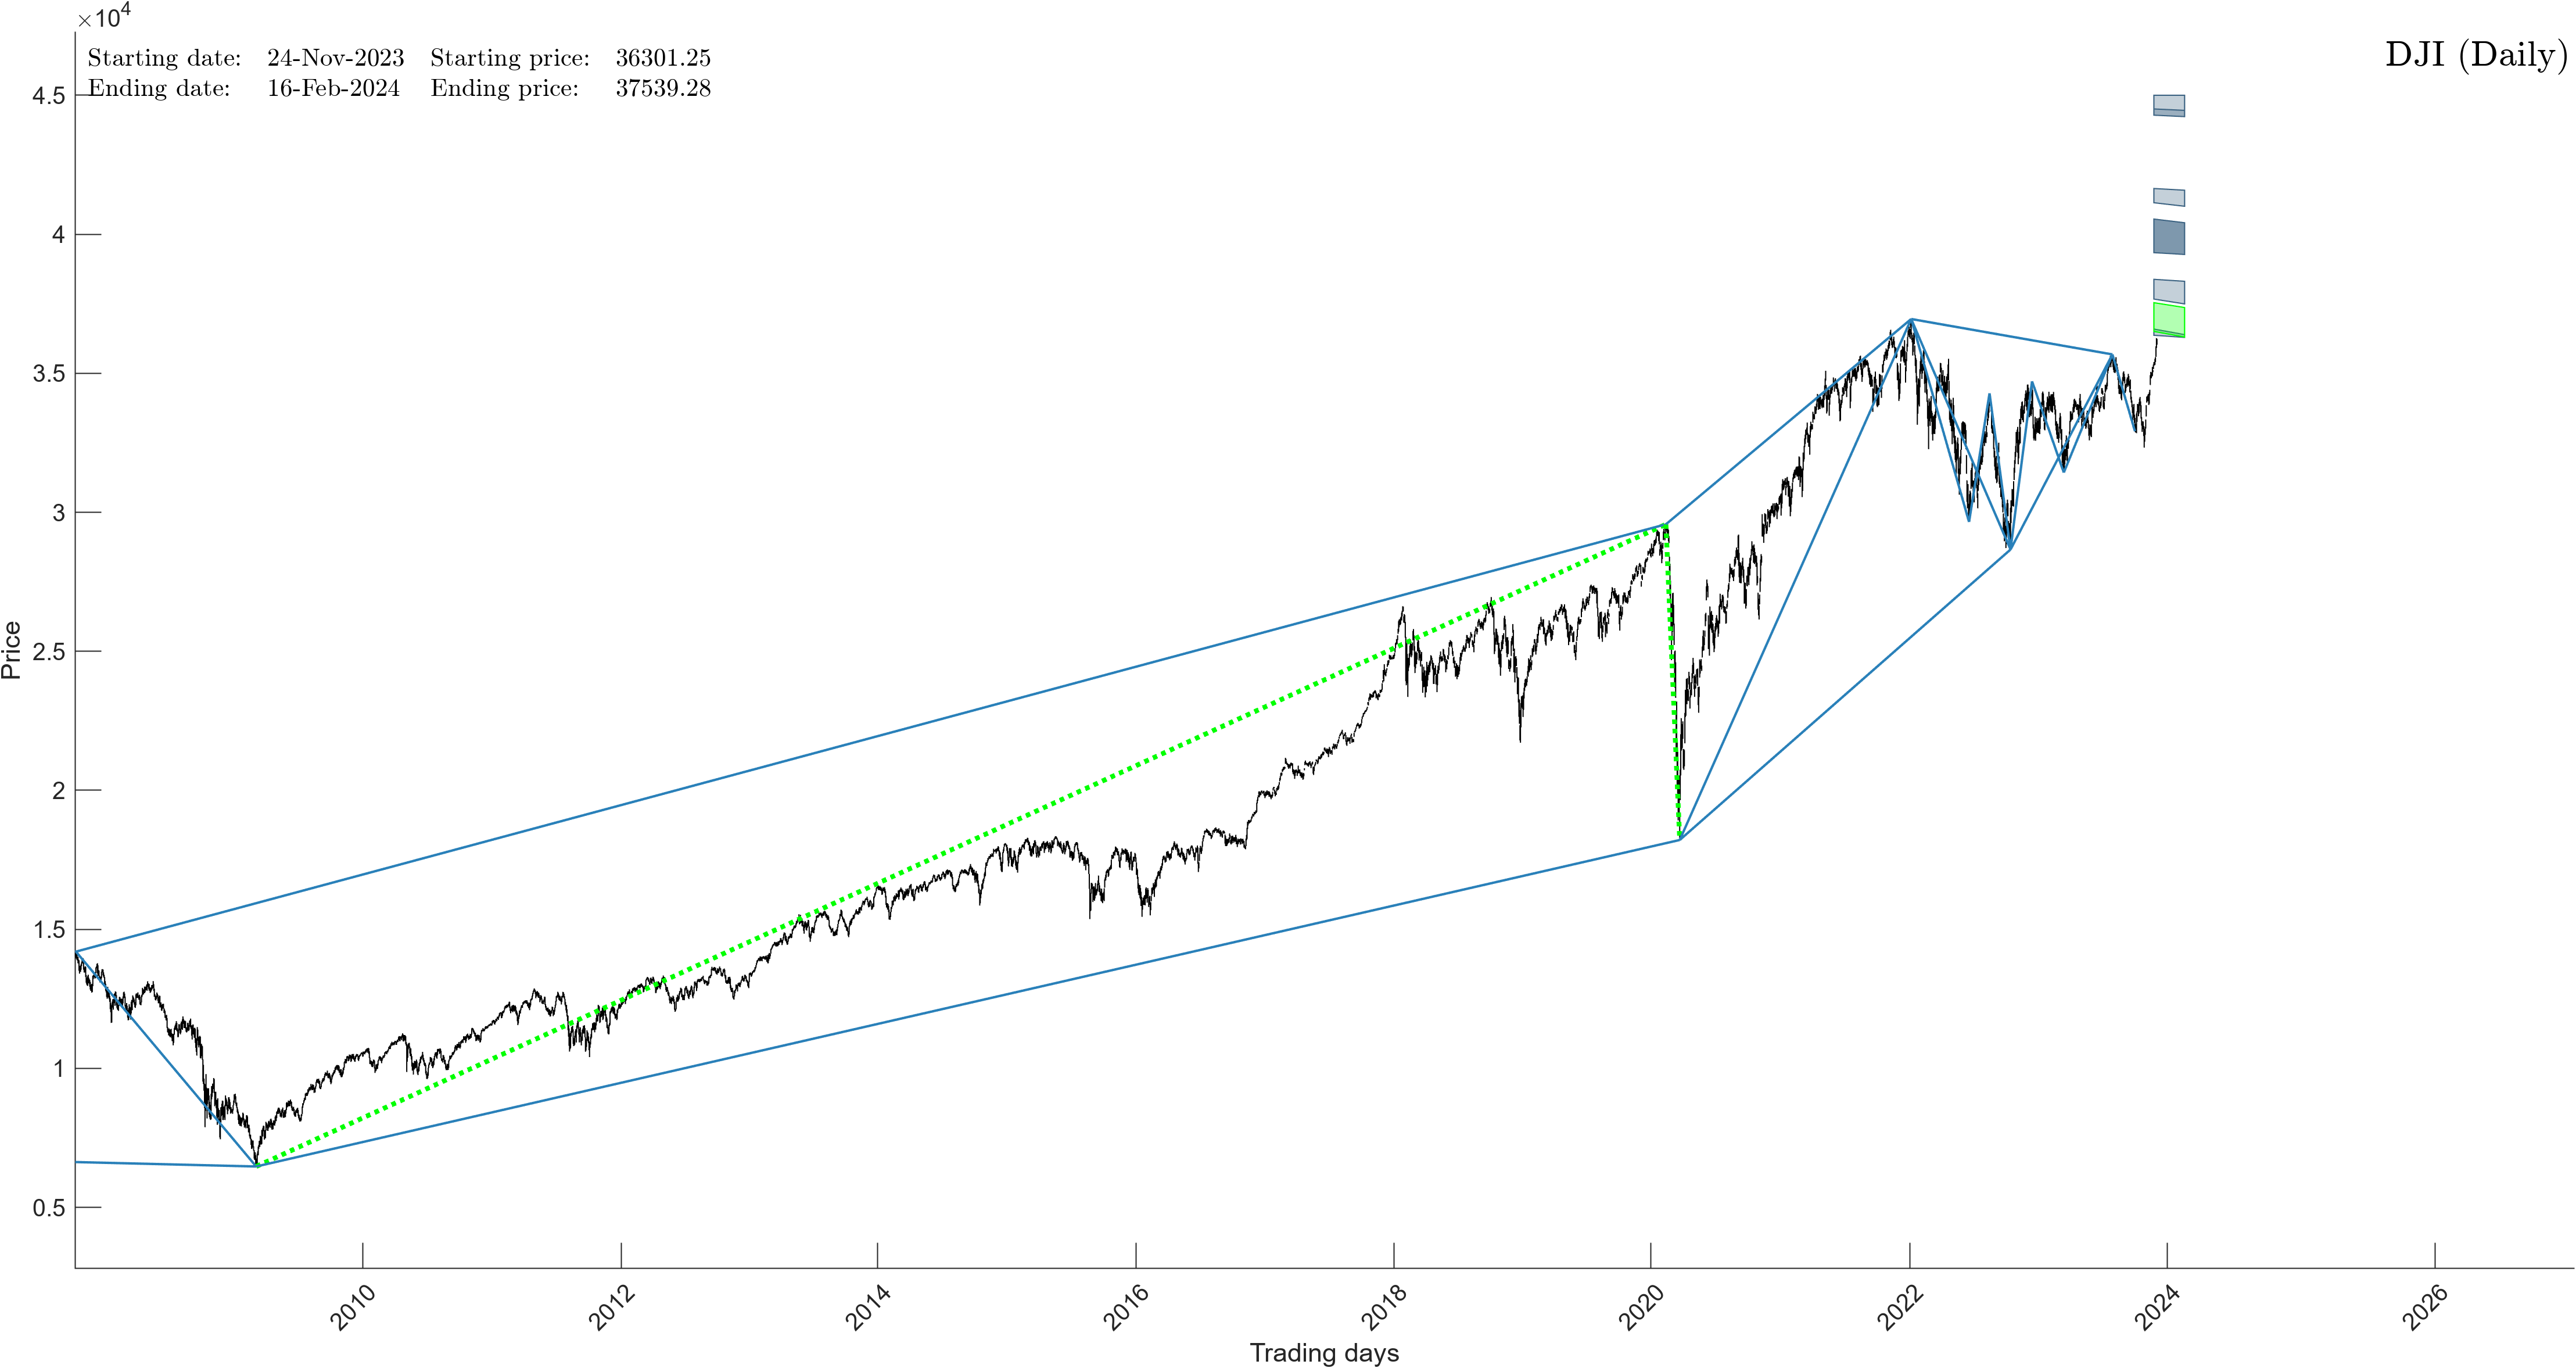
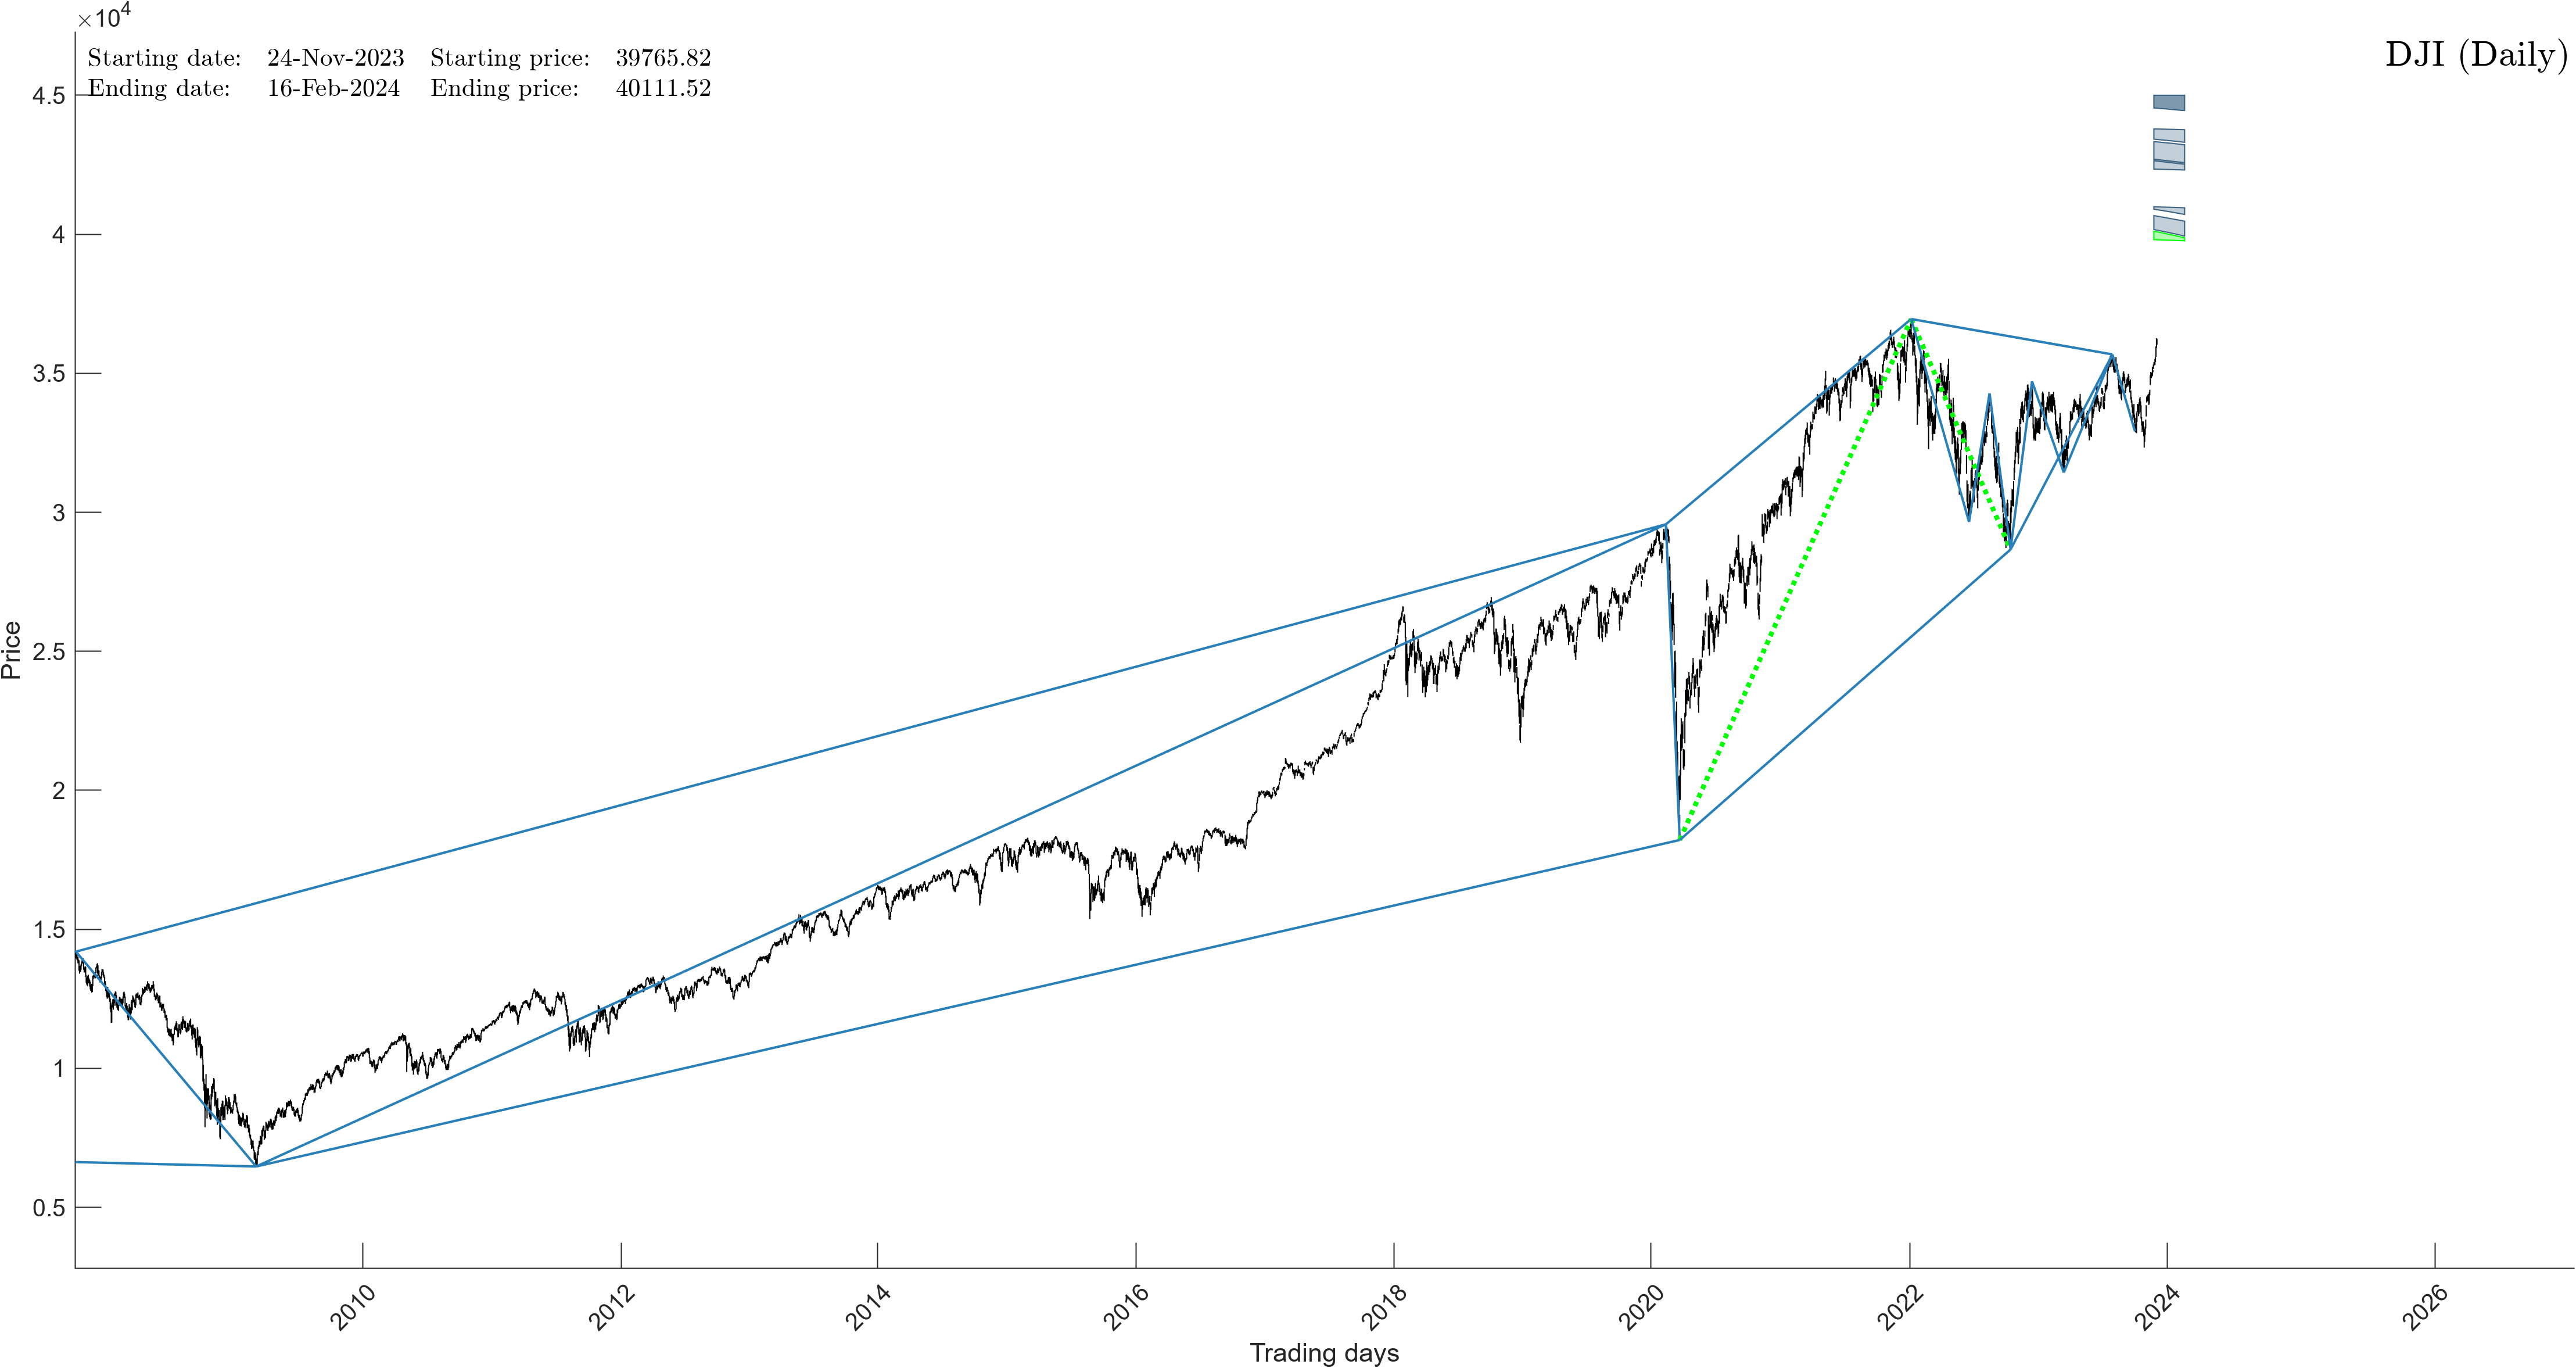
It has long been our claim, now proven, that as the stock market develops it traces out an exact geometrical structure or mathematical pattern. Not that dissimilar to what we witness when we look at the DNA structure.
For example, charts below represent the Dow Jones’ mathematical composition on long-term, mid-term and short-term basis. Please note, depending on the time scale we are looking at, the Dow projects a unique set of completion points or PRICE levels.
Please note: TIME variable below is displayed for educational (not forecasting) purposes.
The trick is combining multiple mathematical time frames together and subsequently making a projection of where these multiple time frames intersect. It is at that math intersection point that the market is scheduled to finally top out.
Now, when we add other timing and mathematical tools, including short-term, we can narrow down the time window even more. Sometimes to the hour and +/-100 points on the Dow.

If you would like to find out what the stock market will do next in both price and time, long-term and short-term, please Click Here. You can also find our MegaCap Stocks Time/Price Projections and our Fast Movers at the same link.