
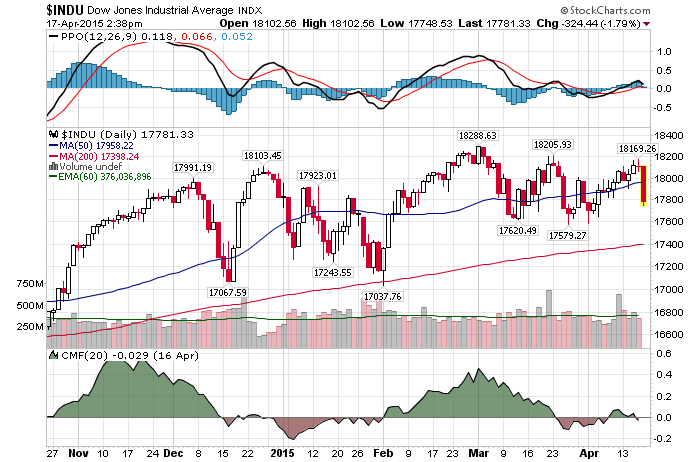
4/17/2015 – A big down day with the Dow Jones down 280 points (-1.55%) and the Nasdaq down 76 points (-1.52%).
The stock market continues to behave exactly as forecasted. If you would like to find out what happens next, please Click Here.
So, was it possible to predict today’s sell-off?
Sure, but you wouldn’t be able to forecast or anticipate it with the help of either fundamental or technical analysis. You would need something more. You would need TIMING analysis.
Most investors measure the movements of their underlying financial instruments in PRICE only. That is a wrong approach. Don’t forget, all charts consist of two axis. Price and time. By concentrating only on the price portion of the equation, investors and analyst leave out 50% of necessary data. TIME data needed to make accurate stock market forecasts. In other words, we need to unify price and time.
To fully understand how to do that, get two free chapters of my book Timed Value.
Let’s take a quick look at the real stock market example to see the amazing precision this particular technique can offer us.
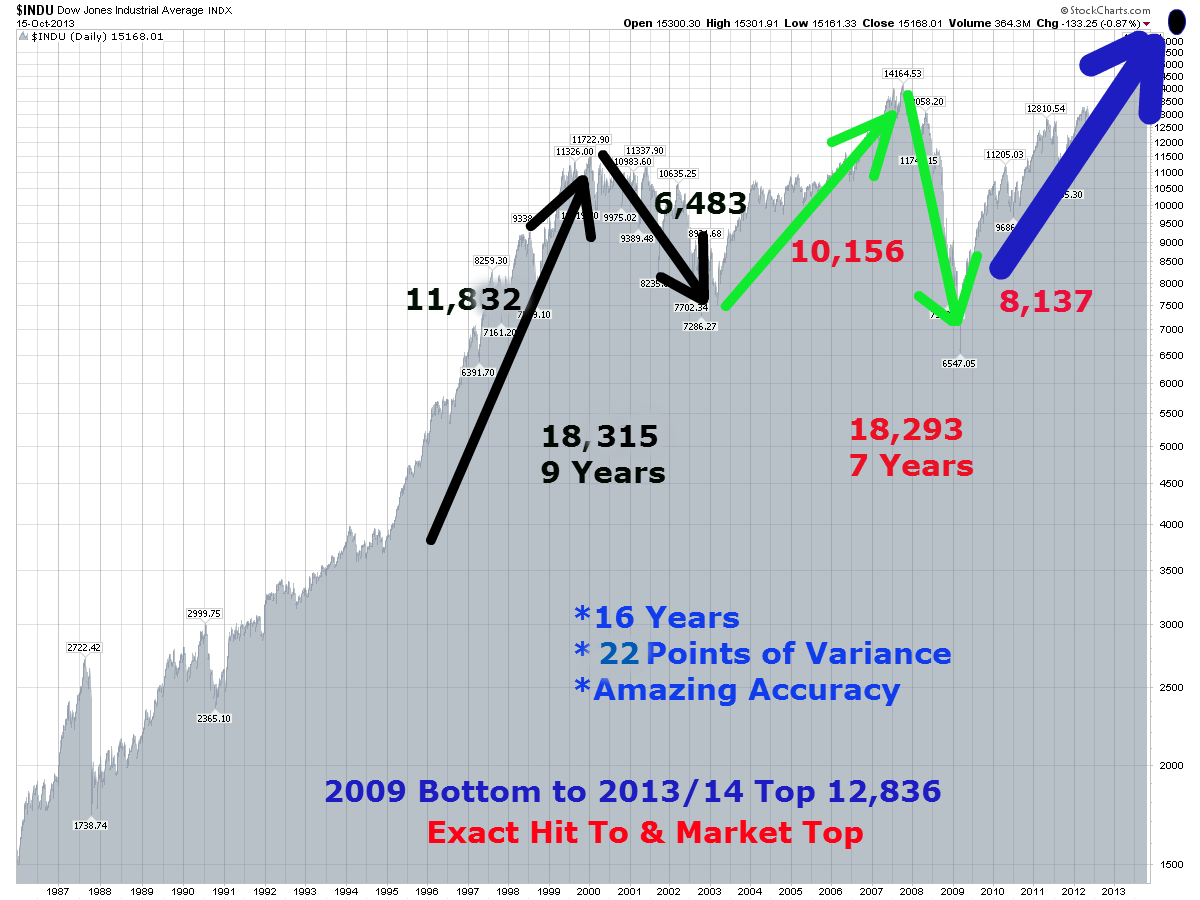
I cannot overstate how amazing this chart is. Just a few points. (3-DV stands for 3-Dimensional Value)
- As we have already discussed, the move between 1994 bottom and 2000 top was 11,832 3-DV UNITS. The Dow topped at exactly 11,866 in January of 2000. Amazing!!!
- The up move between 1994 bottom and 2000 top was 11,832 3-DV UNITS. The down move between 2000 top and 2002 bottom was 6,483 3-DV UNITS. When you combine both values together you end up with a value of 18,315 3-DV UNITS. The move took 9 years.
- The up move between 2002 bottom and 2007 top was 10,156 3-DV UNITS. The down move between 2007 top and 2009 bottom was 8,137 3-DV UNITS. When you combine both values together you end up with a value of 18,293 3-DV UNITS. The move took 7 years.
To summarize, the combined move took 16 years and there was only 22 3-DV UNITS of variance between two sections. This variance over the 16 year period of time can be attributed to as little as 2 trading days and a few hundred points on the Dow. This example alone should put to rest all claims that the stock market is random and unpredictable. Once again, when we identify the exact structure of the stock market through using our 3-Dimensional analysis we can time the market with great precision.
For example, if we understand the structure above we know that the move between 2002 bottom and 2009 bottom will be identical in 3-DV UNITS of the move between 1994 bottom and 2002 bottom. Just by having this information alone one should be able to figure out the stock market with great precision. Further, once we have hit the 2007 top on the DOW, any analyst using this technique knows that the upcoming down move will be exactly 8,127 3-DV UNITS. (18283-10156=8,127)
That would mean that once the 2007 top is confirmed you would know exactly where the market would bottom. So, while everyone is freaking out in the late 2008 and early 2009 you are either shorting the market and making a lot of money or you are setting yourself up for the upcoming bull market that you know will start in March of 2009. Same thing or calculations apply to the December 31st, 2013 top on the Dow Jones.
I hope this clearly illustrates how powerful this type of an analysis can be. Again, once the market structure is fully understood you would know not only where but WHEN the market would turn.
So, what does the future hold…….will we get another bounce (buy the dip) or is this sell-off just getting started?
Well, my mathematical and timing work clearly shows a severe bear market between 2015-2017. In fact, when it starts it will very quickly retrace most of the gains accrued over the last few years. If you would be interested in learning when the bear market of 2015-2017 will start (to the day) and its internal composition, please CLICK HERE.
(***Please Note: A bear market might have started already, I am simply not disclosing this information. Due to my obligations to my Subscribers I am unable to provide you with more exact forecasts. In fact, I am being “Wishy Washy” at best with my FREE daily updates here. If you would be interested in exact forecasts, dates, times and precise daily coverage, please Click Here). Daily Stock Market Update. April 17th, 2015 InvestWithAlex.com
Did you enjoy this article? If so, please share our blog with your friends as we try to get traction. Gratitude!!!

How It Was Possible To Predict Today’s Stock Market Bloodbath Google