
As they say……sometimes a picture is worth a thousand words. As is the case here.
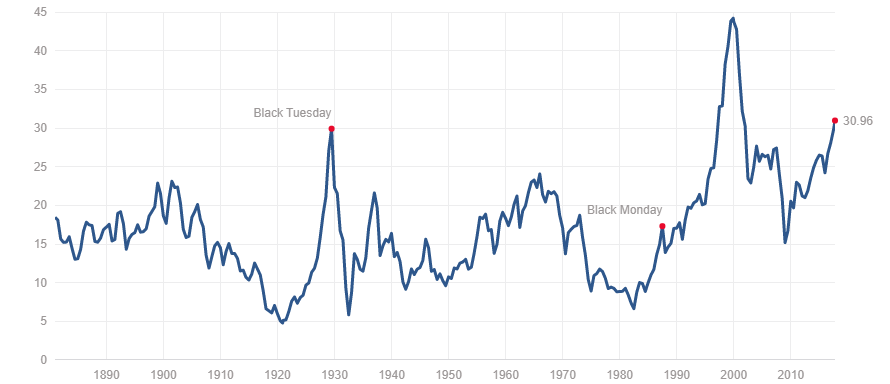
Chart #1 is self explanatory. Most retail investors (dumb money) have never been this bullish. And while they might be on to something, at least historically, the odds are stacked against them.  Chart #2: I have beaten this chart to death by now, but it is worth repeating. Today we are sitting at the highest valuation level in the stock market’s history. Higher than 1929 and arguably higher than 2000 top (if we make an adjustment for lack of tech earnings at that time).
If you will note, the bull markets of 1914, 1932, 1949, 1982, etc….have all started from incredibly low valuation levels. With P/E ratios being in 5-10 range. That is to say, those who expect this stock market to continue to surge higher, with a P/E of 31, are betting on an outcome that would be unprecedented in the stock market’s 230 year history. But, what do I know….
In terms of the stock market, the situation is incredibly complex. If you would like to find out what happens next, based on our mathematical and timing work, please Click Here.