BioTech ETF (IBB) Is Scheduled To Do The Following…..

We just updated our MegaCap analysis with IBB

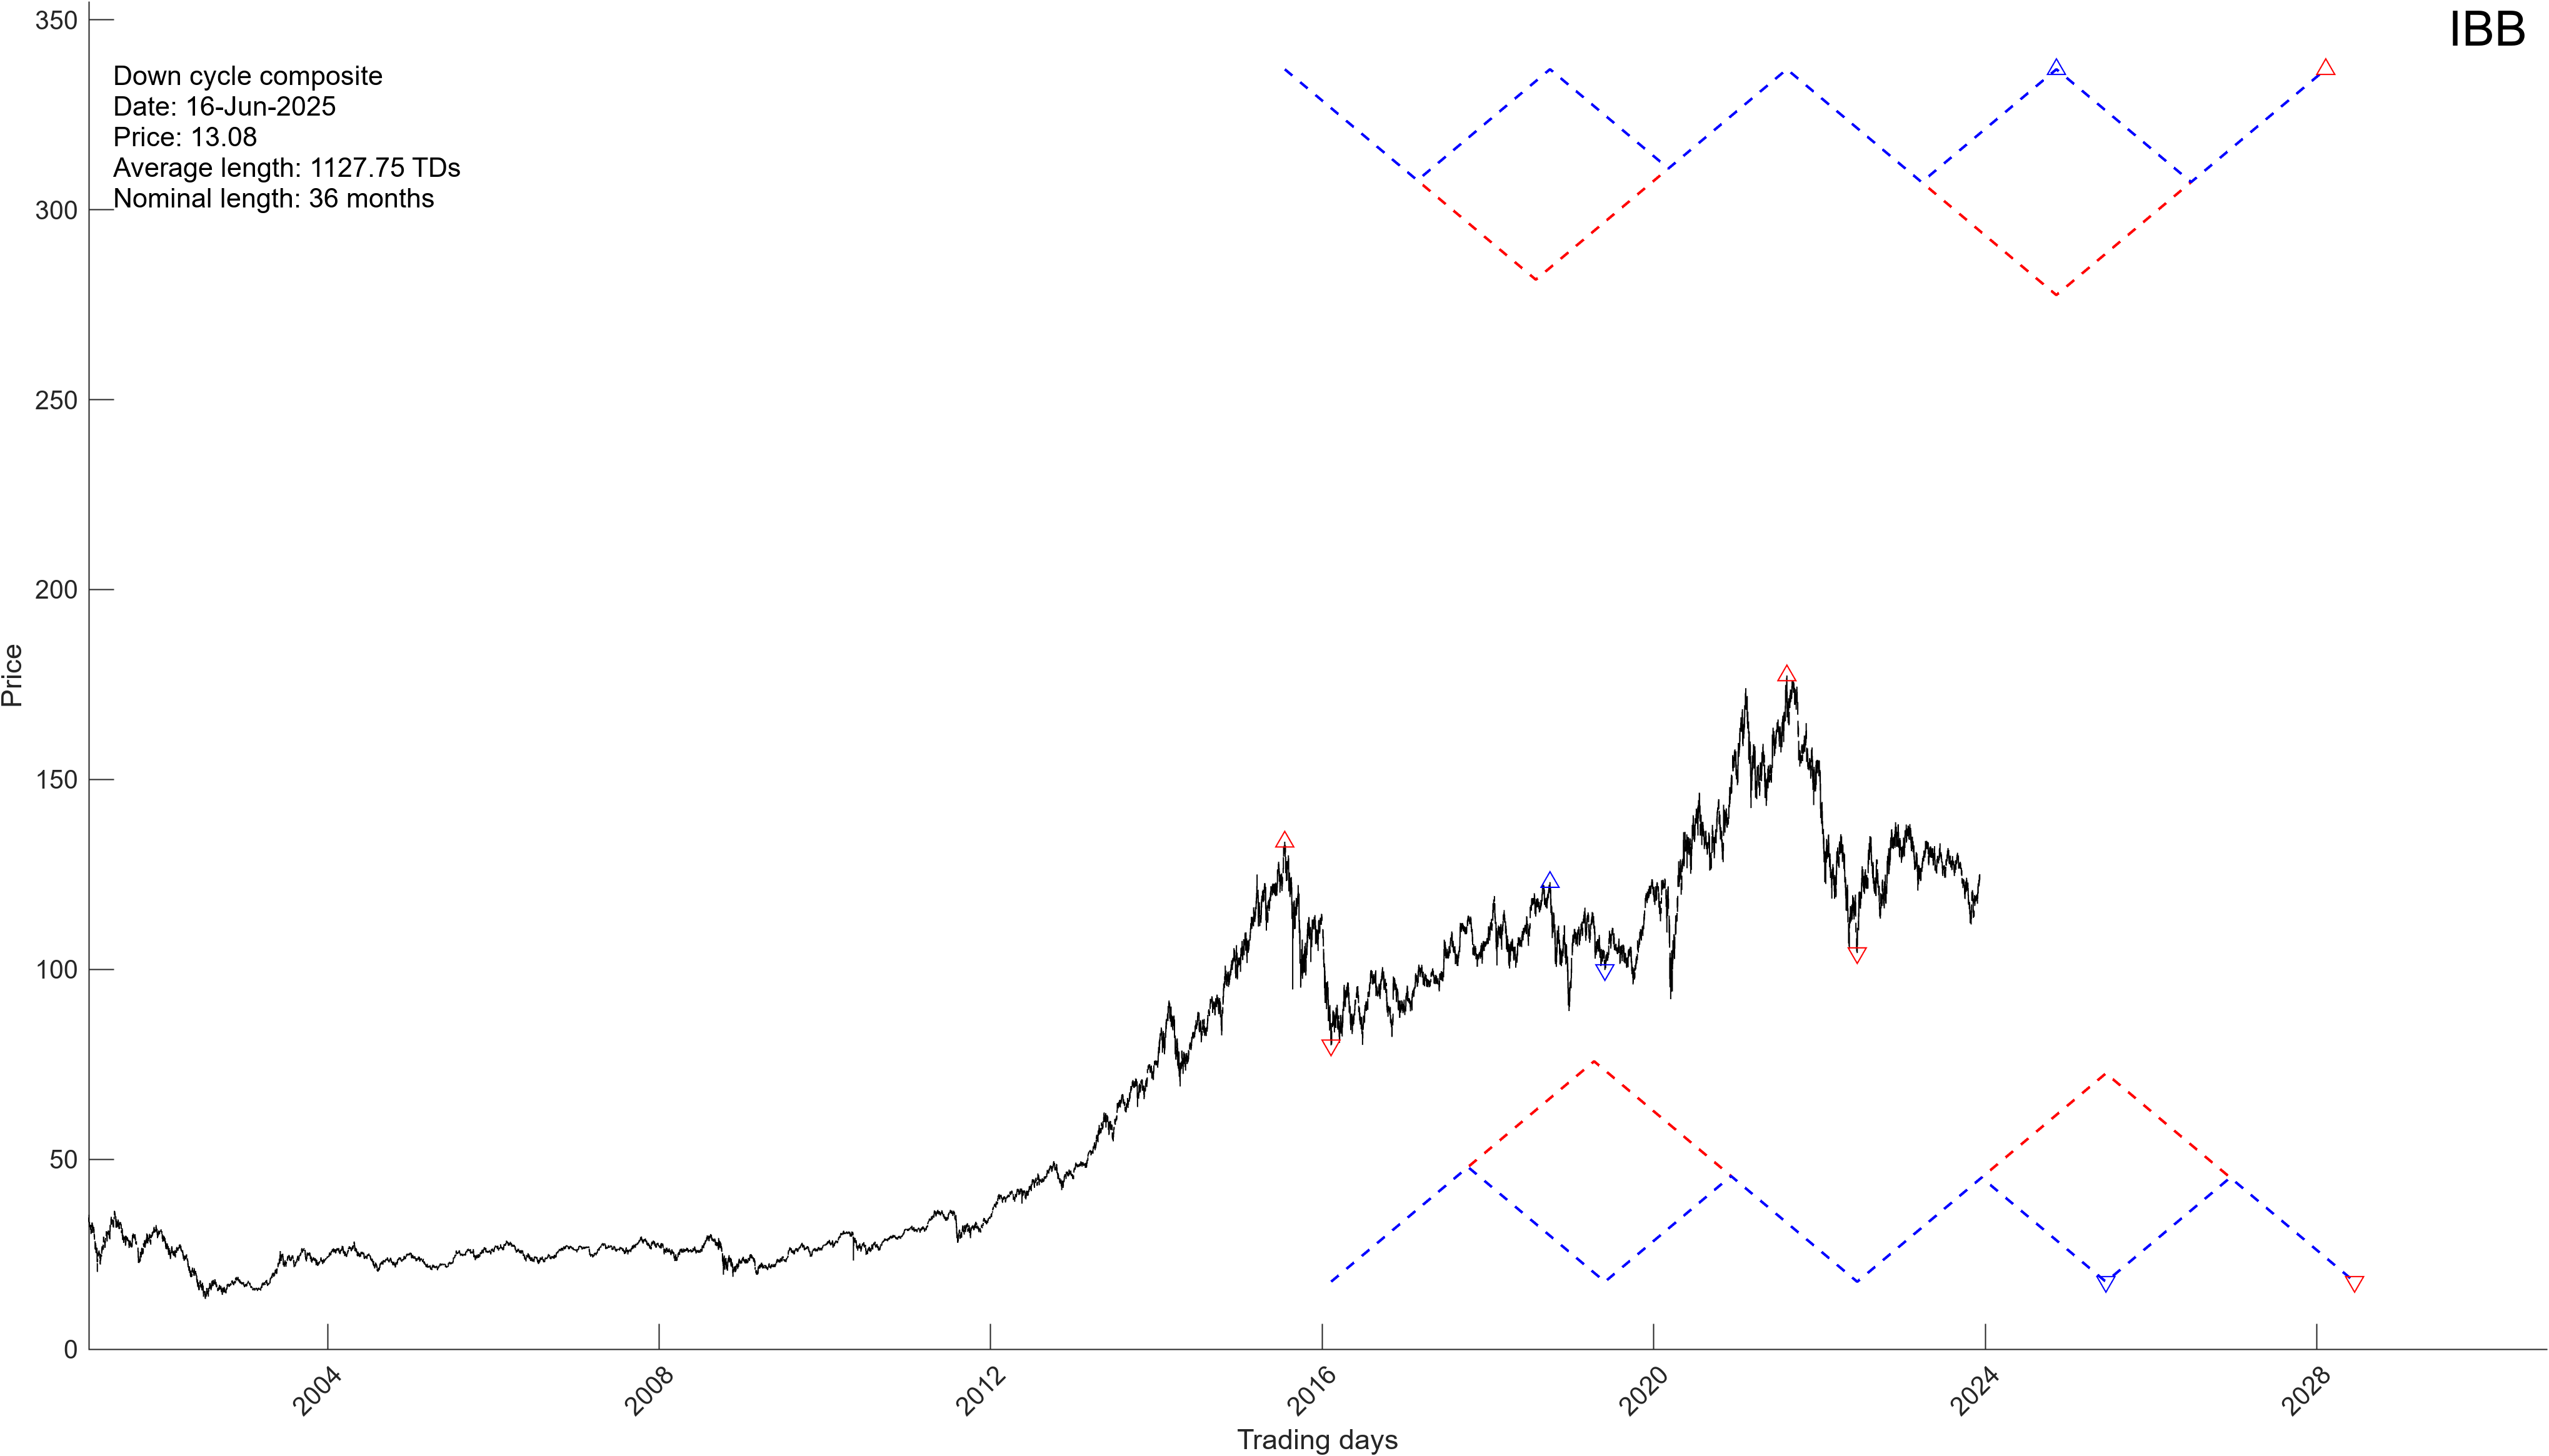
Biotechnology ETF (IBB)
Date of Analysis: December 12th, 2023

Our mathematical and timing analysis for IBB shows the following……

      • Our cycle composite analysis suggests the bottom is in for IBB as of June of 2022 low of $104.
      • The ETF is now scheduled to increase into its next mid-cycle top scheduled to arrive in XXXX. At this point our mathematical calculations suggest a price target of $XXX (+/- $2) for this top.
      • Once the top is put in place IBB should fall into its next cycle bottom scheduled for XXXX.
      • Our price target for this proposed bottom is located at $XXX (+/- $2).

In summary, IBB is scheduled to increase into the end of XXX. Then collapse into June of XXXX. This stock represents a “fast move” opportunity between XXXX top and XXXX bottom where a move of 50%+ is likely.

If you would like to find out exactly what IBB will do, in both price and time, and with exact time/price targets, please Click Here

The Market Continues To Perform Just As Anticipated

Back in the early second half of 2022 most people laughed at our October 10th (+/- 2 trading days) bottom projection. A bottom? Most investors were doom and gloom at the time.

Now, the situation is kind of reversed.  I say “kind of” because most investors I know are kind of in disbelief that despite today’s fundamental factors and the overall state of the economy the market keeps climbing higher. So much so that quite a few people I know have given up on trying to figure out what the stock market will do next.

In our opinion the setup is rather simple and something that we have maintained for well over a year. In other words, the market is developing as it should. If you would like to find out what happens next, in both price and time, please Click Here 

If you would like to find out what the stock market will do next in both price and time, long-term and short-term, please Click Here.  You can also find our MegaCap Stocks Time/Price Projections and our Fast Movers at the same link.

This NEW Fast Mover Is About To Fly

Do you recognize this chart? 

If you do, great. This stock is about to bottom and then surge 100%+ within a relatively short period of time. If you would like to find out what this stock is, as well as its exact associated TIME and PRICE targets, please Click Here 

If you would like to find out what the stock market will do next in both price and time, long-term and short-term, please Click Here.  You can also find our MegaCap Stocks Time/Price Projections and our Fast Movers at the same link.

How To Figure Out Exactly Where, In Both Price & Time, The Stock Market Will Top Out

It has long been our claim, now proven, that as the stock market develops it traces out an exact geometrical structure or mathematical pattern. Not that dissimilar to what we witness when we look at the DNA structure. 

For example, charts below represent the Dow Jones’ mathematical composition on long-term, mid-term and short-term basis. Please note, depending on the time scale we are looking at, the Dow projects a unique set of completion points or PRICE levels. 

Please note: TIME variable below is displayed for educational (not forecasting) purposes. 

The trick is combining multiple mathematical time frames together and subsequently making a projection of where these multiple time frames intersect. It is at that math intersection point that the market is scheduled to finally top out.

Now, when we add other timing and mathematical tools, including short-term, we can narrow down the time window even more. Sometimes to the hour and +/-100 points on the Dow. 

If you would like to find out what the stock market will do next in both price and time, long-term and short-term, please Click Here.  You can also find our MegaCap Stocks Time/Price Projections and our Fast Movers at the same link.