Most market participants see Nasdaq and IBB distribution over the last 7 days as nothing more than another buying opportunity. Case and point, Chad Morganlander of Stifel’s Washington Crossing Advisors. He isn’t worried, according to him…..
- “The P/E (price-to-earnings) multiple for 2014 on the NASDAQ 100 is roughly about 18 times, that’s going off a growth trajectory of earnings of roughly about 17% and revenue growth expectations of roughly 7%. So, this slice of the market, the NASDAQ 100, has the get-up-and-go that justifies the valuation.”
- “We think Cisco, Oracle, and Microsoft with those companies, you see consistent earnings growth,”
- “You see balance sheets that have a tremendous amount of cash with very little debt. And, also, they have this viability to them that we believe in the coming years will make the markets go higher.”
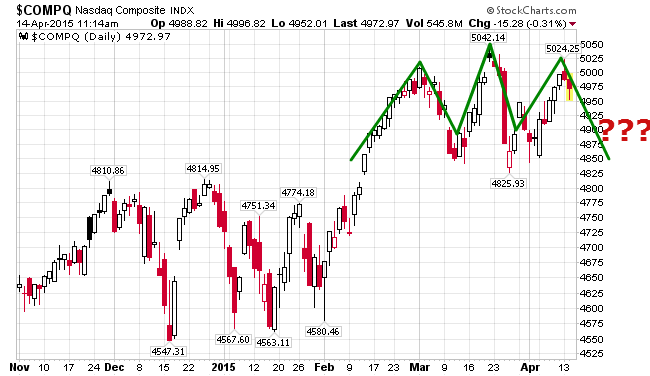
Big mistake Chad. You can put your “fundamental” blinders on, but you cannot escape the reality of what is to come over the next few months/years. As a “value oriented fundamental analyst” I thought I would never say this, but in today’s market, fundamentals are irrelevant. They have been distorted by the FED’s credit infusion and cannot be considered valid. Instead, one should concentrate on technical analysis to try and ascertain the future. What technical analysis indicates for the NASDAQ is not good by any measure.
Yet, you can go even further. As our mathematical and timing work (much more advanced than technical analysis) indicates, the bear market of 2014-2017 is just around the corner. When it starts it will slam the Nasdaq harder than most other indices. If you would like to find out exactly when the bear market will start (to the day) and it’s internal composition, please Click Here.

Did you enjoy this article? If so, please share our blog with your friends as we try to get traction. Gratitude!!!

Click here to subscribe to my mailing list
Bullish Nasdaq Delusion Google
Some big names in the tech-heavy NASDAQ Composite index are getting smacked around this month.
The hits are being felt by a wide-range of NASDAQ companies. There are the upstarts like Netflix, which lost 17% since the start of March, and Tesla, which is down 10% this month. And there are the Internet giants like Facebook (down 5%) and Google (down 4%). And, the ETF tracking NASDAQ’s biotech companies, the IBB, is down 10% this month as well.
Portfolio manager Chad Morganlander of Stifel’s Washington Crossing Advisors isn’t worried about this month’s decline many of the NASDAQ’s large cap stocks mega cap stocks.
“The P/E (price-to-earnings) multiple for 2014 on the NASDAQ 100 is roughly about 18 times,” says Morganlander about the index of the largest 100 non-financial NASDAQ stocks. “That’s going off a growth trajectory of earnings of roughly about 17% and revenue growth expectations of roughly 7%. So, this slice of the market, the NASDAQ 100, has the get-up-and-go that justifies the valuation.”
Morganlander is particularly optimistic about companies large cap NASDAQ companies like Cisco, Oracle, and Microsoft. “We think with those companies, you see consistent earnings growth,” says Morganlander.
“You see balance sheets that have a tremendous amount of cash with very little debt. And, also, they have this viability to them that we believe in the coming years will make the markets go higher.”
Talking Numbers contributor Richard Ross, Global Technical Strategist at Auerbach Grayson, believes the technicals are more pessimistic than Morganlander’s fundamental analysis.
Ross sees the fund that tracks the NASDAQ, the PowerShares QQQ, as having traded in an upward-sloping trend channel for the past nine months, with the 100-day moving average serving as its support. However, the QQQ recently showed a rounded top pattern.
“That’s a sign of distribution,” says Ross. “When that distribution comes at the tail-end of a five-year bull market, you want to look out here.”
The QQQ closed at $88.51 on Tuesday. According to Ross, a break below the 100-day moving average, currently at $86.79, means the next support level is at the 200-day moving average, now at $81.55.
“That’s a significant move down and it could come in a hurry,” says Ross