Is Warren Buffett Shorting Everything?

PE Ratio

The chart above is as clear as night and day. Based on the adjusted P/E ratio, the stock market is more expensive today than it was at 1907, 1937, 1966 and 1987 tops. Just as expensive as it was at 1929 and 2007 tops. Only 2000 top stands above (due to the tech bubble and no earnings – it can be discounted away).

Now that I think about it, I am a little confused. I haven’t heard from a single value investor, or so called value investors, that the stock market is overvalued. David Stockman tends to agree.

David Stockman: ‘There Are No Markets, Just a Raging Casino’

“There are no markets left in any meaningful sense of the word, just a raging casino infected with the madness of the crowds and the central bank pied pipers who mesmerize them,” he writes on his blog.

Well said and I couldn’t agree more. Benjamin Graham must me spinning in his grave right about now. The only remaining question is, what is Warren Buffett and his disciples are up to? If they are to follow traditional Graham & Dodd valuation metrics, they should be completely out of the market by now. If not 100% short.

And while Warren Buffett’s corporate structure makes that impossible, the rest of the so called value investors should start asking this very same question.

z33

Is Warren Buffett Shorting Everything? Google

Is Today’s Excessive Bullishness Warranted?

Daily Chart April 27 2015

4/27/2015 – A down day with the Dow Jones down 41 points (-0.23%) and the Nasdaq down 32 points (-0.63%)

I would hate to poop on everyone’s parade, BUT the Dow is still sitting well bellow its March 2nd top, IBB is collapsing and I can still argue that we have been in a period of distribution or consolidation since July of 2014.

So, why is that I get the same feeling I had at 2007 top? For instance, Stocks can handle whatever the Fed throws at them

Wow, apparently everything is coming up roses and this market is getting ready to surge higher. That’s one way to look at things. And the other? How a $17 Trillion Bull Market Falls Short Relative to Past

“I look at U.S. stocks as very fully priced,” said Robert Arnott, the chairman of Research Affiliates in Newport Beach, California, and a pioneer in the field of fundamental indexing. About $170 billion is managed using his firm’s investment strategies. “Do I view them immediately vulnerable and dangerous? No. I view them dangerous for long-term investors.”

Now we are getting somewhere. I only have one problem with the statement/article above. “Not immediately vulnerable and dangerous….only for long-term investors?”. Based on my work the stock market can correct in one of two ways. A prolonged decline, similar to what we have experienced on the Dow between 2002 and 2003. Or, a quick drop followed by a prolonged period of consolidation. For instance, 1937.

That is to say, today’s stock market environment, given all of the things I talk about on this blog, is about as dangerous as you can imagine. So much so that investors might see a rapid 20-30% correction in a matter of months. And in an environment where most investors truly believe that such an adjustment is impossible, well, that could be a devastating move for quite a few people.

This conclusion is further supported by my mathematical and timing work. It clearly shows a severe bear market between 2015-2017. In fact, when it starts it will very quickly retrace most of the gains accrued over the last few years.  If you would be interested in learning when the bear market of 2015-2017 will start (to the day) and its internal composition, please CLICK HERE.

(***Please Note: A bear market might have started already, I am simply not disclosing this information. Due to my obligations to my Subscribers I am unable to provide you with more exact forecasts. In fact, I am being “Wishy Washy” at best with my FREE daily updates here. If you would be interested in exact forecasts, dates, times and precise daily coverage, please Click Here). Daily Stock Market Update. April 27th, 2015 InvestWithAlex.com

Did you enjoy this article? If so, please share our blog with your friends as we try to get traction. Gratitude!!!

Is Today’s Excessive Bullishness Warranted?  Google

The FED To Investors: Expect Panic And Illiquidity

Daily Chart April 23 2015

4/23/2015 – Another up day with the Dow Jones up 21 points (0.11%) and the Nasdaq up 21 points (0.41%)

The stock market continues to behave as anticipated. If you would like to find out what happens next, please click here. 

You know the bubble is getting out of control when even the FED is warning investors about today’s high risk environment.

Market liquidity drought raises alarm bells inside Fed

Sections of the U.S. financial system that may be vulnerable to investor panic are raising concerns inside the Federal Reserve, as policymakers preparing for the first interest-rate hike in nearly a decade seek to ensure the market is ready and able to handle it whenever it happens.

Liquid markets could quickly turn illiquid in response to a shift in Fed policy or some other shock, which could amplify any adverse market response, as occurred during the taper tantrum.

In other words, investors continue to play chicken with the FED. Here is one thing most investors are forgetting. Given recent all time highs on most major indices, the volume has been declining. This is atypical and suggests that the stock market is already illuquid. I wrote about it before Top Hedge Fund Manager: No Liquidity, Stock Market Shock Is Imminent

Does that mean we are about to experience the repeat of 2007-2009? Not likely in terms of magnitude of the move, but it is quite possible that any upcoming correction will be violent.

This conclusion is further supported by my mathematical and timing work. It clearly shows a severe bear market between 2015-2017. In fact, when it starts it will very quickly retrace most of the gains accrued over the last few years.  If you would be interested in learning when the bear market of 2015-2017 will start (to the day) and its internal composition, please CLICK HERE.

(***Please Note: A bear market might have started already, I am simply not disclosing this information. Due to my obligations to my Subscribers I am unable to provide you with more exact forecasts. In fact, I am being “Wishy Washy” at best with my FREE daily updates here. If you would be interested in exact forecasts, dates, times and precise daily coverage, please Click Here). Daily Stock Market Update. April 24th, 2015 InvestWithAlex.com

Did you enjoy this article? If so, please share our blog with your friends as we try to get traction. Gratitude!!!

The FED To Investors: Expect Panic And Illiquidity Google

Scary: Is The Nasdaq Building A Head And Shoulders Pattern?

Technicians often fear the head and shoulders pattern as it entails trouble ahead. So much so that the pattern often shows up right before some sort of a big decline starts. With that in mind, the Nasdaq might be developing one right now. Take a look at the chart below and decide for yourself. At the very least, pay attention. Just FYI.

nasdaq head and shoulders

Z31

Scary: Is Nasdaq Building A Head And Shoulders Pattern? Google

Is The Market Top In?

Daily Chart January 22 2014

Summary: Continue to maintain a LONG/HOLD position.  

1/22/2014 – ALERT.  My additional work suggests that the DOW topped out on December 31st, 2013. I will explain further over the next few days. In the meantime this doesn’t impact our trading position. We must wait for a confirmation. 

Another slow day in the market with the Dow finishing -41 points (-0.25%) while NASDAQ was up 17 points or (+0.41). This further amplifies the divergence between the indices since the start of the year and is exactly what I was talking about in my earlier updates. YTD the Dow is down -1.23% while NASDAQ is up 1.6%. While not a significant divergence it is yet another confirmation that the market is topping. Further, while the cyclical composition of the DOW might have already topped out, the cyclical composition of NASDAQ is yet to reach its point of force. As you know, the most speculative issues tend to top out last. 

The bottom line is, the market is topping here. While this doesn’t impact our existing position, we must be ready to go short at the moments notice. 

Did you enjoy this article? If so, please share our blog with your friends as we try to get traction. Gratitude!!!  

Is The Market Top In? 

Why Does Goldman Sachs Hates Your Money?


CNBC Writes: ‘No bubble troubles’ in stock market, declares Goldman Sachs


goldman sachs investwithalex

Goldman Sachs thinks talk of financial bubbles is misguided, and the firm is encouraging its wealthy clients to keep their money in relatively expensive sectors such as U.S. technology stocks and high-yield bonds.

“Stay fully invested—we don’t have bubble troubles yet,” Sharmin Mossavar-Rahmani, chief investment officer for the bank’s investment strategy group, said at a press briefing in New York last week.

The firm likes several relatively pricey sectors. One is U.S. technology stocks, based on strong corporate free cash flows and prospects for corporate earnings growth. The Dow Jones U.S. Technology Index has gained about 141 percent over the past five years. 

Maybe Goldman Sachs clients are too rich for their own good and are in need of a good haircut. That is exactly what they are going to get if they listed to Sharmin Mossavar-Rahmani. Instead of being risk averse she wants them to pile into highly speculative Tech stocks? You can’t make this stuff up.

The article continues,  “But she reiterated the four reasons Goldman believes equities are not in bubble territory, as outlined in a recent strategy report: Credit growth is not excessive; investors are just beginning to get back into U.S. stocks; views on the U.S. are not yet overly bullish; and stock valuations have not raced too far ahead”.

Let’s take a look at each point individually.

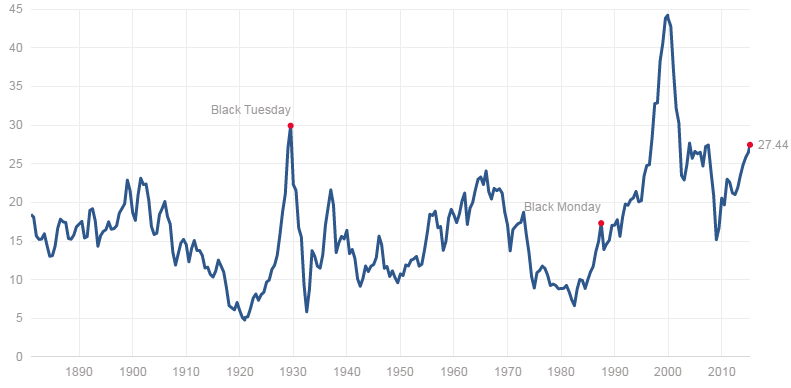
1. Credit Growth Is Not Excessive.  Are you kidding me? Total market debt as a % of GDP stands at 370%.  The highest in the history of mankind. As a reference point, 1929 this same indicator was at just 280% of GDP. We all know what happened thereafter. Plus, the FED is printing/monetizing $85 Billion per month to add liquidity to the market. There are credit bubbles everywhere (mortgage, student loans, credit cards, even car loans) and Goldman Sachs has the balls to claim that credit growth is not excessive? Unbelievable. 

2. Investors are just beginning to get back into US stocks: I am not sure what “investors” she is talking about, but the market is up over 150% in 5 years. If they are getting back in “just now” they are dumb and this should be used as a contrary indicator.   

3. Views on the US are not yet overly bullish: Once again, views by whom? If you take a look at the bullish sentiment indicator, it is sitting close to an all time high. That is above 2000 and 2007 levels. Plus, everyone (media, financial advisors, investors, etc…) are falling all over each other while predicting the market to go up in 2014. As far as I am concerned you can’t get more bullish than this.

4. Stock Valuations have not raced too far ahead: “Too Far” is the keyword. In a sense, Sharmin is admitting that valuations are indeed high. While this point is debatable based on your valuation metrics, personally, this market is incredibly expensive. At today’s prices I cannot find too many things (if anything) to invest in. 

The bottom line is as follows. The arguments Goldman Sachs makes are nonsense and without merit. Investors must clearly understand that before making their investment decisions. As I have said so many times before, my timing/mathematical work indicates a contrary position. The bear market is about to start and it will wreck havoc on the financial markets over the next 3 years. AKA….its time to protect yourself instead of buying up tech stocks.  

Did you enjoy this article? If so, please share our blog with your friends as we try to get traction. Gratitude!!!   


Daily Stock Market Update, January 17th, 2014

Daily Chart January 17 2014

Summary: Continue to maintain a LONG/HOLD position.  

01/17/2014 – Slow day in the market. While the S&P and NASDAQ were both down to the tune of -0.50%, the DOW inched up 40 points or (+0.25%). As mentioned yesterday, the DOW closed the “DOWN GAP” that was originated on Thursday during the trading day today. We continue to be stuck in the trading range since the beginning of the year. According to my work this has to do with a number of cycles topping out on or around January 1st of this year. In other words, the powerful rally we have witnessed in the late 2013 is running out of steam. While the trend is still Bullish the market is starting to exhibit signs of a fatigue and an eventual roll over. Still, as of today, it is prudent to maintain our long position while we wait for a confirmation. Weekly summary coming up tomorrow.   

Daily Stock Market Update, January 16th, 2014

Did Bernanke Predict The Stock Market Crash?

bernanke meme

AP Writes: Bernanke likens ’08 financial crisis to car crash

WASHINGTON (AP) — In his final public appearance as chairman of the Federal Reserve, Ben Bernanke took a moment to reflect on the 2008 financial crisis and compared it to surviving a bad car crash.

During an interview Thursday at the Brookings Institution, Bernanke recalled some “very intense periods” during the crisis, similar to trying to keep a car from going over a bridge after a collision.

The government had just taken over mortgage giants Fannie Mae and Freddie Mac. Lehman Brothers had collapsed. He recalled some sleepless nights working with others to try and contain the damage.

“If you’re in a car wreck or something, you’re mostly involved in trying to avoid going off the bridge. And then, later on, you say, ‘Oh my God!'” Bernanke said.

Read The Rest Of The Article Here

An innocent car crash Mr. Bernanke? Just an accident? I guess that’s one way to look at it. There is another. How about getting so drunk that you drive your car into a pole.  

Of course, the above is an analogy for using entirely too much credit to propel our financial system and our underlying economy right after the Tech crash. As we know, that led to the housing bubble, the stock market bubble and the credit market bubble that all blew up in 2007-09. Now, you can’t blame Mr. Bernanke for that. For the most part, another “brilliant economist” under the name of Mr. Greenspan was responsible for the financial collapse we have all suffered during that time.

You can, however, blame Mr. Bernanke for what happened between 2007 and today. It seems like he took Mr. Greenspan’s playbook, squared it and then multiplied it by 100. By pumping a tremendous amount of credit into the system since the market meltdown of 2007-09 Mr. Bernanke upped the ante for any reasonable resolution to our current financial issues.

Make no mistake………..the current stock market, real estate and economic recovery has very little to do with the underlying fundamental economy and everything to do with massive infusion of credit into the financial system by the FED.

It is a speculative illusion at best. When the credit card is finally maxed out, there will be hell to pay. Based on my mathematical work we are just a few short months away from the start of the bear leg. Get yourself ready.

Did you enjoy this article? If so, please share our blog with your friends as we try to get traction. Gratitude!!!