The Composition Of 2000 -2017 Bear Market

nasdaq

Continuation from yesterday…….(Short-Term Cyclical Composition Of The Stock Market)

Once the 2000 top was reached the market was doomed to repeat the next secular bear market cycle ending in 2017. This bear market was kicked into high gear with a sell of 2000-2002, during which the Dow lost 40% of its value and the Nasdaq crashed 80%. The initial sell off was followed by an exact 5 Year and 1 trading day bull market cycle. Terminating on October 11th, 2007.

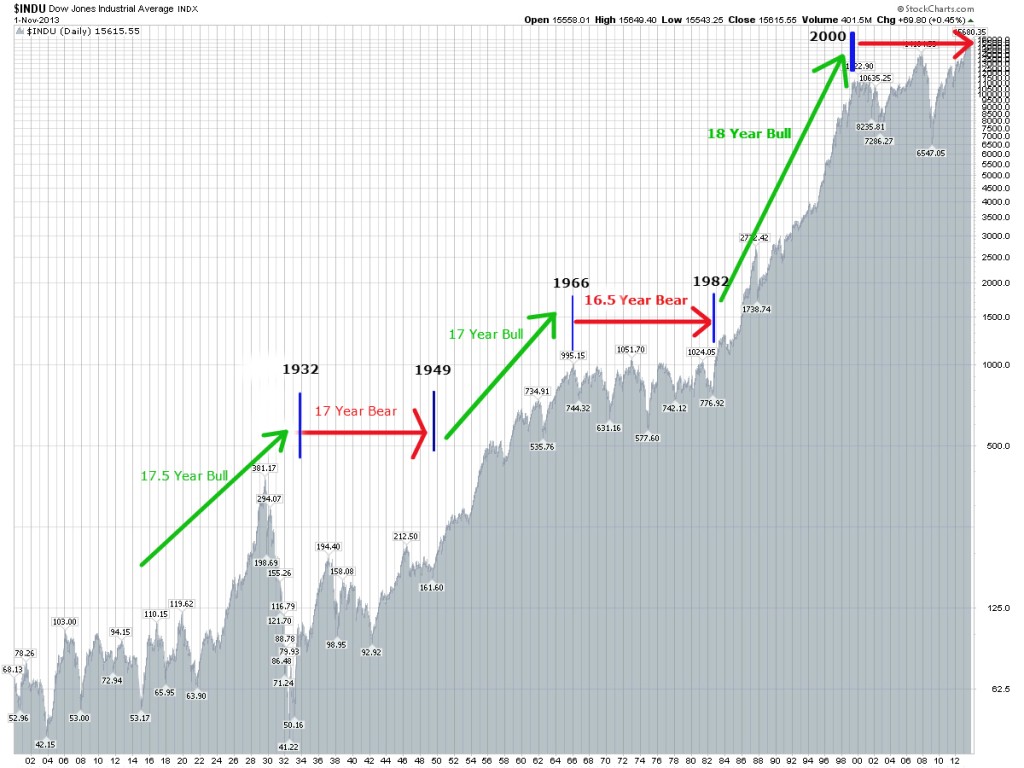
What followed was a mid-cycle sell off of 2007-2009. Such sell offs typically represent the fastest and the deepest moves down during any secular bear market cycle.  We saw the same mid cycle sell offs develop in all previous bear markets.  For instance, the crash of 1907 was the mid cycle panic of 1899-1914 bear market, the crash of 1937 was the mid cycle sell off of 1929/32-1949 bear market and the massive sell off of 1972-1974 was the mid cycle point of 1966-1982 bear market.

When the mid cycle panic bottom was reached in March of 2009 the market turned around to stage the next 5 Year rally of 2009-2014. Thus far, this 5 year bull market cycle has lasted 5.5 years, the longest since the 5.5 year cycle of 1924-1929. Leading many to conclude that a secular bear market ended in 2009 and we are now in a long-term bull market.

Unfortunately, there is no evidence that secular bear markets last only 9 years. On the contrary, since the stock market first started trading in May of 1790 all bull/bear market cycles repeated in a clearly defined 15-20 year patterns. Today’s environment is not very different. In fact, most bear markets end with 2-3 year bear legs.  For example, 1912 to 1914, 1946 to1949 and 1980 to 1982. When we combine this information with the overall composition of the stock market described earlier, it becomes clear that a bear leg of 2014-2017 is essentially imminent.

Once again, the cyclical composition background above in necessary for understanding today’s environment and its application to various investments strategies one could have implemented during the time.

In November of 1994 (our starting bottom) the Nasdaq was trading at approximately 720. Let’s now take a look at 3 different outcomes or investment strategies to determine which one was the best.

Investment Strategy #1: Buy and Hold. (Middle Path).

If you would have invested in November of 1994 and held though today (September of 2014 with the Nasdaq is at 4,500), you would have generate a ROI of 525%. Representing an annualized compounded rate of return of approximately 9.5%. Not bad.

However, if we are to account for an upcoming bear market of 2014-2017, in the best case scenario the Nasdaq ends at 3,000 by 2017. Yielding a ROI of 316% or just 6.5% a year. Still not bad, but it seriously underperforms buying and holding a 30-Year US Treasury Bill that was yielding 8% in November of 1994.

To Be Continued Tomorrow…….

z32

The Composition Of 2000 -2017 Bear Market Google

Cyclical Composition Of The Stock Market

Long Term Dow Structure3 Continuation from yesterday……(Buy Low, Sell High, Go Short & Cover Case Study)

  • 17 Year BEAR Market (1932 bottom to 1949 bottom): The cycle originated at the bottom in July of 1932 and lasted until June of 1949. During this period of time we had a post great depression bounce, 1937 crash and the World War 2. Yet, despite the overall upward trajectory, this clearly defined 1949 bottom remained 60% below its 1929 top and well below both its 1937 and 1942 tops.
  • 16.5 Year BULL Market (1949 bottom to 1966 top): The market surged higher between 1949 bottom and 1966 top. This was the so called “Golden Age” of post war reconstruction and the American industrial boom. During this time the Dow appreciated over 500% in a clearly defined bull market cycle.
  • 5 Year BEAR Market (1966 top to 1982 bottom): The market stayed relatively flat during this period of time with a few notable declines of 30-50%. With the 1972-1974 mid cycle decline of 54% being the largest one.  This clearly defined bear market completed in August of 1982. Approximately 25% below its 1966 top.
  • 17.5 Year BULL Market (1982 bottom to 2000 top): A very well known period and a clearly defined bull market. The market surged higher from its August of 1982 bottom to reach its historic top in January of 2000. During this time the Dow appreciated over 1,400% in one of the strongest bull markets in history.
  • 17 Year BEAR Market (2000 top to 2017 bottom): Even though the market is sitting at an all time high (as of this writing in September of 2014) and even though most people have assumed that the new bull market has started, in relative terms the market hasn’t appreciated very much since its top in 2000. The Nasdaq is still down. Plus, with the final down leg of this bear market being ahead of us (based on my mathematical and timing work), a BEAR market of 2000-2017 should complete itself in a negative territory or below its 2000 top.

It is important to note that the small variation (of +/- 1 year) in duration of these cycles is caused by smaller or larger cycles arriving at the same time.  Please note, the stock market is an incredibly complex entity that requires much further explanation. If you would be interested in learning how the stock market works behind the scenes I would highly recommend my other book Timed Value for your consideration.

To Be Continued Tomorrow…….

Z31

Cyclical Composition Of The Stock Market Google

Buy Low, Sell High, Go Short & Cover Case Study

nasdaq

Continuation from Friday…….(Buy Low, Sell High, Go Short & Cover Summary)

The premise is very simple. We will study the Nasdaq between 1994 bottom and today in order to determine how various investment strategies would have performed during the time. In order to initiate the process we must first have a clear understanding of exactly where we were in the cyclical composition of the stock market back in 1994, where we are today and what had transpired in between.

In my previously published book Timed Value a considerable amount of time was spent on discussing two powerful cycles that tend to rule the overall stock market since it began trading in May of 1790. These cycles are the 17-18 Year alternating Bull/Bear cycle and one completed growth unit within the stock market, most commonly represented by a 5 Year Cycle.  Let’s now take a closer look at both, starting with a bull market cycle of 1914-1932.

THE 17-18 YEAR CYCLE IN THE STOCK MARKET:

  • 17.5 Year Bull Market (1914 bottom to 1932 bottom): The previous bear market terminated in July of 1914. At that time the US stock market shut down for World War 1. The stock market remained closed between August of 1914 and December of 1914 (a very rare occurrence). When the market finally reopened in December of 1914 it immediately began a rally that would not terminate until October of 1929. Followed by a now famous 1929 stock market crash and a massive 90% 3 year decline. The cycle terminated at the bottom in 1932, completing the 17.5 year bull market cycle at that time.

*Note: It is important to address the 1929-1932 bear market and its impact on the overall 1914-1932 Bull Market cycle. It is a complex matter to discuss without sufficient background or understanding, but the final (short-term) structural composition of this Bull Cycle inverted over the last 3 years (1929-1932). Mostly due to a massive rally between 1924-1929 and a number of down cycles converging on this time period at the same time.  Regardless, the overall cycle lasted 17.5 years.

To Be Continued Tomorrow…….

Z30

Buy Low, Sell High, Go Short & Cover Case Study Google

The Reason Most People Buy High and Sell Low

Continuation from yesterday……(Buy Low, Sell High, Go Short & Cover)

Warning Signs:

  • Most long-term bull market cycles do not last longer than 5 years. Today’s bull market has been in existence since about March of 2009 or 5.5 years. Suggesting that the market might be topping.
  • Monthly charts show a possible period of distribution that started in January of 2014. In other words, the market has shifted from a fast moving bull market into a flat market. Suggesting a possible near term roll over.
  • Short-term charts suggest that the market is unable to go much higher. Let alone continue on with its bull market. Therefore, a real downtrend shift becomes likely here.
  • A massive fundamental overvaluation bubble reminiscent of 2000 and 2007 tops.
  • A secular bear market of 2000-2017 is scheduled to complete in 2017.
  • A mass psychological delusion suggesting the impossibility of a bear market at this juncture.

Determination:  Even thought all technical indicators (short-term and long-term) are still positive at the moment, the market is at a very dangerous juncture. In fact, given the warning signs above, any analyst worth his salt should conclude that the market is likely to be at the top here.  That the market is distributing prior to its eventual roll over into a full out bear market.  Not a simple correction.

As you can see, this simple analysis yields exactly where in the cycle we are and what we should do next.

Recommendation:  Any investor here should go on the highest level of alert in anticipation of a possible roll over.  All investors should be ready to liquidate their long positions at a moment’s notice and go short if their trading/investing profiles allow for it.

The following recommendations would apply to specific risk tolerance levels.

  • Low Risk: Get out of the market by liquidating all of your long positions. Remain in cash.
  • High Risk: Get out of the market by liquidating all of your long positions. Remain in cash in anticipation of a market roll over.

Upcoming investment recommendation:

  • Low Risk: Stay in cash while the market corrects. Preserve your capital and buy stocks at 30-50% discounts at the next market bottom. Profit from the next bull cycle.
  • High Risk: Be ready to go short as soon as the stock market confirms the start of a bear market leg.

The great thing about the approach above is it works in all market conditions. For instance, investors who are “long only” today or those who are unaware of our current cyclical location would simply hold their positions throughout the duration of the upcoming bear market. Just as they did between 2007 and 2009. Most likely selling at the bottom of the range as the amount of psychological distress associated with losing 30-50% will reach its pinnacle right around the market bottom.

That is why most investors do the opposite of what they should be doing. Instead of selling out and going short at today’s market top, most investors will go long due to their general unawareness, long only bias, faulty technical indicators and to be honest, stupidity.  Holding it for the duration of the decline and getting out at the bottom.  Even worst, many will go short right before the market bottoms. In other words, they will buy high and sell low.

To Be Continued Tomorrow……

Z30

The Reason Most People Buy High and Sell Low Google

Buy Low, Sell High, Go Short & Cover

Continuation from yesterday……(Why You Should Know Exactly Where You Are)

Identify The Cyclical Composition Within Your Time Frame:

Attempt to identify exactly where you are in the above mentioned cycle. Bottom, bull, top or bear. Typically, the longer the time frame you are working with the easier it is to identify exactly what part of the cycle is working in the market at the time. If you are working with short term cycles, simply understand that multiple short-term cycles will complete themselves within the confines of longer cycles. For example, one long-term completed cycle on the Dow would be a bull/bear market of 2002-2009. Yet, it was within the confines is this larger cycle that multiple short-term bull/bear moves developed at the same time. In fact, a day trader might see as many as 4-5 small daily cycles develop on a daily chart.

Identify Where In The Cycle You Are (bull or bear).       

Based on the time frames you working with, determine exactly where in the cycle you are. For instance, if you are working with weekly and monthly charts, identify if the weekly/monthly cycle is in a bull or bear market or distributing/consolidating.

Apply Other Time Frames For Confirmation:

Consider other time frames before deciding where in the cycle you are.  For instance, if you are trading based on daily charts it would be helpful to consider what weekly and monthly charts are indicating. While the market might be in a 5 day bull run or a bounce, weekly and monthly charts might suggest you are in the midst of a bear market.

Doing all of the above should give a fairly good indication of where in the cycle you are coming in. Allowing you to take an appropriate trading position in the process.

For example, today’s (September 16th, 2014) market environment presents us with a perfect analysis opportunity for the Dow Jones.  Here is the sample analysis to show you how to determine exactly where in the cycle we are and what positions or entry points are optimal.

  1. Desired Trading Time Frames:

Monthly and weekly.

  1. Cyclical Composition Within The Market On All Time Frames:
  • Long-Term: Today’s bull market started in March of 2009. The long-term term trend remains bullish for the time being. All markets are near all time highs.
  • Intermediate-Term: Monthly charts remain positive for the time being.
  • Short-Term: Weekly charts remain slightly positive. Although signs of possible distribution and downtrend shift are present.

Warning Signs:

  • Most long-term bull market cycles do not last longer than 5 years. Current bull market has been in existence since March of 2009 or 5.5 years. Suggesting that the market might be topping.
  • Monthly charts show a possible period of distribution that started in January of 2014. In other words, the market has shifted from a fast moving bull market into a flat market. Suggesting distribution.

To Be Continued Tomorrow……….

Z30

Buy Low, Sell High, Go Short & Cover Google

Why You Should Know Exactly Where You Are

Continuation From Friday……(The Circle Of Profits)

Rule #4: Know Exactly Where You Are At All Times.

By default, you should know exactly where you are at all times. Although it may not be as easy as you might imagine, particularly, if you are new to the whole process.

More or less, the composition of all stock moves can be divided into four distinct parts.

  1. Bottom formation (accumulation or trauma).
  2. Bull market.
  3. Top formation (distribution or blow off).
  4. Bear market.

Now, the composition above gets fairly complicated once we begin to add multiple time frames and structural patterns to the underlying moves.

For instance, the overall stock market might be in a 10 year bull market, yet it is about to suffer though a massive 50% correction. Or we might be in a 17 year secular bear market, yet the overall stock market might be ready to stage a massive multi-year rally. Just as it did from both 2002 and 2009 bottoms.  Further complicating the matter are the different size cycles developing in the market at any one time.  Ranging in duration from hourly to decade long. In fact, it is their eventual combination (long and short cycles) that causes the final stock market composite we see on a daily chart.

Is there a way to tell exactly where we are in the overall composition?

Yes, there is. Unfortunately, such a method cannot be described in any reasonable manner, let alone in this short book.  It can only come through years of experience and a tremendous amount of work.   Particularly, when the above analysis is applied to individual stocks.  Not to tout my market timing service, but you might want to take a look at the subscriber section of my website if this type of an analysis is of interest to you.

For the purposes of this book, we can apply the following tools or shortcuts.

Know What Time Frames You Are Working With and/or Trading:

If you are day trader, chances are, you are trading based on weekly, daily, hourly and minute charts. If you are more interested in catching larger moves, as I am, it is highly probable that you are trading based on both long-term and short-term charts. Whatever your situation might be, the first step is to define, without a shadow of a doubt, what it is that you are trading.

In other words, if you are day trading based on your daily charts, stick to that.  If you are trading based on weekly or monthly moves, continue on with that approach. Do not move between various time frames until and unless the move is permanent.  Why? It is highly probable that constant shifting between different time frames will lead to multiple errors and substantial losses.

To Be Continued Tomorrow…….

Z30

Why You Should Know Exactly Where You Are  Google

The Circle Of Profits

Continuation from yesterday…..Buy Low, Sell High, Go Short & Cover Investment Strategy Rules)

  • Always keep detailed technical charts, long-term and short-term, for all of your stocks and the overall market. These charts will tell you when stock prices are about to break down.
  • Liquidate your long positions and go short as soon as the daily, weekly or monthly trends change from bull to bear. Typically, the exact points of exit will be based on your overall trading strategy and risk profile.
  • Go short at the same time and price.

These strict rules allow us to accomplish a number of things. First, they force us to be vigilant as we continue to scan for possible market, industry or stock specific corrections.  Minimizing our risk profile in the process. Second, the rules above force us to sell our long positions at the onset of corrections.  Preventing unnecessary and at times massive losses. Finally, these rules give us the ability to profit on the downside should a significant move down develop fully.

Rule #3: Cover Your Short Positions & Go Long When Technical and Timing Indicators Confirm (Trading) 

The rules found here are the exact opposites of Rule #2.

  • Always be ready to cover your short positions and go long if technical indicators associated with the underlying securities suggest that stock prices are about to break out. No matter how bleak the underlying fundamentals are at the time.
  • Always be ready to cover your short positions and go long at bear market or correction bottoms. No matter what you believe will happen to the overall economy in the meantime.
  • Always be ready to cover your short positions and go long when the underlying stock prices have experienced massive drops and could now be considered oversold or selling well below their intrinsic value. This rule applies to all market conditions. Bull and bear.
  • Always keep detailed technical charts, long-term and short-term, for all of your stocks and the overall market. These charts will tell you when stock prices are about to break out.
  • Cover your short positions and go long as soon as daily, weekly or monthly trends change from bear to bull. Typically, the exact exit points will be based on your overall trading strategy and risk profile.
  • Go long at the same time and price.

As you can very well imagine the rules above will complete the transaction and bring us back full circle. First, the rules above will help us with identifying market or stock specific bottoms. Giving us the ability to come in and assume long positions at giveaway prices. Second, these same rules will help us find stocks that are about to surge much higher and in many cases at X multiple to the market.  Giving us a fighting chance to walk away with massive gains. Finally, the rules above force us to change course at exactly the right price and time. Removing all of the emotional aspects associated with investing out of the picture.

Here is another way to look at the proposed Rules #1-3. They create a full circle of sorts. A circle that allows you to take an initial position at or near the bottom and ride what should be a massive rally all the way up into its eventual overvaluation bubble. Only to exist and go short as the stock price begins to collapse. In other words, this setup allows you to profit on both sides of the move.  All while maximizing your returns and minimizing risk in the process.  The best part is; your initial entry point on this cycle can be at any point. For as long as you understand exactly where on this proverbial circle you are coming in.

To Be Continued On Monday…..

Z30

The Circle Of Profits Google

Buy Low, Sell High, Go Short & Cover Investment Strategy Rules

Continuation from yesterday……..(Which Investment Strategy Is The Best)

Rule #1: Buy Substantially Undervalued Securities (Minimizing Risk & Maximizing Returns).

This particular rule applies to both value and growth oriented investments. In particular, we are looking for the following stocks or situations.

  • Stocks of companies that have declined in value 50-90% over the last few months or years. At the same time, the underlying business or industry conditions suggest that the things are about to improve. In other words, recent fundamental developments might be mitigating whatever issues had caused the stock to decline so much in the first place.
  • Stocks of companies that are growing at a fast pace (large or small), yet their market valuations are well below their intrinsic values. This situation typically occurs at bear market bottoms or after sudden market crashes.
  • Stocks of companies that are turning their fortunes around with new popular products, restructuring, asset divestiture, new management, etc….. Yet, their positive efforts haven’t been recognized in the marketplace thus far.

By concentrating strictly on the above areas, we zero in on the la crème de la crème available in the stock market at any given time.  In fact, the selection criteria’s above are so stringent that investors should not be able to find that many stocks satisfying all of the requirements. Especially in aging bull markets and/or at market tops.  For instance, as of today (August of 2014) I am unable to find a single stock issue that would match up to any of the requirements above.

What do we get in return when we implement such stringent requirements?

We end up identifying individual stocks that have the highest probability of experiencing explosive multiyear and multi bagger growth in its share price. As outlined in my book The Hunt For 10 Baggers.

Rule #2: Sell & Go Short When Technical and Timing Indicators Confirm (Trading) 

As mentioned earlier, one of the biggest mistakes investors make is they don’t know when to get out. The investment industry has done a fairly good job brainwashing people into believing that the best holding period is forever. So much so that nowadays everyone is trying to follow in Warren Buffett’s footsteps.

Unfortunately, the reality is quite different. Look at almost any stock chart and you will see even the most successful companies drop 50-90% at one time or another. For some it’s a regular occurrence.   Making the “hold forever” investment premise not only obsolete, but truly foolish.  That brings us to the next set of rules.

  • Always be ready to liquidate your long positions and go short if technical indicators suggest that the stock price is about to break down. No matter how great the underlying fundamentals are at the time.
  • Always be ready to liquidate your long positions and go short at bull market tops. No matter how resistant to such bear markets you believe your stocks or industries are.
  • Always be ready to liquidate your long positions and go short when the underlying stock price has experienced a massive run up and could now be considered in a highly speculative bubble. This rule applies to all market conditions. Bull and bear.

To Be Continued Tomorrow…….

Z30

Buy Low, Sell High, Go Short & Cover Investment Strategy Rules Google

Which Investment Strategy Is The Best

z46

Continuation from yesterday…...(Costs Associated With Short Selling)

Finally, before we can answer which of the investment strategies above is the best one, we have to consider an important issue.  We must first define what goals most investors have. Unfortunately, the investment industry has done quite a job cutting and dicing what should be a simple classification into a million different pieces. Anything from divorced housewives on fixed alimony income to 95 year olds with advanced derivative strategies.

Luckily for us, human nature and greed never go out of style. If given a chance, 99% of all investors, no matter the age or risk profile would want the exact same thing.

  • A massive capital gain.
  • In the shortest possible period of time.
  • While taking on very little, if any, risk.

The real question becomes, which of the strategies above can get us to the above mentioned points the closest?

As you can probably imagine, none of them. Every one of the strategies above has their own shortcomings that would jeopardize the objectives above. For instance, most value investments take a few years to play out.  Blowing our “short time frame” requirement completely out of the water. Investing in growth companies is inherently more risky and trading or overtrading rarely leads to large capital gains.

So, what is the ultimate solution?

As always, the answer lies somewhere in between. If we are to bring the strategies above together, we might just be able to achieve our ultimate objective. By taking the best parts and disregarding the worst, we might be able to stitch together a strategy will satisfy all of our high return and low risk profile requirements.  Let’s see if we can get it done.

Value Investing:  (Minimizing Risk)

  • Let’s Take: Undervalued and out of favor companies. Cheap stocks that for one reason or another selling well below their intrinsic value. Stocks that have collapsed over the last few months or years to the tune of 50-90%.  Stocks of companies that are turning around, but their positive change haven’t been realized by the market.
  • Let’s Disregard: Uncertain holding periods and buying stocks with weak technical indicators.

Growth Investing: (Maximizing Returns)

  • Let’s Take: Fast growing companies. Stocks that are appreciating at a fast pace. Stocks with strong technical indicators.
  • Let’s Disregard: Highly speculative companies. High risks associated with extremely volatile industries and overvalued companies.

Trading: (Perfecting Timing)

  • Let’s Take: Clearly defined rules and market timing techniques. The ability to take both sides of the trade….long and short.  The willingness to study trading and make necessary adjustments.  Strict risk management rules.
  • Let’s Disregard: Overtrading. Trading without rules or a clearly outlined strategy. Trading on hunches and gut feelings. Laziness.

The next step is to put all of the above selections together.

Won’t we end up with some sort of a Frankenstein monster?

Not at all. A clearly defined investment strategy below is the ultimate outcome.

To Be Continued Tomorrow…..

Z30

Which Investment Strategy Is The Best Google

Costs Associated With Short Selling

Continuation from yesterday…..(Why Short Selling Is Important)

  1. Additional costs associated with taking a short position.

Typically and depending on your broker the transactional costs associated with taking a short position are equal to you taking a long position.  However, you do tend to pay more though margin interest and dividend payments.  For instance, if the short position begins to move against you, money will be removed from your cash balance and into your margin account. If you do not have enough cash to cover the losses you begin to borrow on margin, thereby accruing margin interest charges. Otherwise, if you do have enough cash in your account to cover your short losses (if any), no margin interest costs will be inquired.

When it comes to dividend payments you are responsible for paying underlying stock’s dividend if you are holding the stock short ex-dividend date.  Without getting into the details of the entire process, you must pay the dividend on the underlying security if 1. The underlying security has a dividend associated with it and 2. You are holding this security short on ex-dividend date. At times such costs can be significant.

Yet, for the most part, both costs can be mitigated or largely eliminated when short selling is approached in a correct way. When it comes to margin interest, simply maintain a cash balance big enough to cover your short positions and any losses that you might inquire if the positions move against you.  That way your margin account is never triggered and no interest charges occur. In terms of dividends, either avoid shorting stocks that pay dividends or get out of your position before the ex-dividend date is triggered.  Plus, unless you are shorting a specific stock for company specific reasons, you shouldn’t be shorting stocks that pay dividends. Simply choose another non dividend paying stock in the same industry and short that one. And if you are to do both, the costs of going short become equal to the costs of going long.

In summary and as the points above show, when short selling is approached in an appropriate way, the risks associated with the practice are reduced to a bare minimum. And while the overall risk profile might be slightly higher than going long, when executed properly, going short is not nearly as risky as the investment industry makes it out to be.  If anything, the practice plays a crucial part in a powerful investment approach discussed bellow.

That brings us a full circle and back to the question of which investment approach is the best?

To Be Continued Tomorrow…..

Z30

Costs Associated With Short Selling  Google