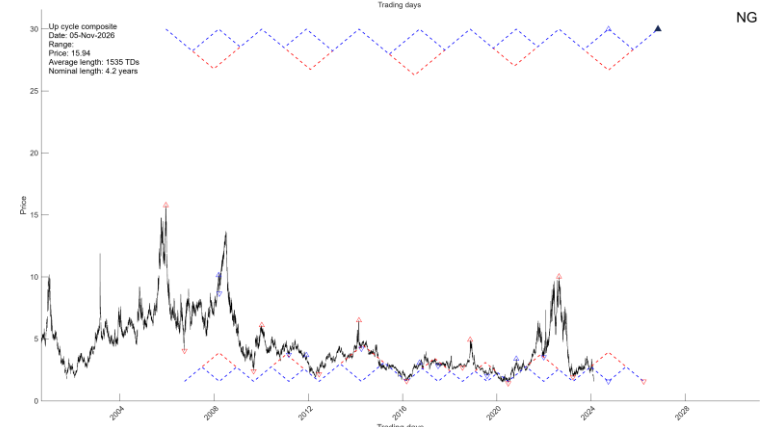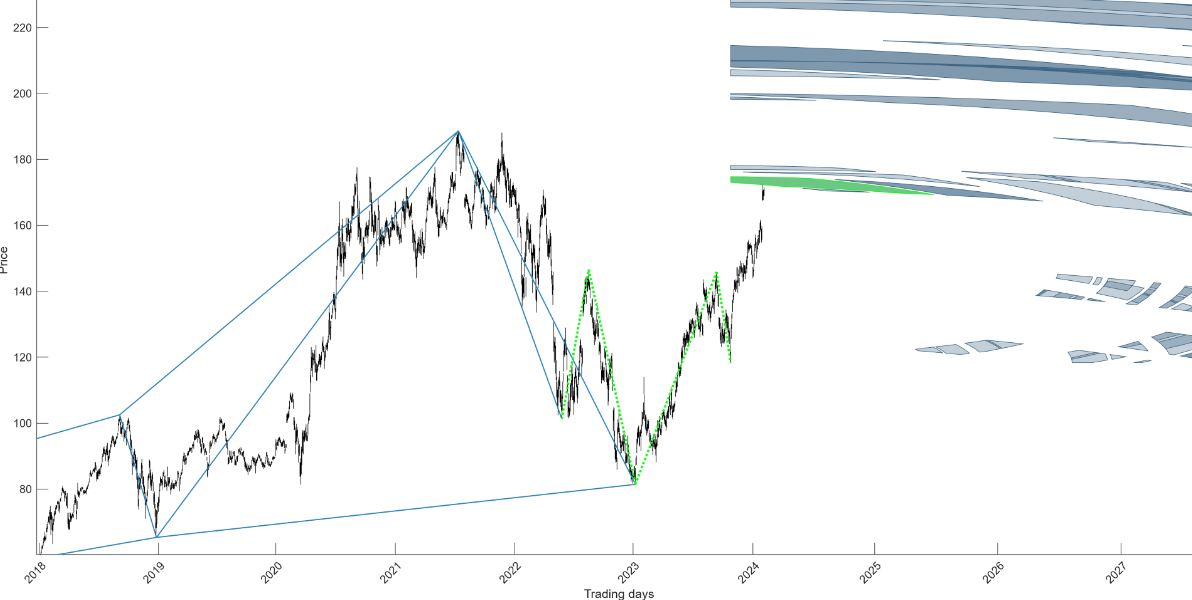
Yet another perfect hit…….If you would recall, we posted the following forecast on July 11th, 2023.
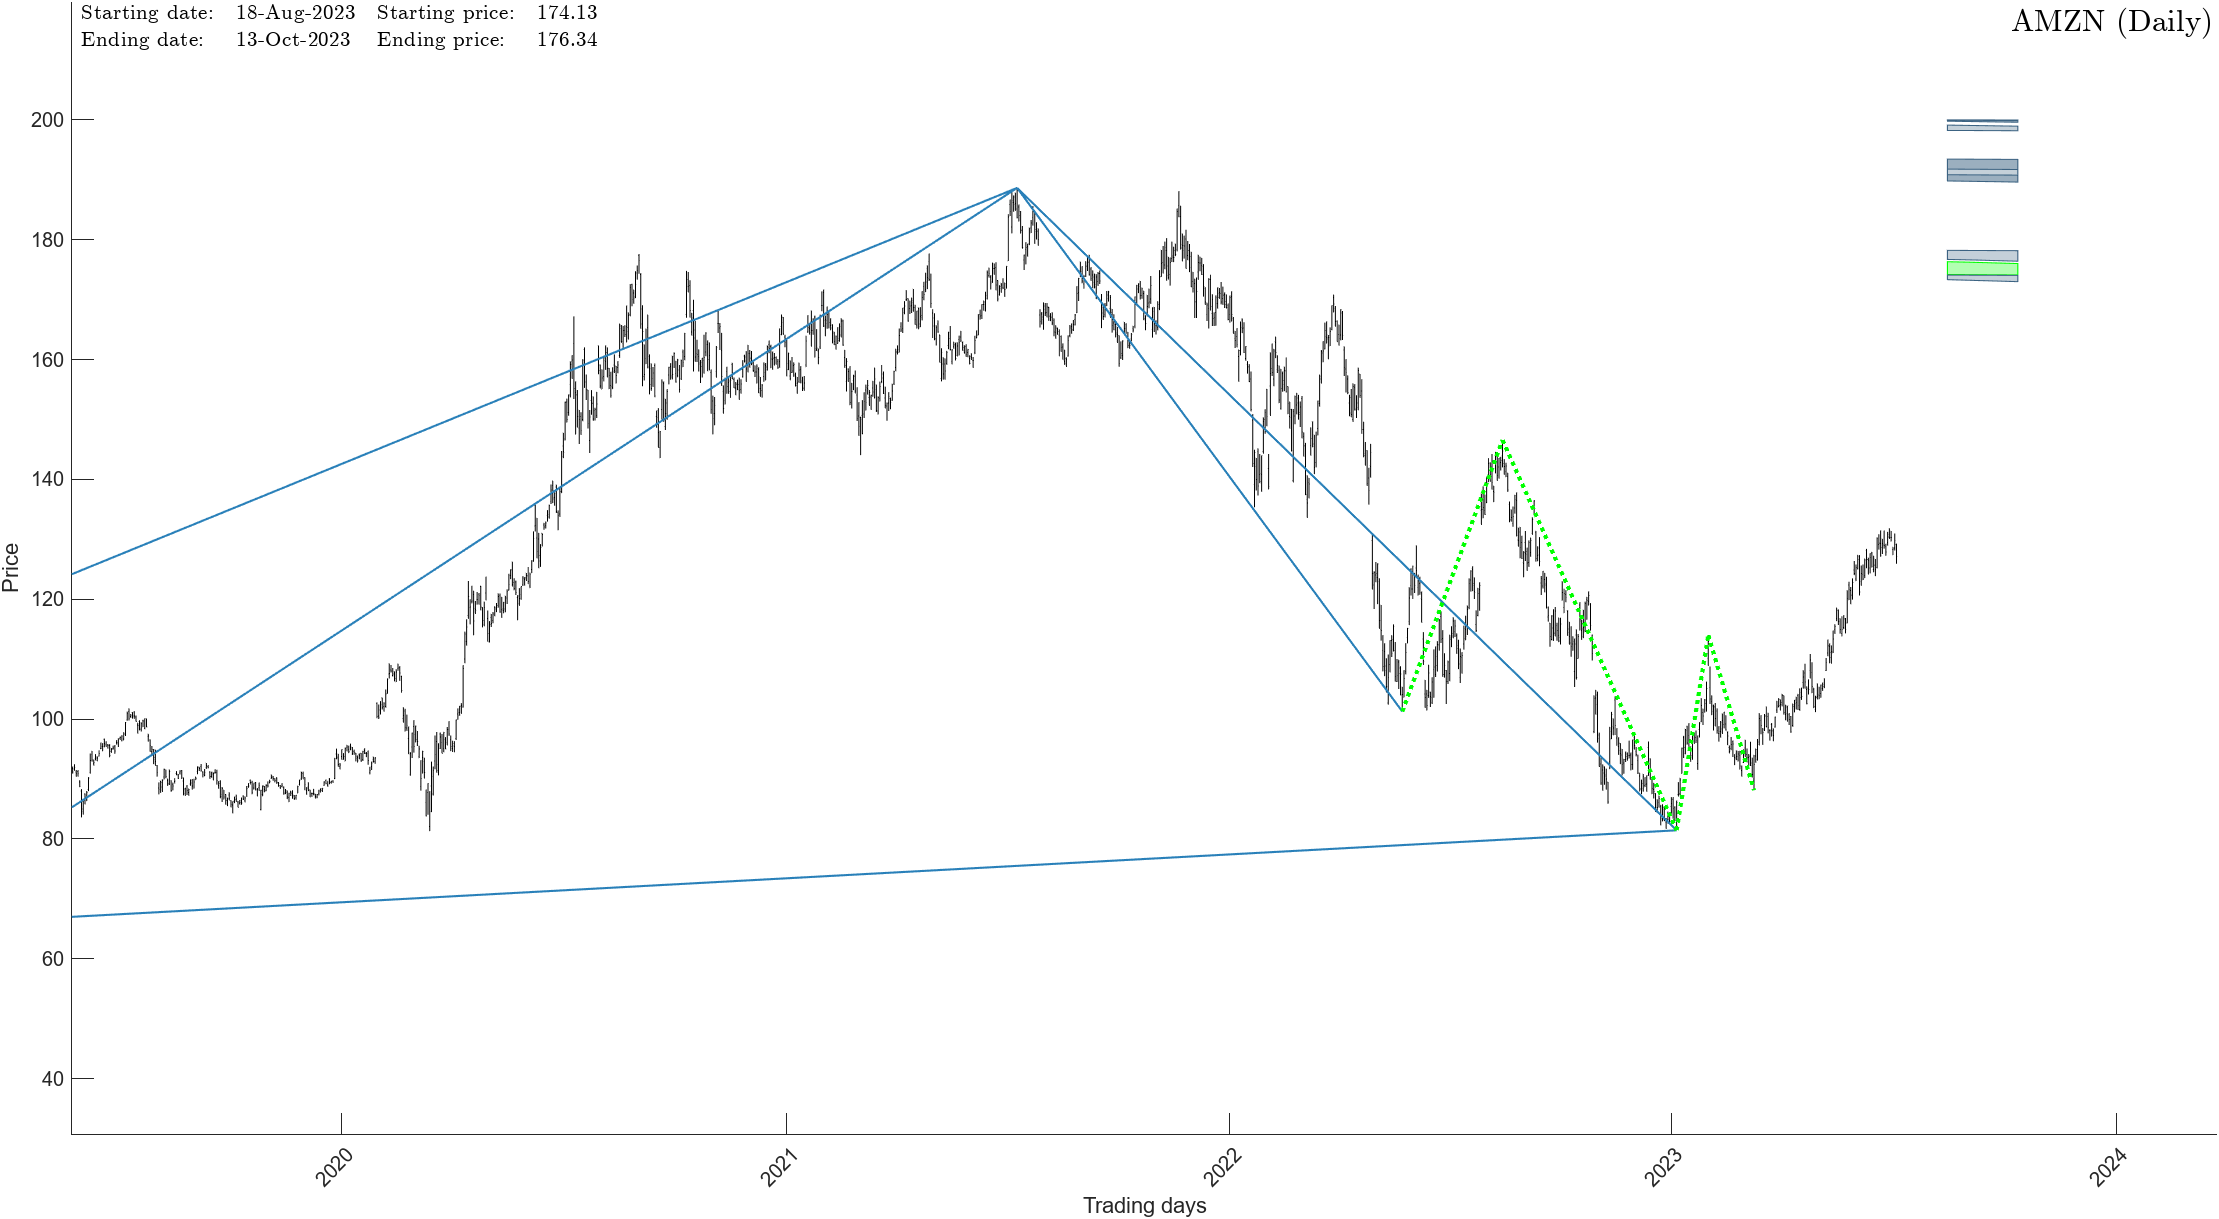
Analysis Update For Amazon (AMZN)
Date of Update: July 11th, 2023
Yet another direct hit from our prior analysis (see below).
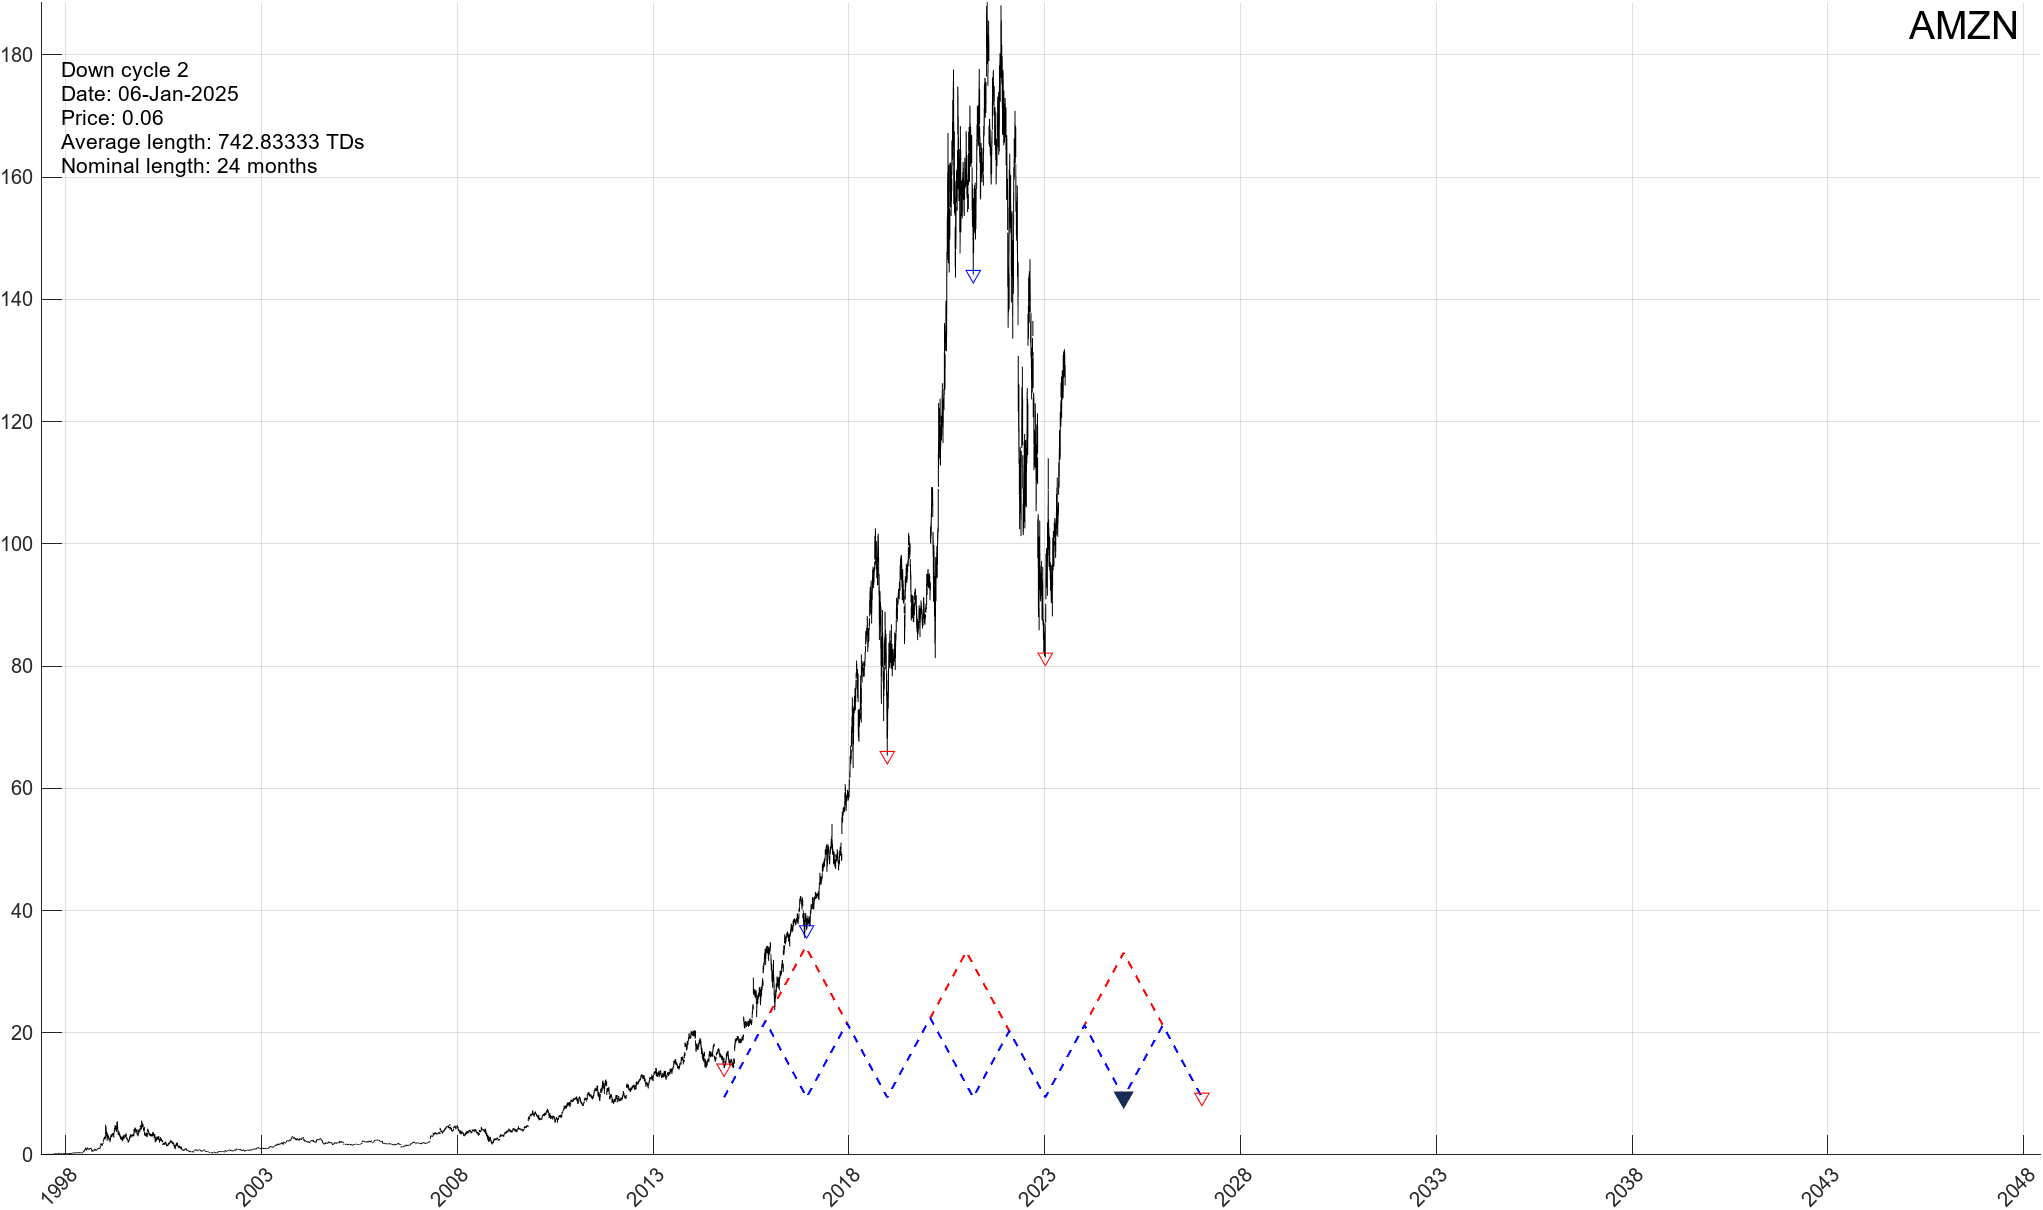
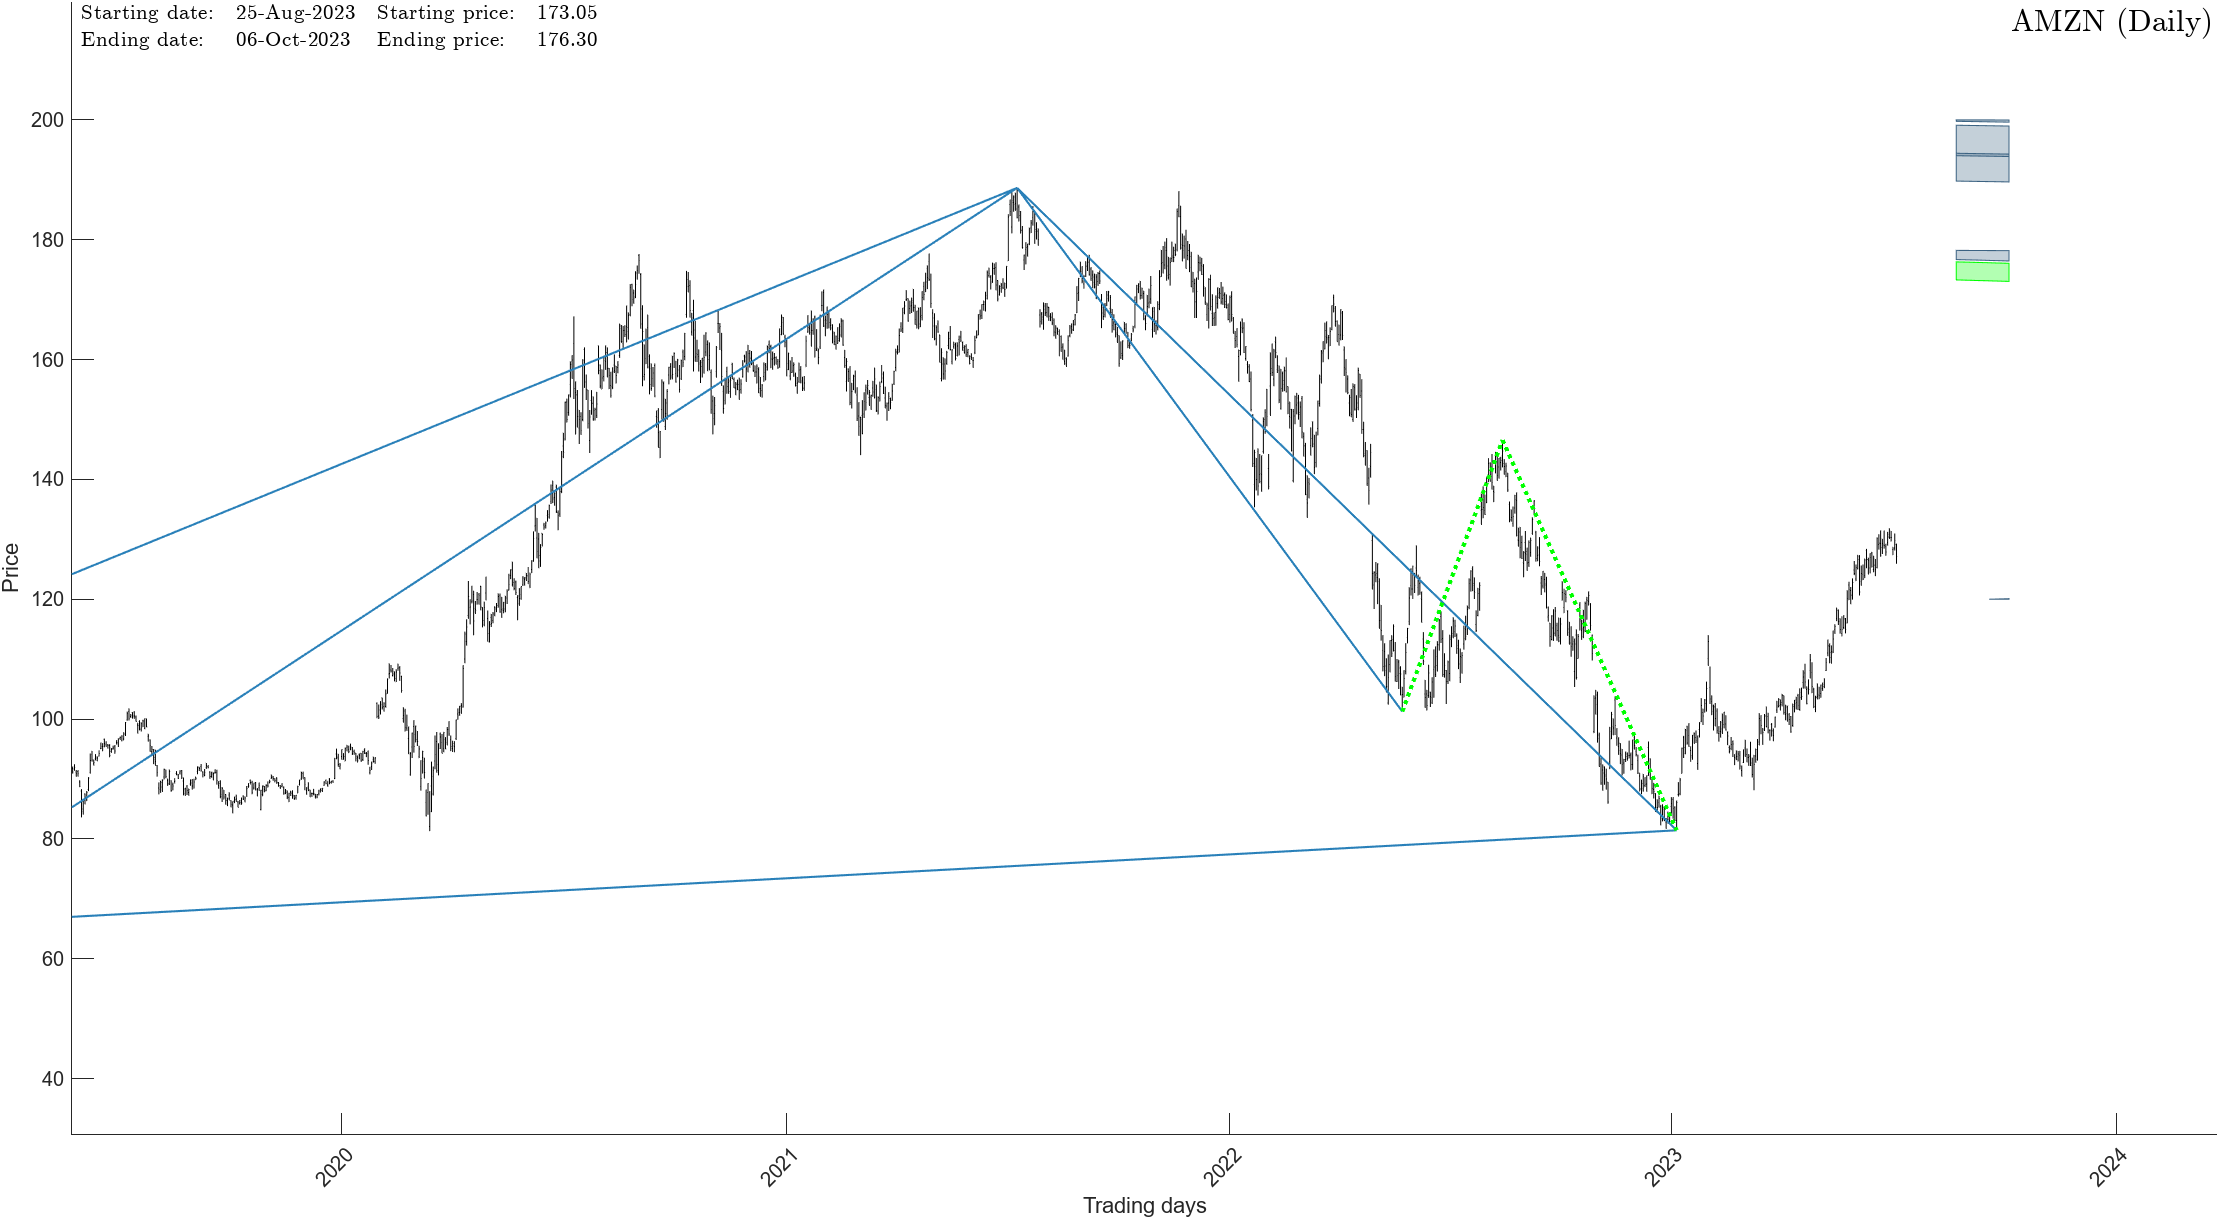
At that time we stated “The other interpretation suggests the stock will bottom this December 29th (+/- 5 trading days) at $82 (+/- $2)”
The actual bottom arrived January 6th at $81.43. We’ll take it.
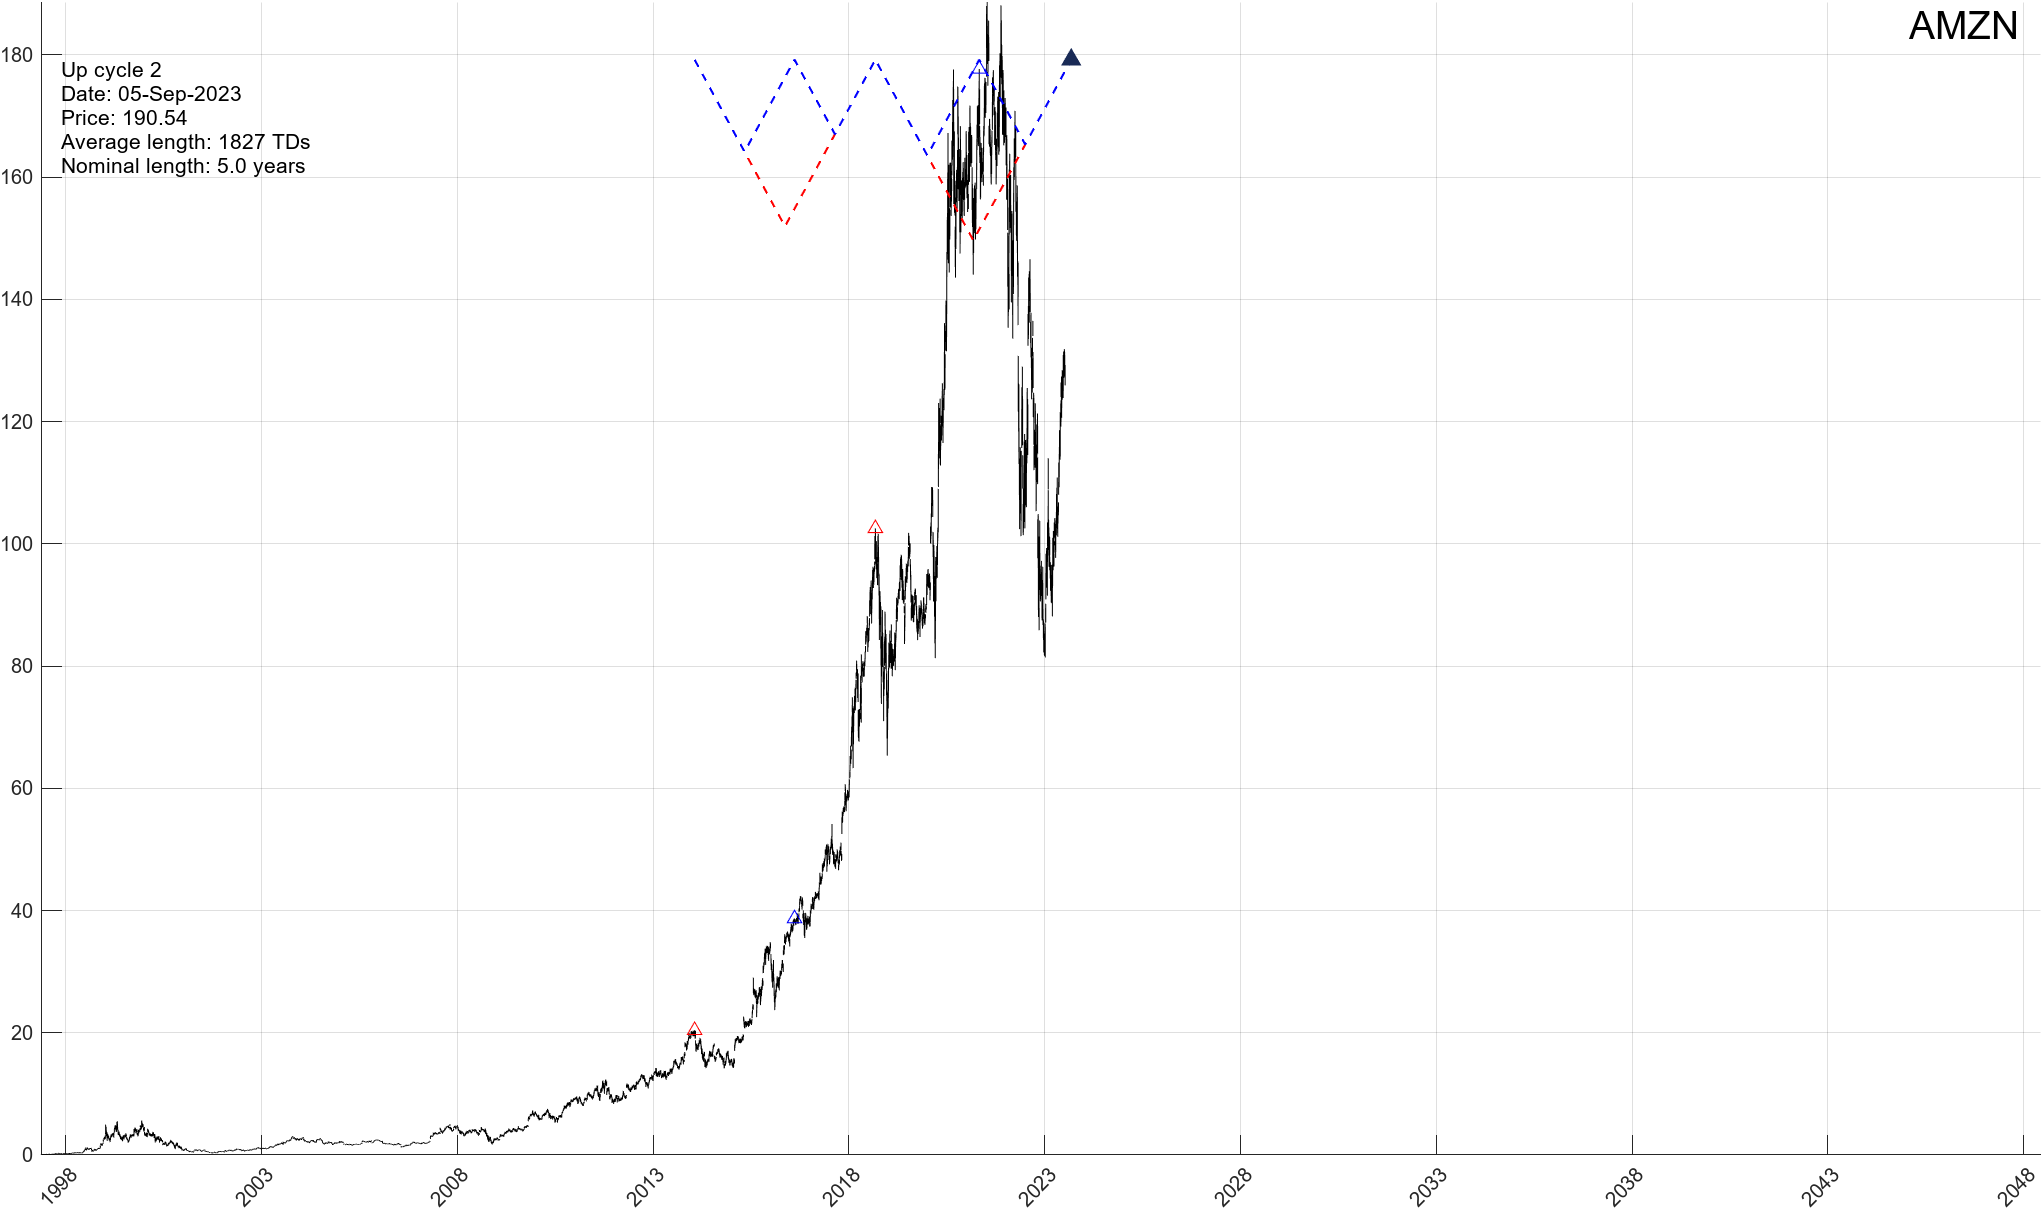
Going forward, we have a few adjustments to our prior upside projection. The price is rather clear. AMZN should top out at $174 (+/- $2). The associated TIME variable is a bit more tricky. We have a good TIME point of force arriving in September and then in January of 2024.
And while our September TIME turning point appears structurally better, it suggests AMZN is about to stage a substantial, although short lived, rally. While not impossible, we view this as unlikely at this time. We put the probability of this move developing at 20%.
Hence, we put the probability of AMZN reaching $174 by January of 2024 at 80%. Once this top arrives, AMZN should ………………………..
If you would like to find out what happens to Amazon (AMZN) next, please Click Here