
Update:
The blog post below was published in January, warning readers that the bull market has topped out on December 31st, ushering in the next leg of the bear market. The bear market that will take us into the 2017 cyclical bear market bottom. Thus far, the market has performed just as anticipated. A substantial decline and a bounce.
However, with the Nasdaq hitting an all time high today, the question is…..is my forecast wrong?
No. Here is why. What you have to understand is that every single market and stock will have its own internal mathematical structure and it’s own rate of vibration. My mathematical work follows the Dow Jones in particular. As such, the market structure remains intact and just as we have been forecasting within our member section. In fact, an important turning point is coming up shortly, pushing and pulling the Dow towards the completion of secondary top in March of 2014. Something I have talked about on this blog a number of times.
Exactly when, where and what steps will the Dow take to get there? I highly encourage you to visit this site tomorrow in order to read our weekly update. I will answer most, if not all, of the questions.
End Of Update…..
In my earlier blog posts I have mentioned that we had a cluster of very important turning points showing up around December 31st, 2013 and January 1st of 2014 (based on my cycle work). Indicating a significant turning point.
Yet, my mathematical work at the time didn’t confirm. That is until Tuesday of this week. You can blame a simple brain fart or a lack of sleep on my part.
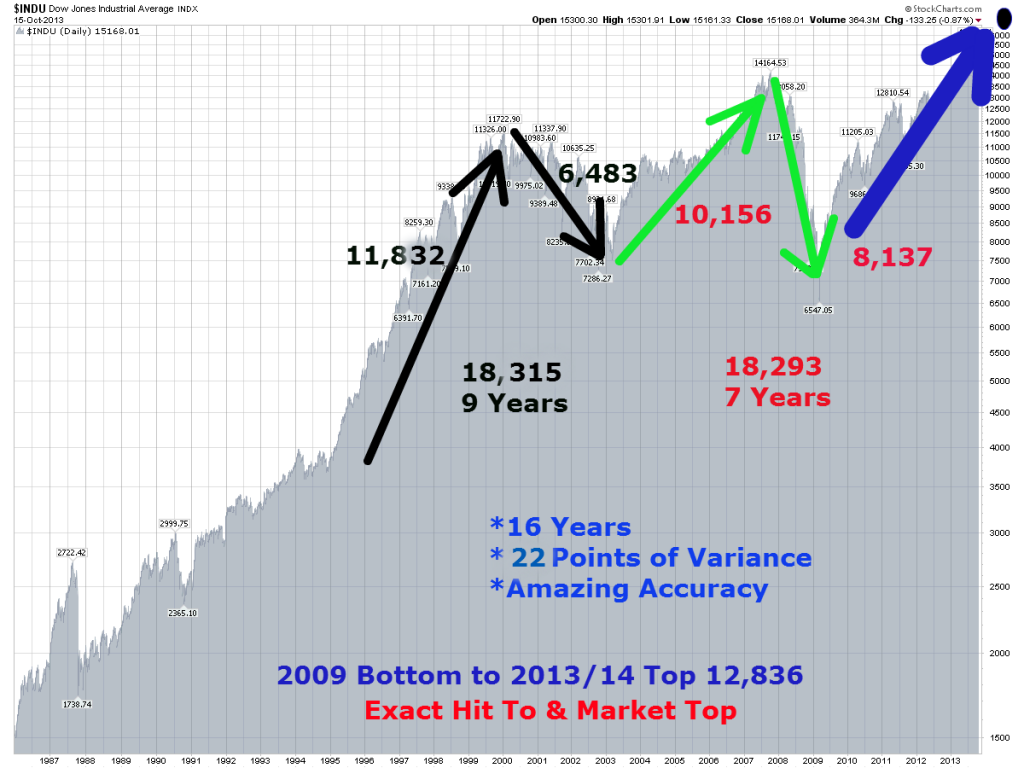
I have shown the chart above before. To prove to you that the stock market is not random, but quite the opposite, it is exact. Showing you that there was only a 22 point variance over a 16 year period of time. Further, when we take the values on the chart above and do a few simple calculations we get a value of 12,935.
So what?
Based on my calculations, the move between March 2009 bottom to December 31st, 2013 top on the DOW was exactly 12,836. That is an exact hit with 0.7% variance. With cycle work and mathematical confirmations coming together, I have no choice but to call for a market TOP.
(***What calculation? You can learn more about it in my book “Timed Value” by getting two free chapters on timing HERE, purchasing it on Amazon HERE or getting it as a free bonus HERE).
Now, even though the market top is in, we have to wait for a technical confirmation before taking our short position. Based on my previous experience that is a prudent thing to do.
What should you do next?
Option #1: If you are in stocks, start getting out and going into cash. Earning 2-5% annually is heck of a lot better than losing 30-40% over the next 3 years (the length of upcoming bear market). Plus, you will have money when the bottom comes to buy some wonderful companies at give away prices.
Option #2: Profit on the short side. At the same, this will be a very difficult thing to do. The upcoming bear market is unlikely to be directional. My work shows that it will closely resemble the 2000-2003 bear market with a lot of ups and downs. As such, it will be difficult to make money on the short side.
The best advice I can give you is this. Protect and accumulate cash. Once we hit bottom in 2017, the market will start its 18 year bull market.
Did you enjoy this article? If so, please share our blog with your friends as we try to get traction. Gratitude!!!

Why The Market Top Is In and What You Should Do Next – Update Google