
Packaged Deal #1
$449/Yearly
Service #1: DOW Jones Monthly Subscription
Our Overall Stock Market Timing and Directional Forecasts: Weekly, Daily and Summary Intraday Dow Jones updates and associated calculations. Exact Time/Price projections for the Dow published on the daily and weekly basis. Summary pre-market Intraday overviews. End of day updates and weekly updates. This analysis identifying future turning points for the Dow Jones in both TIME and PRICE. At various junctures and at our discretion (maybe twice a year or so) we will also discuss the S&P/Nasdaq under this section. This analysis will also include our time/price targets for the indices in question.
To be exact, here is what you get…….
- Daily “End-Of-Day” Updates: Published daily after the market closes. Reviews today’s market action, shares time/price projections and makes adjustments to our overall longer-term forecast (if need be).
- Weekly Updates: Reviews the overall market, reviews our long-term, mid-term and short-term projections for the Dow.
- Summary Intraday Updates: Summary pre-market Intraday overviews. If you need exact short-term forecasts, please Click Here.
- The S&P 500 and Nasdaq Analyses: At various junctures and at our discretion (maybe twice a year or so) we will also discuss the S&P/Nasdaq under this section. This analysis will also include our time/price targets for the indices in question.
- Direct Access: All E-mails are answered within 24 Hours
- Money Back Guarantee and/or Cancel At Any Time: No questions asked.
In summary, everything you need to know to understand where the overall stock market is going, long-term and short-term, and in both PRICE and TIME. Exact time/price targeting on multiple time frames is provided.
Service #2: MegaCap Stocks TIME/PRICE Analysis & Projections
MegaCap Stocks TIME/PRICE Analysis & Projections: We analyze important financial instruments such as Gold, Oil, Interest Rates, Currencies or big cap individual stocks on a weekly basis. One such analysis and associated time/price turning points will be presented to you weekly. We have about 26 major instruments we follow and we update them twice a year (one per week).
This analysis includes exact TIME and PRICE calculations for the underlying securities. Further, as any underlying security moves into its projected long-term time/price turning point, we will concentrate our analysis on such an issue and provide further shorter-term price/time calculations and trading guidance.
Here is the partial list of the underlying securities involved in this service (subject to change…..)
| Nasdaq (QQQ) | US Dollar (DXY) | 10-Year (TNX) | Crude Oil (CL) |
| Copper (HG) | Gold (GLD/GC) | Bitcoin (BITO) | Soybean (ZL) |
| Apple (AAPL) | Microsoft (MSFT) | Tesla (TSLA) | Facebook (META) |
| Amazon (AMZN) | NVIDIA (NVDA) | Google (GOOGL) | Emerging (EEM) |
| Netflix (NFLX) | Biotech ETF (IBB) | Reg. Banks (IAT) | Disney (DIS) |
| Gold Min. (NEM) | HB ETF (XHB) | Volatility (VIX) | Natural Gas (NG) |
| Others….. |
SAMPLE ANALYSIS FOR APPLE (AAPL)
Apple Inc (AAPL) – UPDATE
Date: June 27th, 2023
Our original AAPL forecast (see below) is working our perfectly. If you recall, we originally predicted AAPL bottom would arrive on October 31st, 2022 at $124. Yet, when the bottom wasn’t reached by that juncture, we quickly shifted our forecast to December 31st, 2022 (+/- 2 trading days).
As you know, the actual bottom arrived on January 3rd at $124.17…….a direct hit.
This was followed by the following statement (people thought we were crazy)
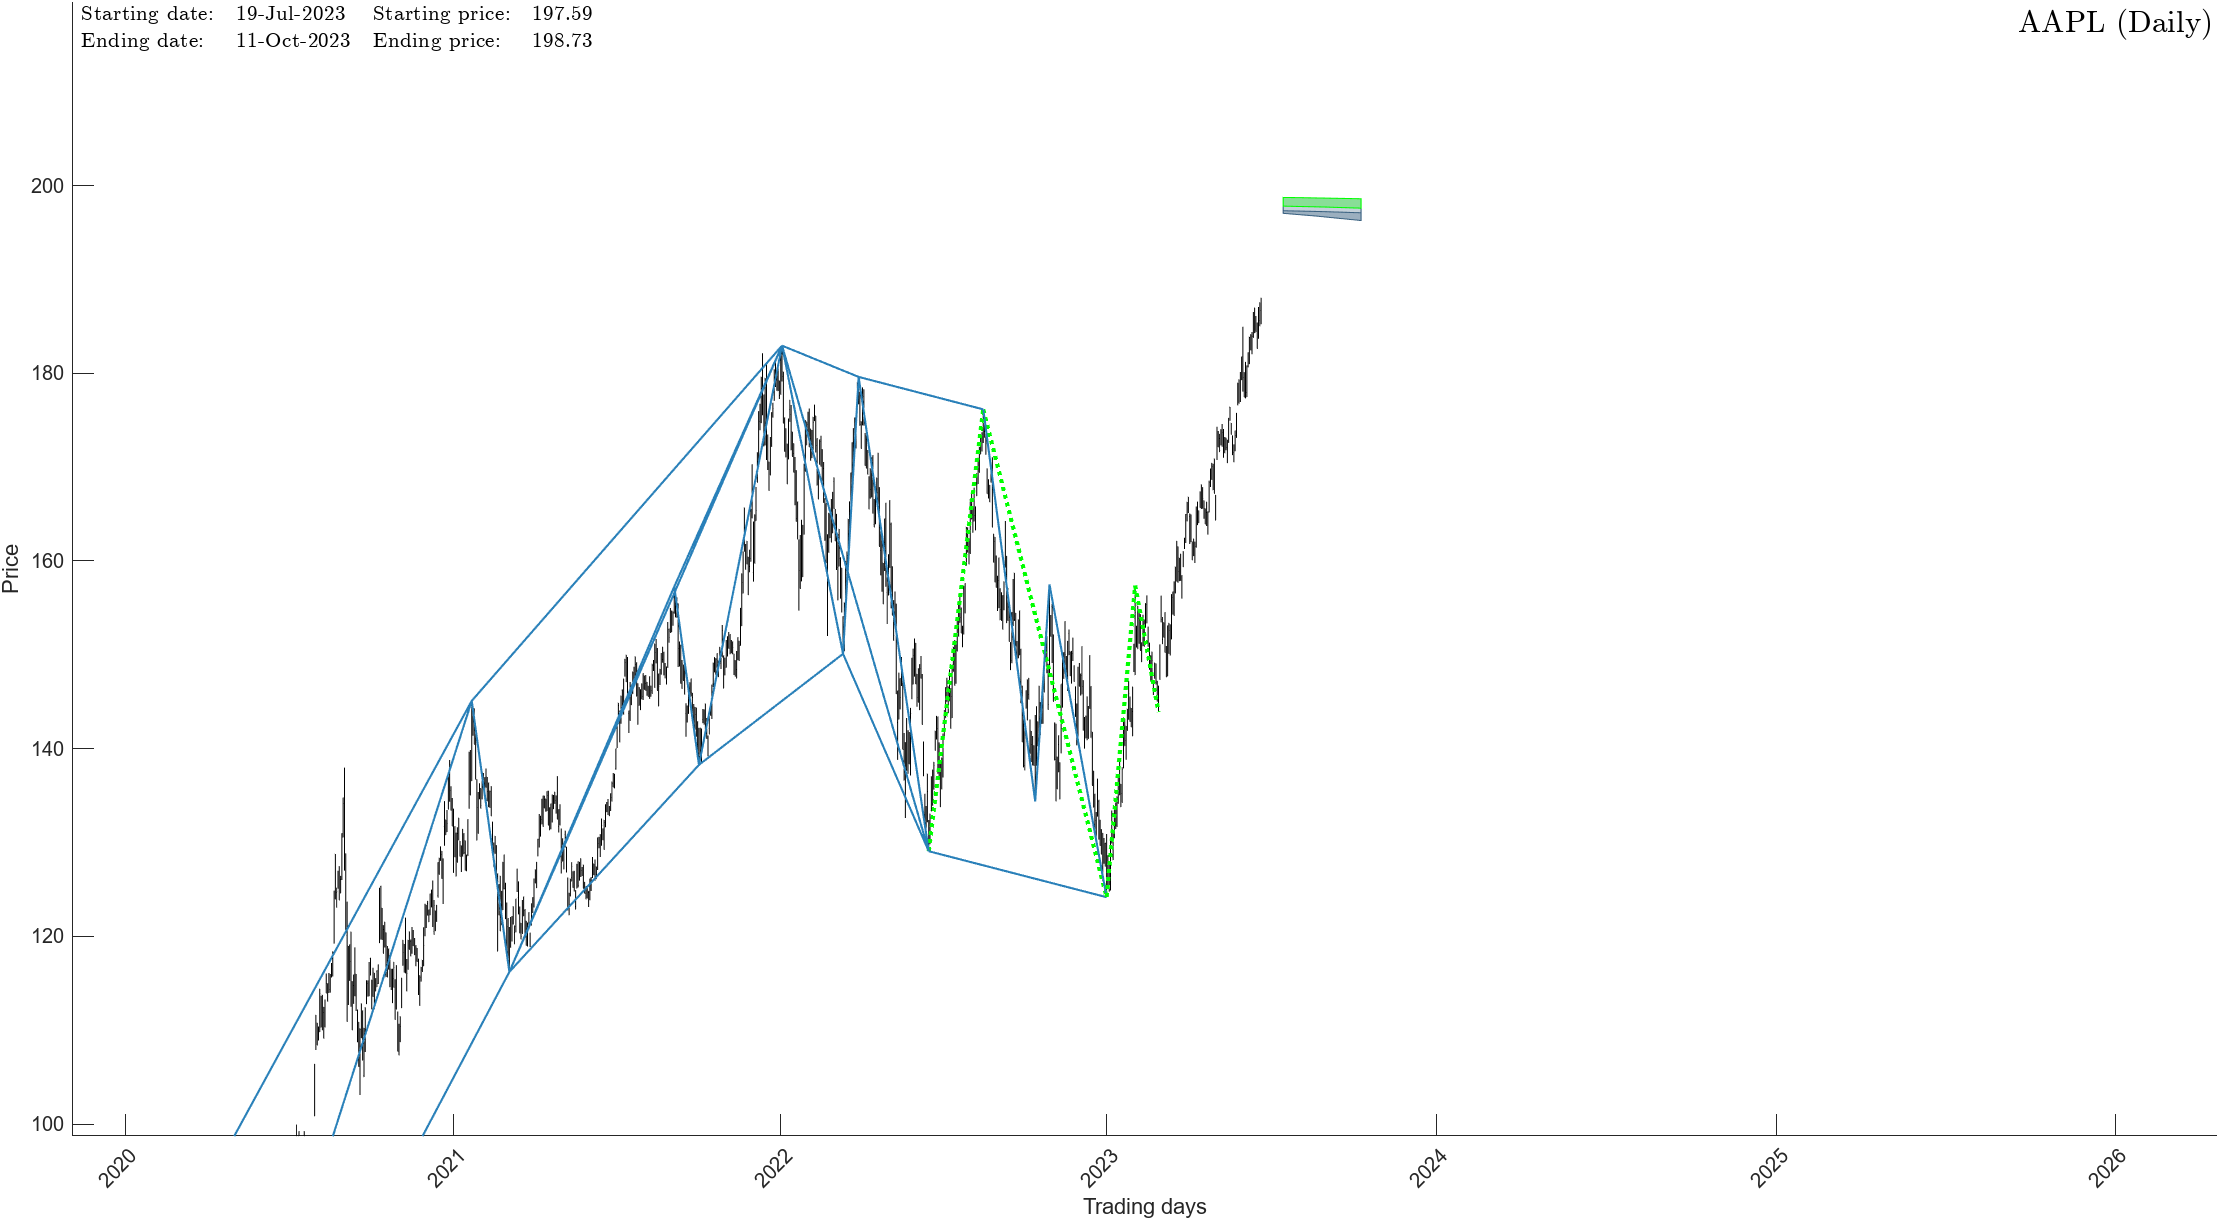
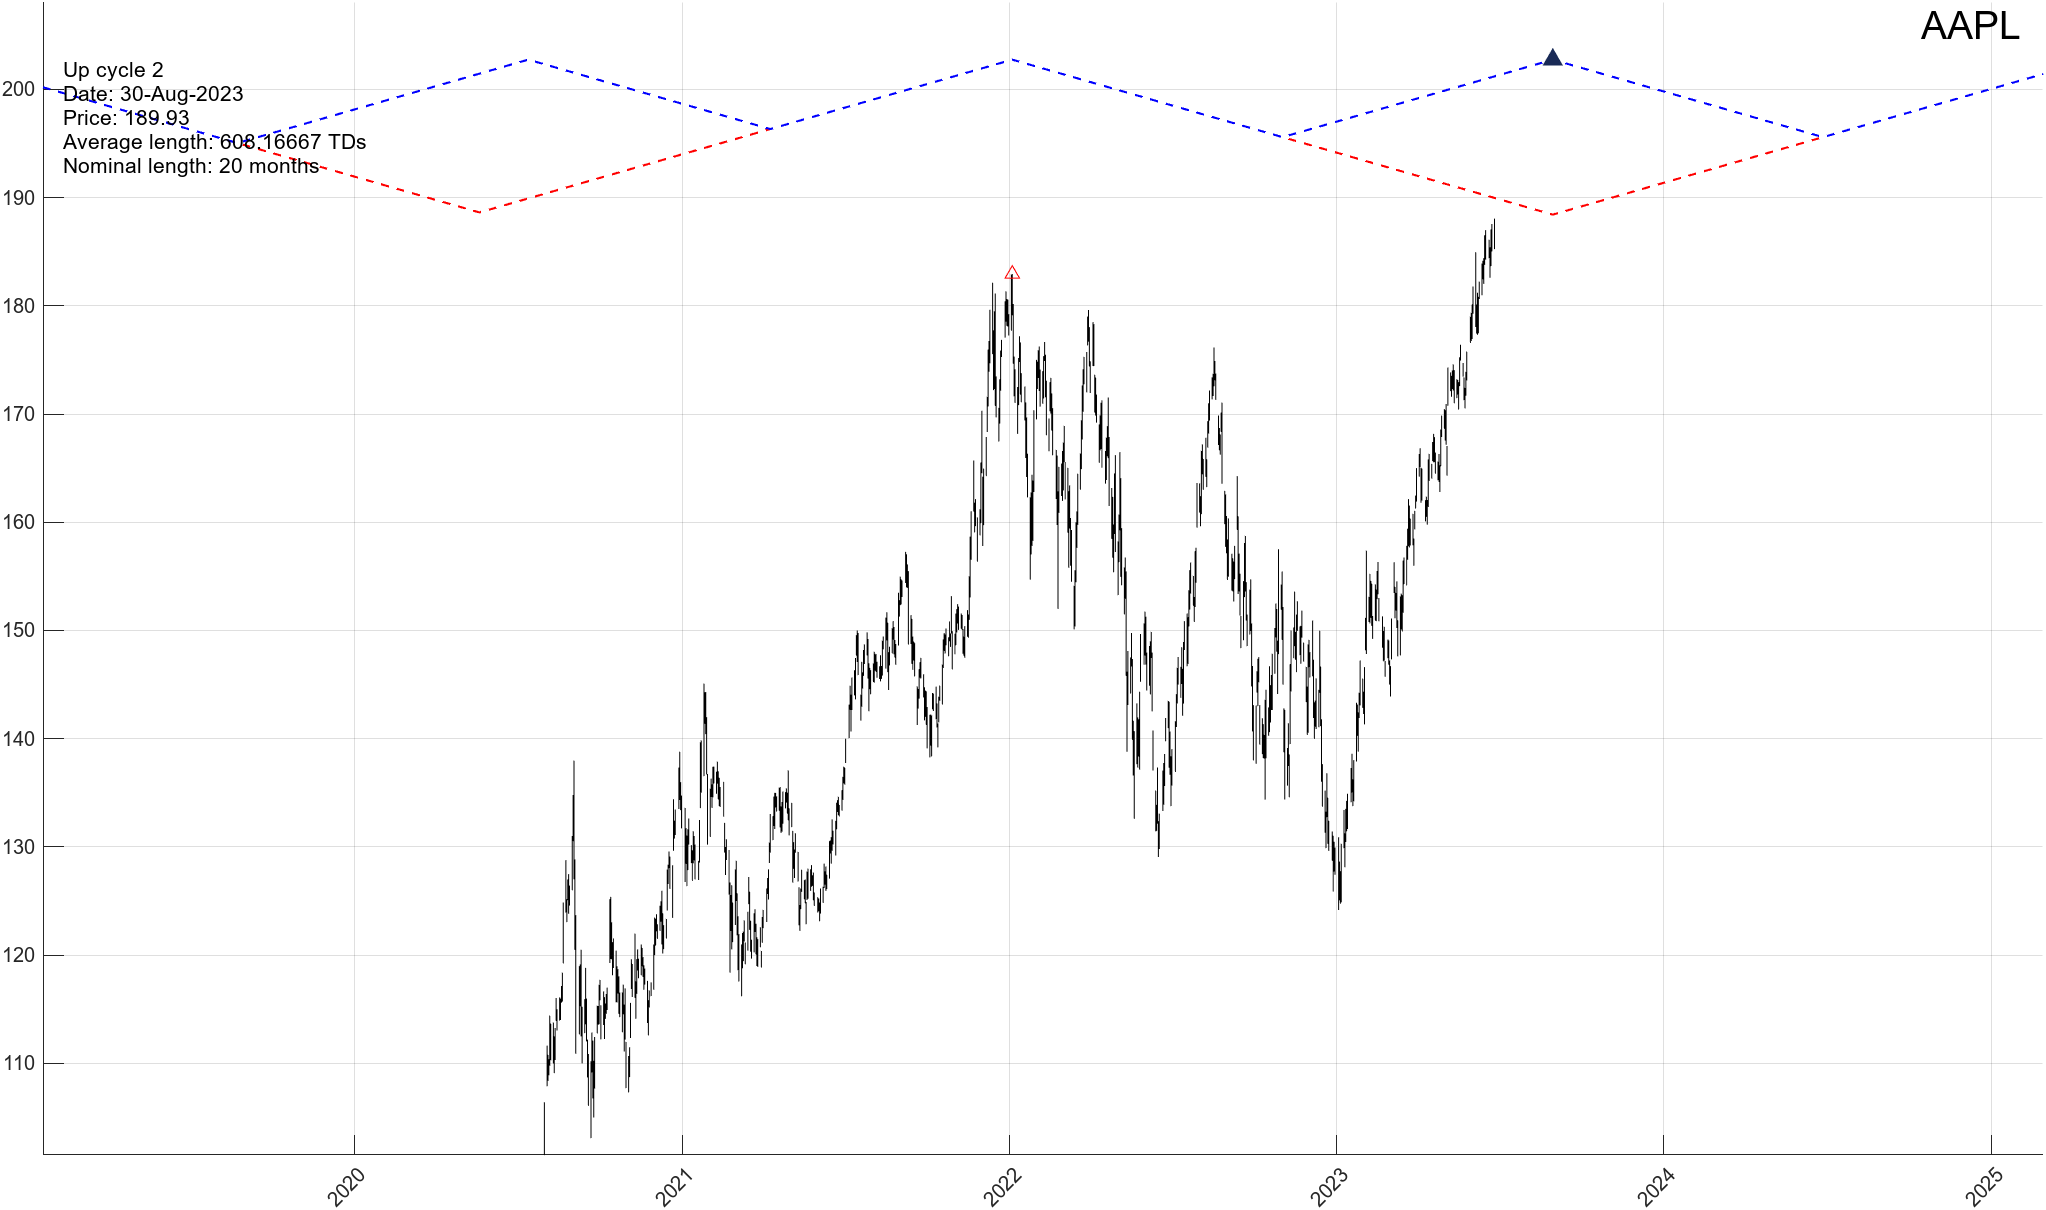
Once the bottom is put in place, Apple stock should rally into April of 2023. Our calculations suggest Apple should reach $208 (+/- $2) by the end of April. I say should not in terms of PRICE, but in terms of TIME. If AAPL doesn’t reach this PRICE target by April, the TIME variable will extend and the stock will need more time to hit the same PRICE target.
Once again, we have to make an adjustment to our original April TIME turning point due to the market’s inability to reach its targets by this juncture. Yet, the overall forecast remains the same and in force.
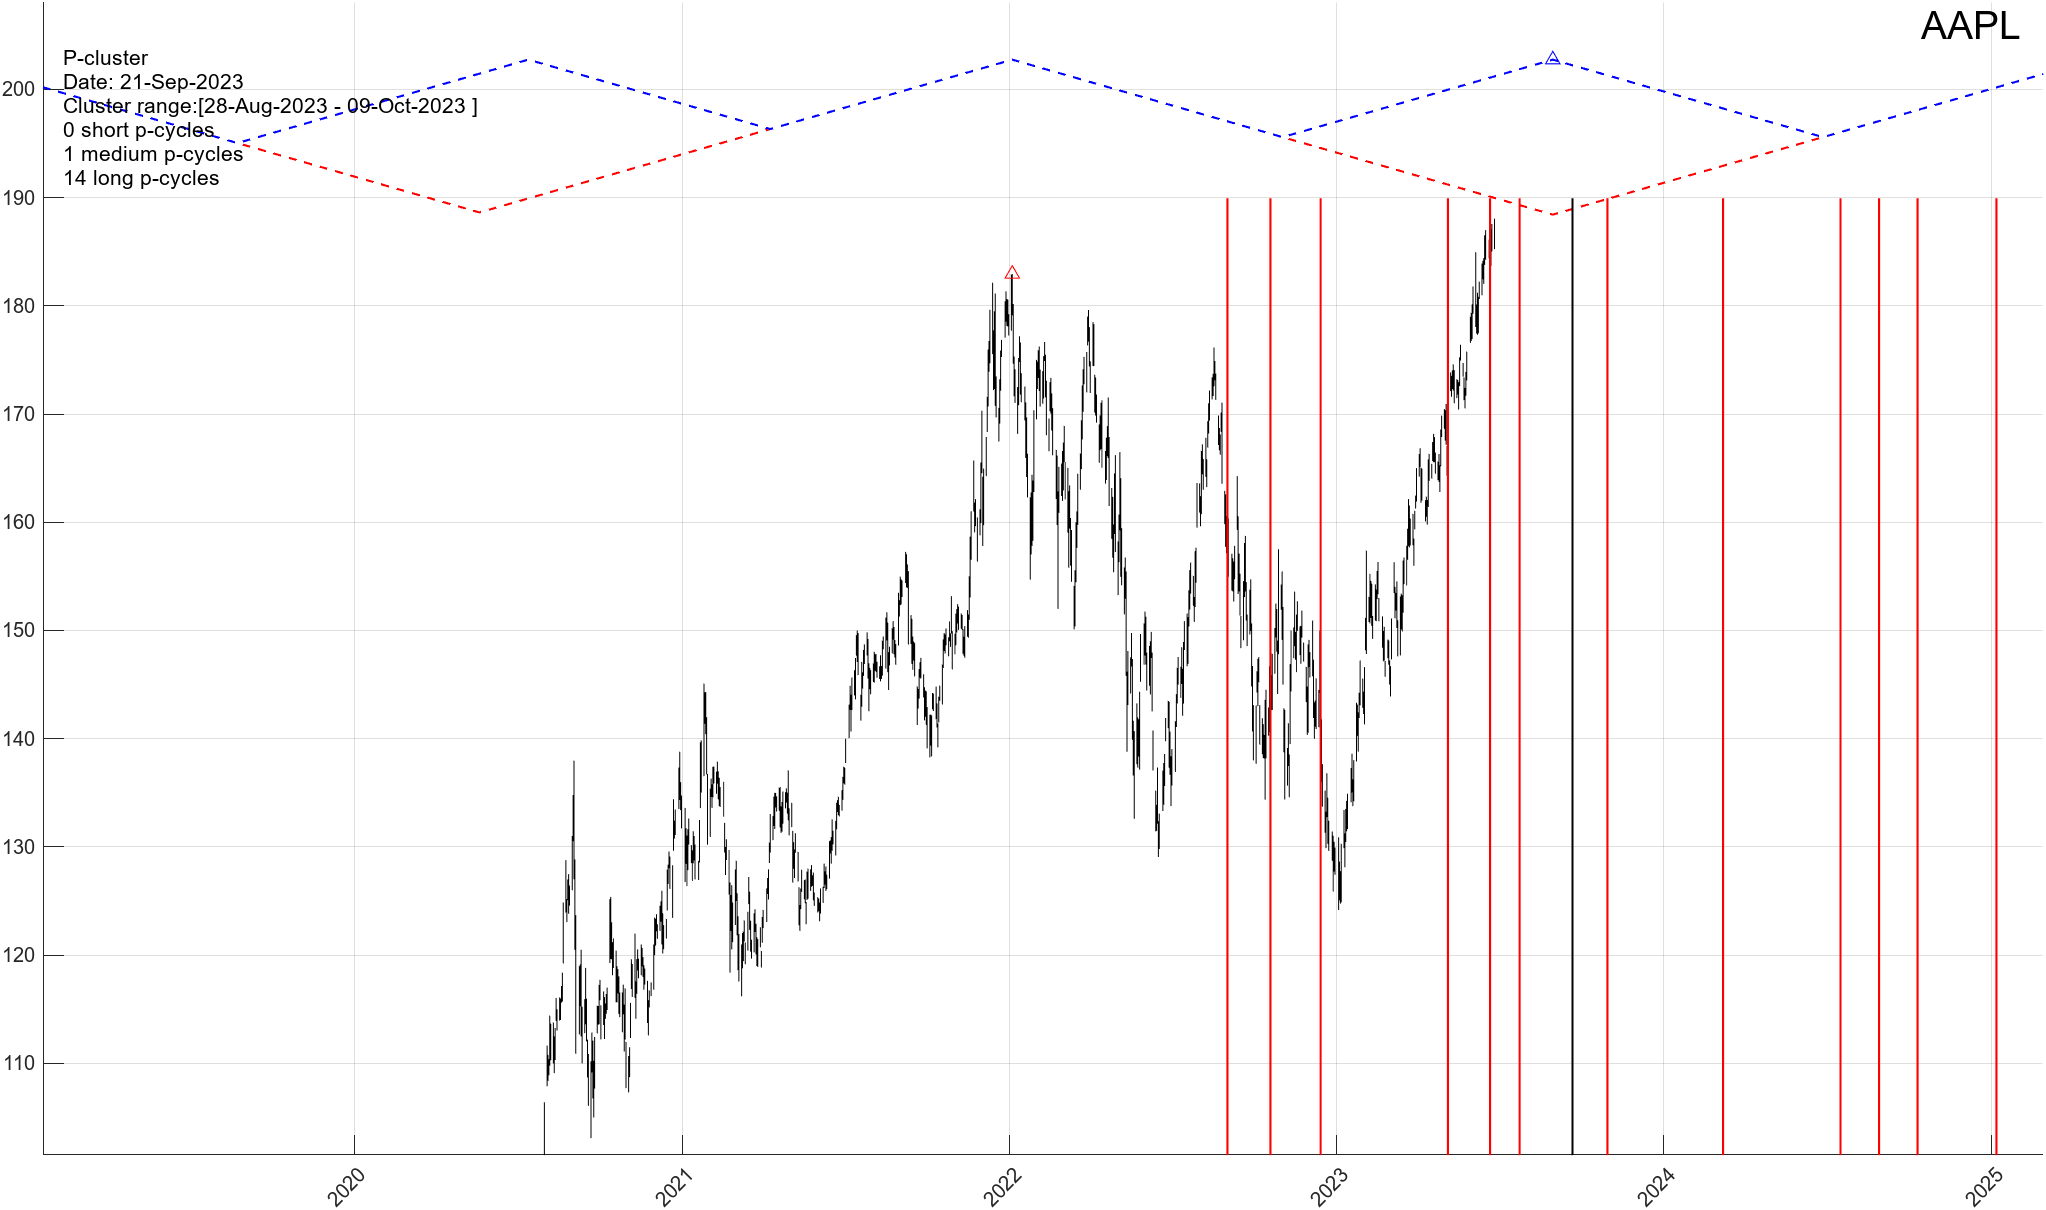
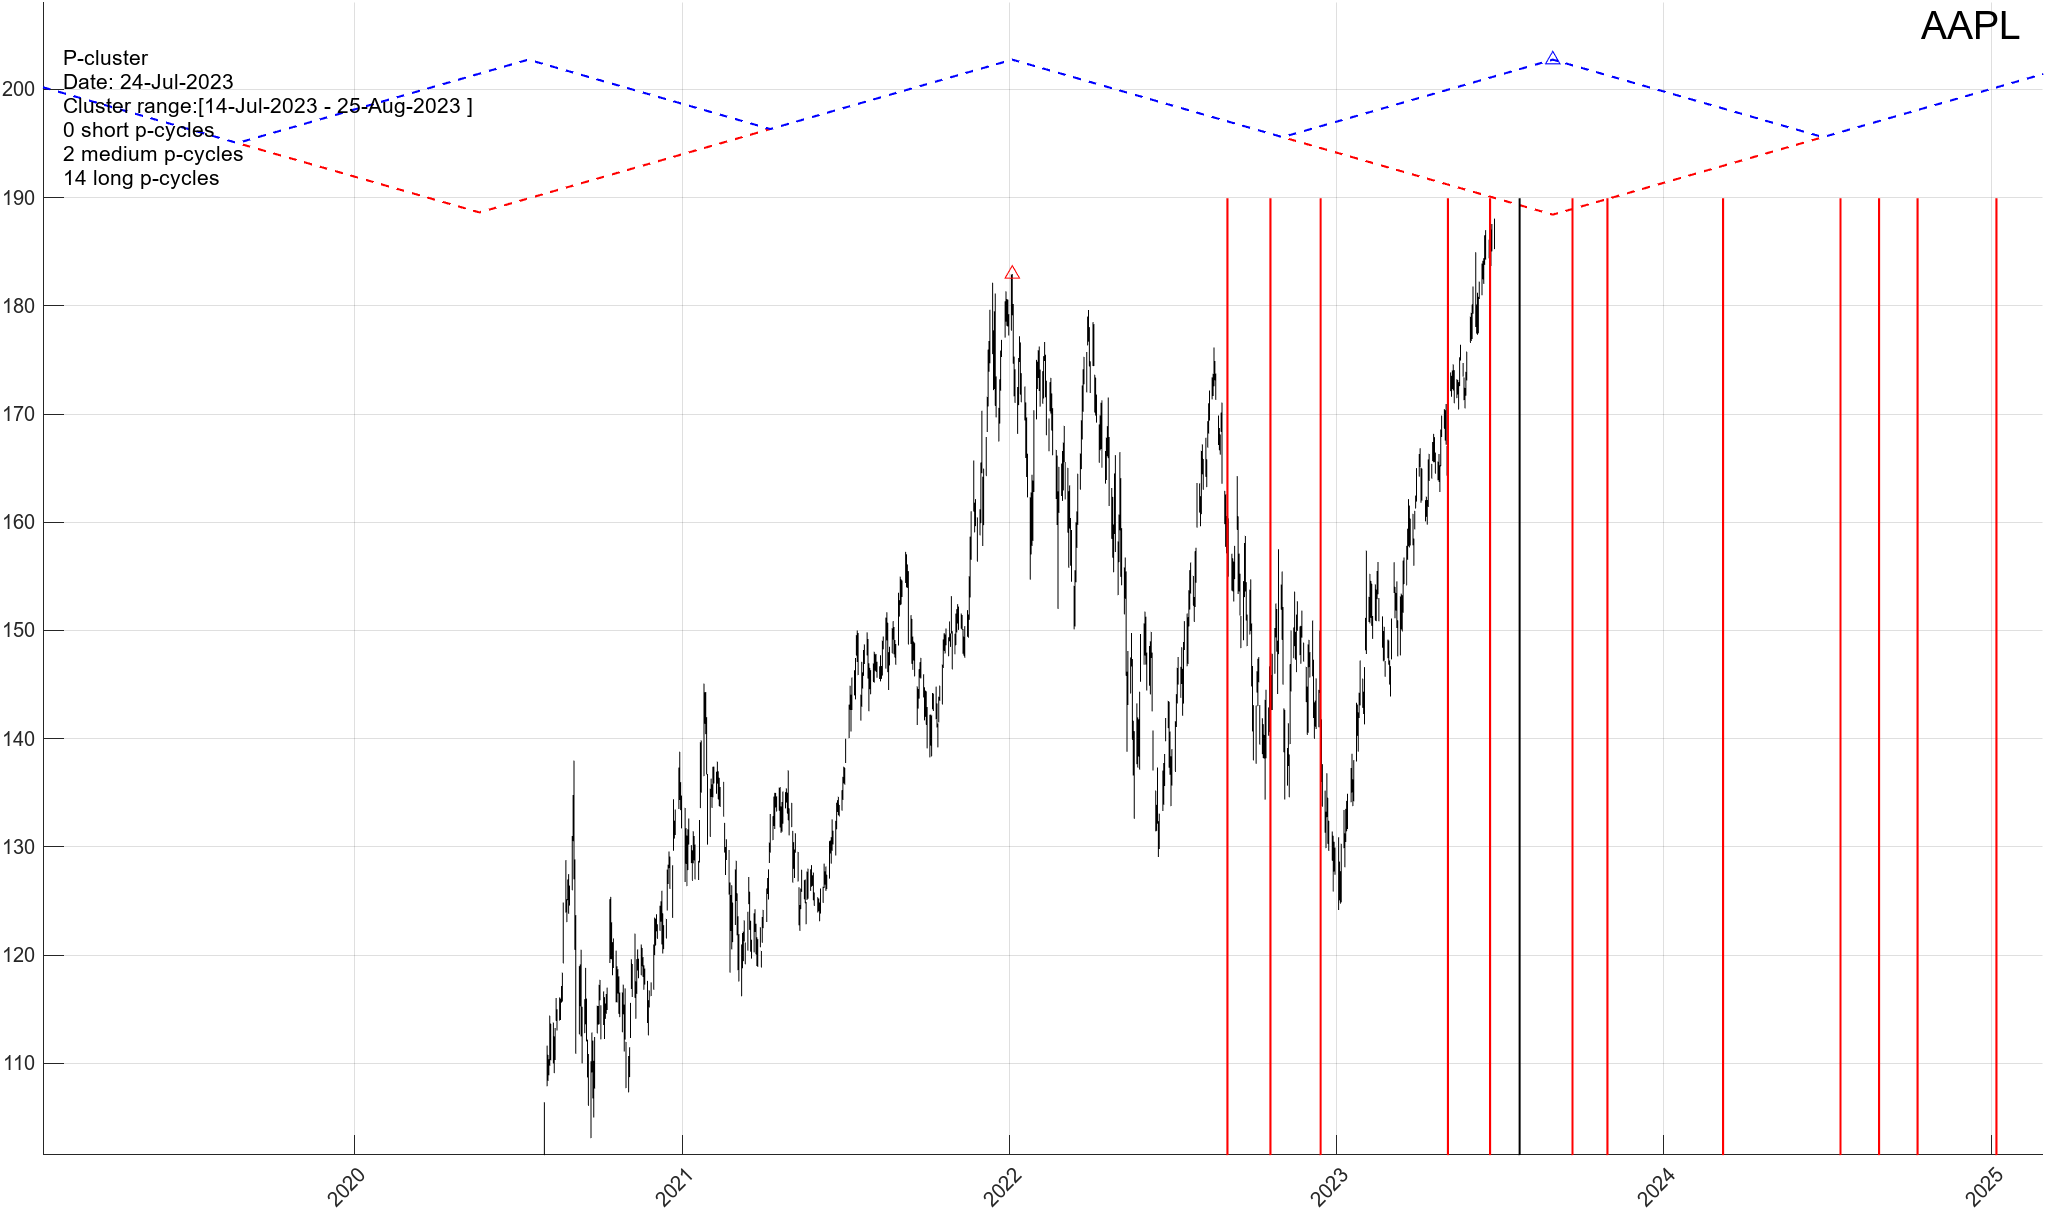
- AAPL is approaching an important top. This top will arrive on a certain date in September – October of this year.
- The final price projection is closer to $200 a share because the move is taking longer than the original price of $208 projected.
- Once the top is put in place AAPL will very quickly move down. It is actually a fast mover to the downside between 2023 top and 2024 bottom. Exciting…..
In summary, everything you need to know about the underlying security and what it will do in both Price and Time going forward. Each issue will be update twice a year or more often if the stock is moving into a major time/price turning point. At that time further trading guidance will be offered as well.
Plus, a 14-DAYS money back guarantee. Don’t like the service it for whatever reason? Let us know within 14 days and your money will be refunded in full. No questions asked.