
 – State of the Market Address:
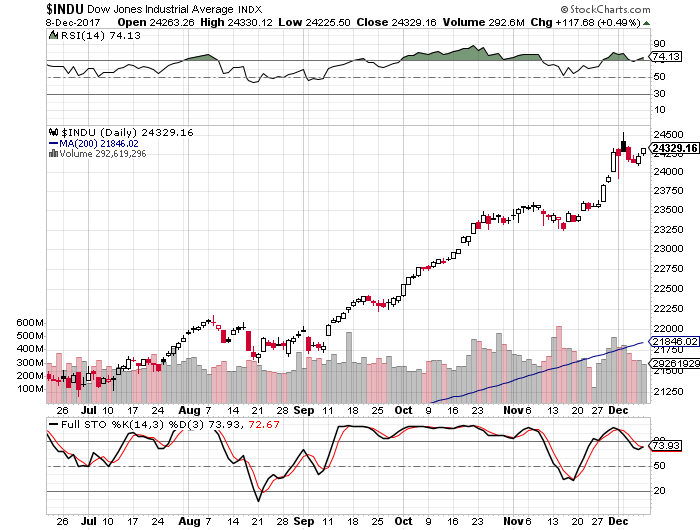
- The Dow remains above 24,000
- Shiller’s Adjusted S&P P/E ratio is now at 32.17 Now at arguably the highest level in history (if we adjust for 2000 distortions) and still above 1929 top of 29.55.
- Weekly RSI at 84 – overbought. Daily RSI is at 74 – overbought.
- Prior years corrections terminated at around 200 day moving average. Located at around 18,500 today (on weekly).
- Weekly Stochastics at 95 – overbought. Daily at 74 – overbought.
- NYSE McClellan Oscillator is at -14. Neutral.
- Volatility measures VIX/VXX remains at suppressed levels. Commercial VIX long interest declined to 60K contracts net long.
- Last week’s CTO Reports suggest that commercials (smart money) have maintained their positioning. For now, the Dow is 6X, the S&P is at 2.5X net short, Russell 2000 is now at 6X net short and the Nasdaq is net neutral.
In summary: For the time being and long-term, the market remains in a clear bull trend. Yet, a number of longer-term indicators suggest the market might experience a substantial correction ahead. Plus, the “smart money” is positioning for some sort of a sell-off.
If you would like to find out exactly what happens next based on our Timing and Mathematical work, please Click Here.
ATTENTION!!! Please note, we have moved most of our free editorial content to our new website MarketSpartans.com Please Click Here to view it.
ELLIOTT WAVE UPDATE:
Since many people have asked, I will attempt to give you my interpretation of Elliott Wave and how it is playing out in the market. First, I must admit. I don’t claim to be an EW expert, but I hope my “standard” interpretation is of help.
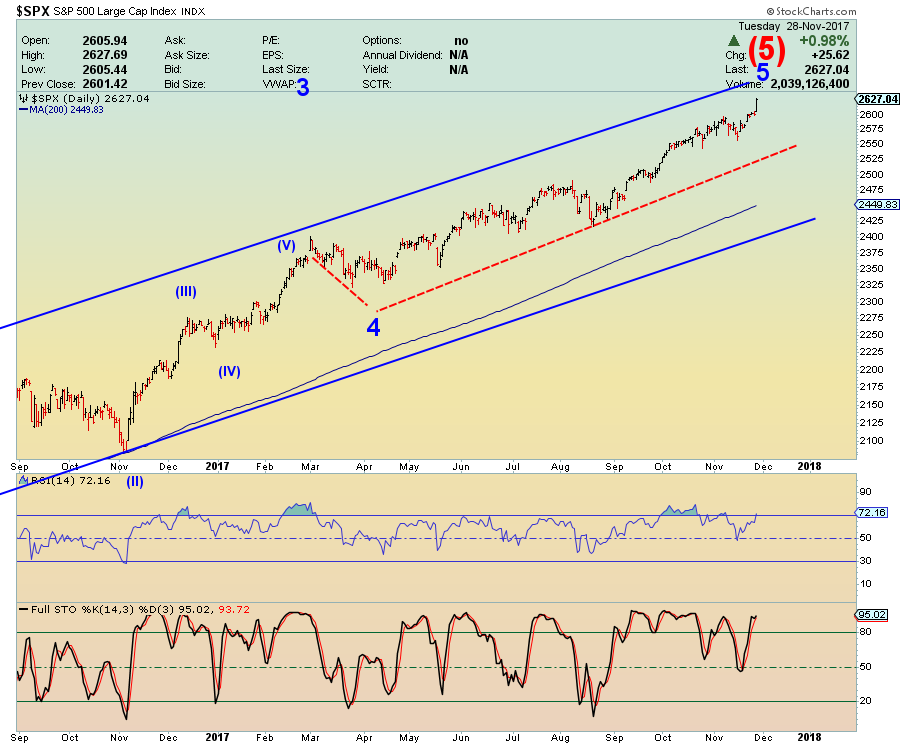
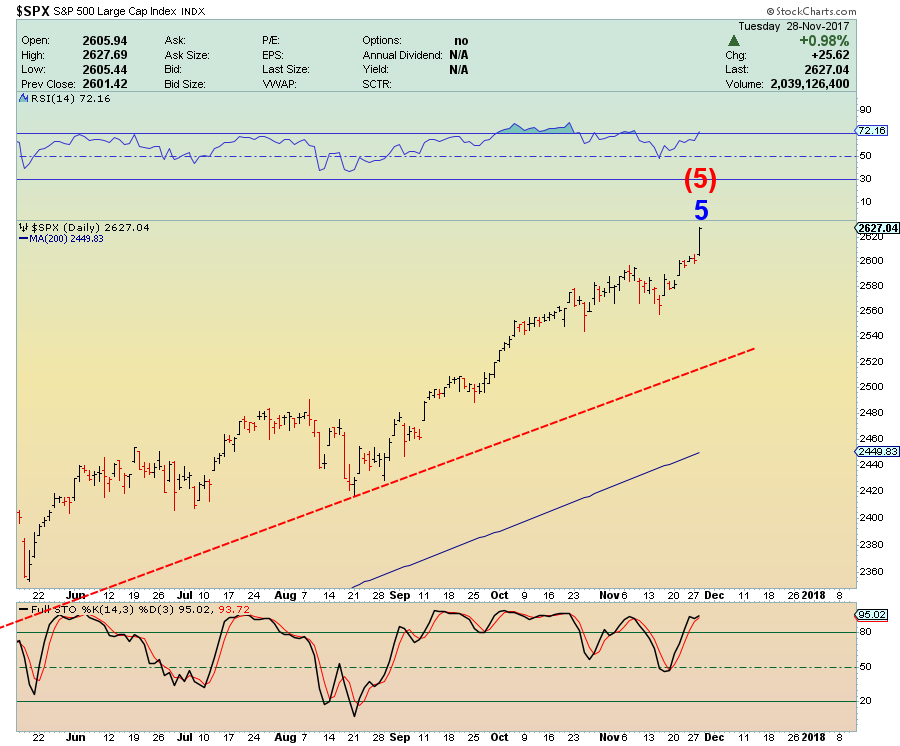
Let’s take a look at the most likely recent count on the S&P.
Explanation:
Long-Term: It appears the S&P is quickly approaching the termination point of its (5) wave up off of 2009 bottom. If true,we should see a massive sell-off later this year. Did it already complete? Click Here
Short-Term: It appears the S&P might have completed its intermediary wave 3 and now 4. It appears the market is now pushing higher to complete wave 5 of (5). If true, the above count should terminate the bull market. Did it already complete? Click Here
 If you would like to find out exactly what happens next based on our Timing and Mathematical work, please Click Here.
ATTENTION!!! Please note, we have moved most of our free editorial content to our new website MarketSpartans.com Please Click Here to view itDa