
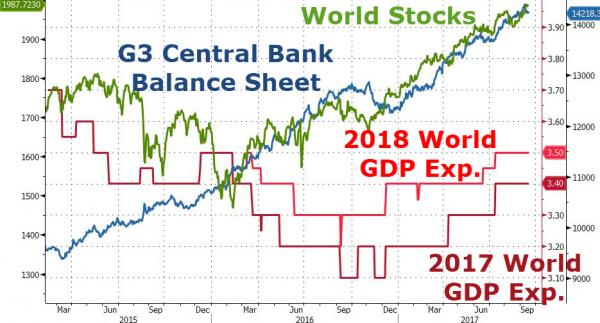
The chart above is rather self-explanatory. GDP expectations, in additions to earnings, haven’t moved very much off of 2016 lows. All while the stock market is up 30%+.
What gives?
Well, as the chart above shows the likes of Janet Yellen have pumped $3 Trillion of freshly printed green into the stock market and/or the Economy. To save the day, to avoid the collapse, etc…
Which brings us to this little problem……..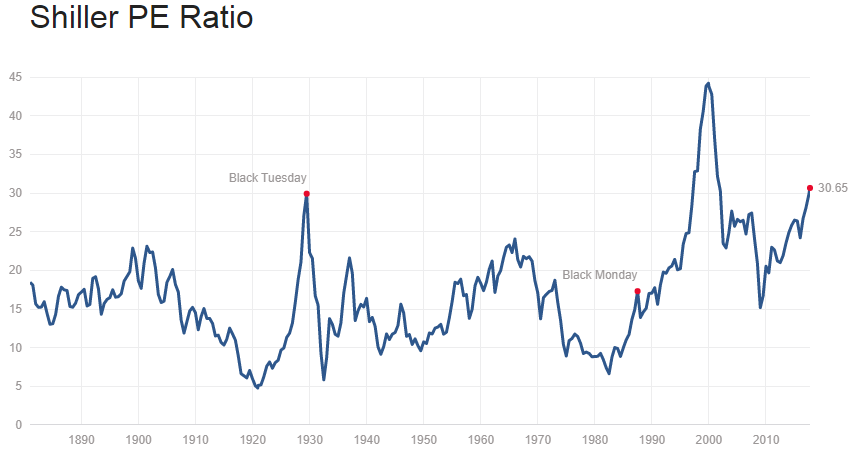
Ummm, 30.65…..are you f$#(ing kidding me? That’s the highest valuation level in history if we adjust for 2000 lack of tech earnings distortion. This is insane. Mind you, the median is around 15-16 and that would cut most indices in half. And that’s assuming the market doesn’t overshoot on the way down.
But worry not my friends…….. 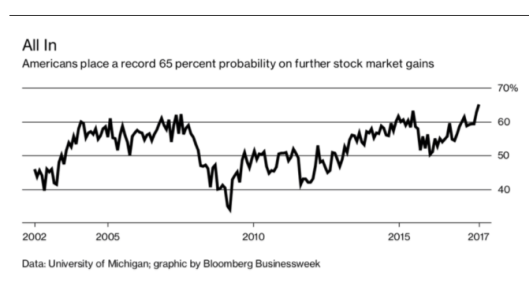
Wait a second….is that bullish or bearish?
Record 65% Think Stocks Will Rise Over Course of One Year: Did the Bell Just Ring?
Considering all of the above it would easy to come to a conclusion that we are in the midst of a massive financial bubble that is about to go “Poooof”. However, an immediate conclusion is often not a correct one.
If you would like to find out exactly what happens next based on our Timing and Mathematical work, please Click Here.