Bitcoin (BTC) Is About To Do What ?

In early January of this year we confirmed Bitcoin’s November of 2022 bottom as a longer-term precise mathematical bottom and have suggested at the time that Bitcoin will run up to above $30K. No one believed us at the time – what else is new. 

It appears now that the proverbial Bitcoin bulls are coming back from the dead, their outlandish predictions are once again gaining steam. Not so fast….here is our latest Bitcoin (BTC) update……

BITCOIN (BTC)
Date of Analysis: October 30th, 2023

Our mathematical and timing analysis for Bitcoin shows the following…….

    • Short-term Bitcoin should remain range bound as it seeks out a mid-term top. We currently do not have any good mid-term time/price projections for this completion point. It’s a bit of a mess. 
    • Once the mid-term top arrives BTC will decline into a major bottom scheduled to arrive around XXXX of 20XX. 
    • We do have some bottom projection points, with the most likely bottom located at XXXX (+/- 100), but we would need a mid-term top point above to confirm this in full. 
    • Once the bottom arrives Bitcoin will turn into a fast mover and surge to a new all time high by about November of 20XX. This is the move to participate in. 

In summary, expect a range bound Bitcoin until a major bottom arrives around XXXX of 20XX. Then a powerful move higher to a new all time high. A more exact targeting analysis will be available as we approach the junctures above. 

If you would like to see our exact TIME & PRICE targets for Bitcoin’s (BTC) major bottom, as well as our precise turning point “targeting analysis” , please CLICK HERE

Why The Smart Money Is Betting On Surge In Volatility

VIX Investwithalex

VIX/VXX continue to trade at the bottom of their respective trading ranges. Over the last few weeks our podcast discussed how commercials are building a massive long position in volatility.  They might not be the only ones.

Almost $100 Million of VIX Options Traded Hands in a Split Second Today

Is someone hedging or are they simply building a massive long position in volatility? While we won’t know for sure, here is what we do know.

  • The stock market has been stuck in a fairly tight trading range over the last 10 months (NYSE). Even more so over the last 5 months. Driving volatility lower.
  • Most stocks are selling at dizzying valuation levels.

Both are temporary. In other words, longer-term, someone is making a smart bet by accumulating volatility (VIX/VXX) at or near today’s levels. Once a bear market kicks in and we break out of this trading range, volatility should skyrocket. If you would like to find out exactly when we anticipate that to happen, please Click Here.

z32

Why The Smart Money Is Betting On Surge In Volatility Google

Just To Reach Historical Norms The S&P Must Fall 50%

PE Ratio

John Hussman, president of Hussman Strategic Advisors, believes the S&P 500 stock index would have to fall by 55 percent to reach historical norms.

“The notion that equity valuations cannot, or will not, revisit normal run-of-the-mill prospective returns (or better) in the coming decade has utterly no support in the historical record. We made similarly ‘preposterous’ but ultimately accurate statements in 2000 and 2007 about the size of the market loss that would likely complete the cycle”.

John is absolutely right and you can see the same from the chart above. The average P/E ratio oscillated around 15 over the last 120 years. And that would indeed warrant close to a 50% haircut from today’s levels.

Impossible? Here is a fun fact. Did you know that between 1899 and 1949, a 50 year period of time, the Dow barely moved. In nominal terms it gained approximately 2% a year. Inflation adjusted, it lost over 25% of its value. The same occurred between 1790 and 1860.

Any notion that we are in some sort of a new economic/financial reality is a foolish one. The stock market is in a massive bubble and it will decline substantially over the next two years. As per our mathematical and timing work. Click Here 

Z31

Just To Reach Historical Norms The S&P Must Fall 50% Google

Alibaba (BABA): More Money Than Brains?

Abibaba BABA InvestWithAlex

When Alibaba (BABA) went public on September 19th, it marked an important top. Large October sell-off started the following day.  On that day I commented on how ridiculously overpriced and over hyped Alibaba was. Alibaba Stupidity. I continue to maintain this view today.

And while Alibaba (BABA) is down 25% since its top in mid November, I believe the party to the downside is just getting started. If you haven’t noticed, Alibaba is trying incredibly hard to spend its IPO money as fast as they can. What are they doing with this money? Investing in other highly speculative and overpriced Internet business. Case and point…

Alibaba is clearly suffering from a severe case of “More money than brains”. Typically, when bear markets kick in (something that is about to happen), such overextended and overvalued companies, particularly the high tech IPOs, tend to collapse 60-90%. In other words, if you have patience, Alibaba (BABA) is one juicy short here.

z33

Alibaba (BABA): More Money Than Brains? Google

Are Yields About To Break Out?

10 Year Note Chart InvestWithAlex

The chart above is probably one of the most important charts in finance today. As you can see, the 10-Year Treasure Note is pushing against a fairly significant short-term resistance level at around 2.25%.

Should it break out, it is likely to reach at least 2.6%. Its long-term resistance level. This brings out a number of important questions. In fact, more questions than anyone can answer at this point. For instance,……

  • Was the secondary bottom in yields set in early January?
  • Will yields now stage a multi-year, even a multi-decade advance?
  • Is this signaling the FED will raise rates and soon?
  • Does this spell doom for the stock market?
  • Etc….

Only time and market action can answer the questions above. At least for now, I am sticking to my overall long-term forecast. The secondary bottom in yields of 1.4-1.5% is not yet in and we are on schedule to see it over the next 12-24 months. If the yields don’t turn around and resume their decline at today’s resistance levels, I fully expect 2.6% resistance line to stop any long-term advance.

z33

Are Yields About To Break Out? Google

As The Dow Goes Negative For The Year, The Worst Is Yet To Come

Daily Chart May 6th InvestWithAlex

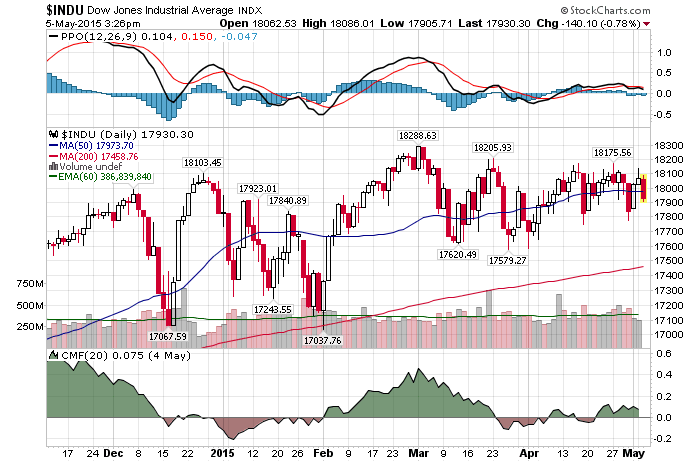
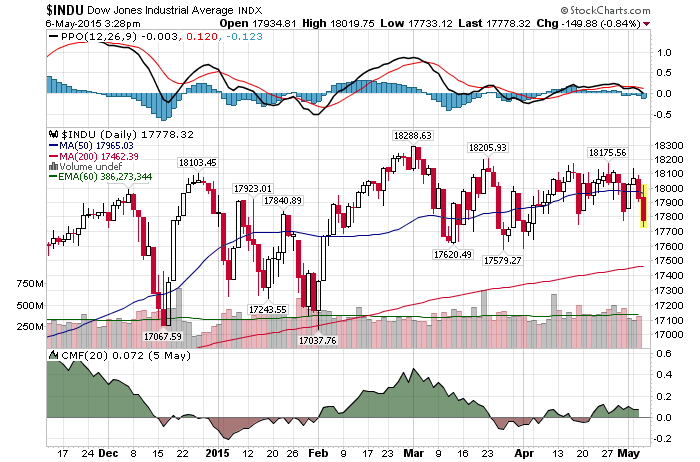
5/6/2015 – Another down day with the Dow Jones down 85 points (-0.48%) and the Nasdaq down 20 points (-0.40%). 

A massive and rather rapid stock market decline is coming later on this year. And while we won’t have a crash, considering the amount of margin debt out there, quite a few people will get wiped out. If you would like to find out exactly when this move will develop, to the day, please Click Here. 

For now, most investors continue to play chicken with the FED. And they will pay dearly for it. I am not sure if the FED can be any more clear here. They WILL raise rates and soon. Plus, when even Janet Yellen suggests that stocks are too expensive….Fed’s Yellen says equity valuations high, warns of ‘potential dangers’…..well, you deserve to lose a lot of money if you maintain a net bullish position going forward.

At the same time, maybe the bulls are right. According to quite a few market pundits, the party in the equity markets hasn’t even started yet. Case and point.

I cannot stop shaking my head in disbelief. To save you some time, here is what was said:

“This is an extraordinary buying opportunity, buy any and all dips, with zero interest rates the price of equities could be infinite, this bull market will continue, valuation don’t matter anymore, etc….”

Valuations don’t matter……infinite run ups are just around the corner …..buy now. That sounds familiar. If I didn’t hear the exact same thing at 2007 and 2000 tops, well, call me a fool.

Again, the underlying assumption in both cases is the same. We are in such a unique monetary easing environment that there is no way in hell the markets can go down. Maybe so, but here is the major point that most investors miss. Today’s market environment becomes a matter of psychological setup as opposed to a fundamental background.

When everyone and their day trading grandmother believe that we are in such a bullish environment, the market is getting ready to reverse. Why? Well, it’s rather simple, everyone has already bought into the long side of the market. Contrary to the opinion of the market pundits above, I would argue that the only opportunity here is on the short side (or in cash).

This conclusion is further supported by my mathematical and timing work. It clearly shows a severe bear market between 2015-2017. In fact, when it starts it will very quickly retrace most of the gains accrued over the last few years.  If you would be interested in learning when the bear market of 2014/15-2017 will start (to the day) and its internal composition, please CLICK HERE.

(***Please Note: A bear market might have started already, I am simply not disclosing this information. Due to my obligations to my Subscribers I am unable to provide you with more exact forecasts. In fact, I am being “Wishy Washy” at best with my FREE daily updates here. If you would be interested in exact forecasts, dates, times and precise daily coverage, please Click Here). Daily Stock Market Update. May 6th, 2015  InvestWithAlex.com

Did you enjoy this article? If so, please share our blog with your friends as we try to get traction. Gratitude!!!

As The Dow Goes Negative For The Year, The Worst Is Yet To Come  Google

Capital Outflows And How Fast They Will Collapse The Market.

Daily Chart May 5th InvestWithAlex

5/5/2015 – A down day with the Dow Jones down 142 points (-0.79%) and the Nasdaq down 78 points (-1.55%)

Despite bullish spirits running high, the stock market has been stuck in a flat trading range for over 10 months now (NYSE). And while most stock prices are miraculously maintaining their upper range, fund outflows are starting to match 2008 panic levels.

In April, U.S. equity mutual funds and ETFs saw outflows of $35.8 billion, according to TrimTabs. That’s the biggest move away from American stocks since October 2008. And the bearish tone is confirmed by the flows in the leveraged ETF space, where leveraged short ETFs saw an increase in assets of 4.6 percent, while leveraged long ETFs saw assets dip by 2.5 percent.

But Wait, There’s More! There is always a bull lurking around, ready to put a positive spin on the news above.

“I actually think it could be a positive for U.S. stocks, because the more people are fleeing equities, the less likely we are to have a crash instantaneously,” Boris Schlossberg of BK Asset Management.  “It’s only when we have bubble-kind-of-conditions that leads to very sharp corrections in equities.”

If my mathematical and timing work is correct, the final leg of a secular 2000-2017 bear market is just around the corner. The only remaining question is, how fast will any such bear leg develop…….will it be a crash or a prolonged decline?

Both. If my work is accurate we should see a fairly rapid sell-off when the TIME is right. Considering today’s market setup and the overall bullish overtone, it will catch most investors by surprise. That will be followed by a quick bounce and a subsequent prolonged decline into the final bottom. In other words, those without this timing and mathematical breakdown stand zero chance of NOT losing money over the next few years.

This conclusion is further supported by my mathematical and timing work. It clearly shows a severe bear market between 2015-2017. In fact, when it starts it will very quickly retrace most of the gains accrued over the last few years.  If you would be interested in learning when the bear market of 2014/15-2017 will start (to the day) and its internal composition, please CLICK HERE.

(***Please Note: A bear market might have started already, I am simply not disclosing this information. Due to my obligations to my Subscribers I am unable to provide you with more exact forecasts. In fact, I am being “Wishy Washy” at best with my FREE daily updates here. If you would be interested in exact forecasts, dates, times and precise daily coverage, please Click Here). Daily Stock Market Update. May 4th, 2015  InvestWithAlex.com

Did you enjoy this article? If so, please share our blog with your friends as we try to get traction. Gratitude!!!

Capital Outflows And How Fast They Will Collapse The Market. Google

Bet Against The FED: The Only Way To Generate Returns Moving Forward

Stan Druckenmiller made over $1 Billion by betting against the bank of England with George Soros in the early 1990’s. In other words, when he talks, you better pay attention. And what does he have to say today? The exact same thing I have been yapping on this blog for quite a while now.

I know it’s so tempting to go ahead and make investments and it looks good for today,” the retired founder of Duquense Capital Management said, “but when this thing ends, because we’ve had speculation, we’ve had money building up four to six years in terms of a risk pattern, I think it could end very badly.

There is nothing more deflationary than creating a phony asset bubble, having a bunch of investors plow into it and then having it pop.

I feel more like it was in ’04 when every bone in my body said this is a bad risk/reward, but I can’t figure out how it’s going to end. I just know it’s going to end badly, and a year and a half later we figure out it was housing and subprime. I feel the same way now.

When you have zero money for so long, the marginal benefits you get through consumption greatly diminish, but there’s one thing that doesn’t diminish, which is unintended consequences.

When this thing ends, because we’ve had speculation, we’ve had money building up for four to six years, in terms of a risk pattern, I think it could end very badly.

Then again, feel free to listen to your Charles Schwab financial adviser and go long on margin. 

Z30

Bet Against The FED: The Only Way To Generate Returns Moving Forward Google