Compared to the mathematical and timing work we do on this site, the Dow Theory is like a bit up 1971 Ford Pinto. Nevertheless, since a lot of people follow it to try and predict the market here are my two cents.
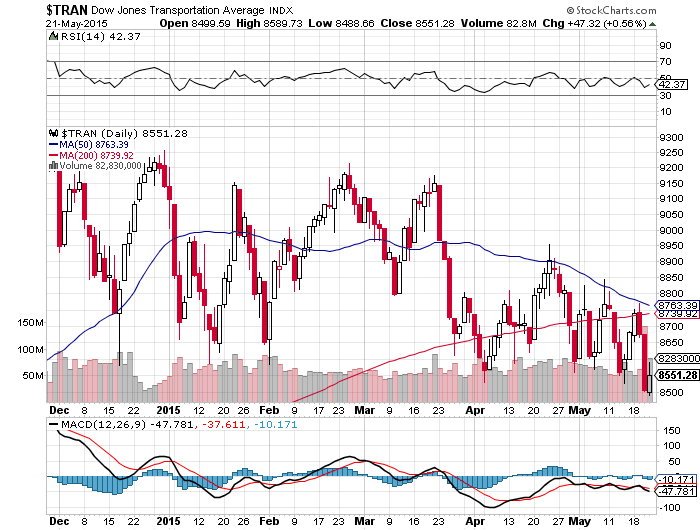
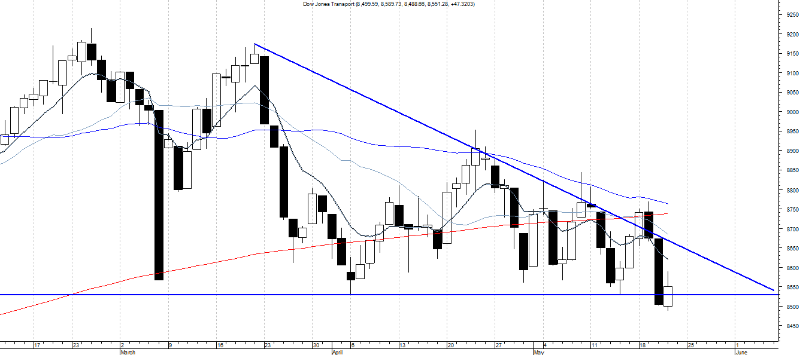
With the Dow Industrials and the Dow Transports diverging and non-confirming a number of warnings sings have occurred. Of course, the subscribers to my premium service know exactly why there is no confirmation. At the end of the day it is all about timing. The DOW Jones is tracing out it’s exact mathematical structure that will complete only when the time is right. There is another problem with the DOW Theory. They would have to wait for the DOW to go below 15,373 for the bear market confirmation to occur.
To late in my opinion. If you would be interested in learning exactly when the bear market of 2014-2017 will start (to the day) and it’s internal composition, please CLICK HERE.

Did you enjoy this article? If so, please share our blog with your friends as we try to get traction. Gratitude!!!

Click here to subscribe to my mailing list
Attention: Dow Theory Predicts A Bear Market? Google
WSJ: Morning MoneyBeat: Dow Theory Flashing a Warning Signal
MARKET SNAP: At 6:50 a.m. ET, S&P 500 futures up 0.2%. Treasury yields fall to 2.72%. Nymex up 33 cents at $99.93; gold 0.3% higher at $1315.30/oz. In Europe, FTSE 100 up 1%, DAX up 1.1% and CAC 40 up 1.1%. In Asia, Nikkei 225 down 0.4% and Hang Seng down 0.5%.
The market looked weak on Monday, saved only by a late spurt of buying that narrowed the losses. It may not be the last time it looks weak.
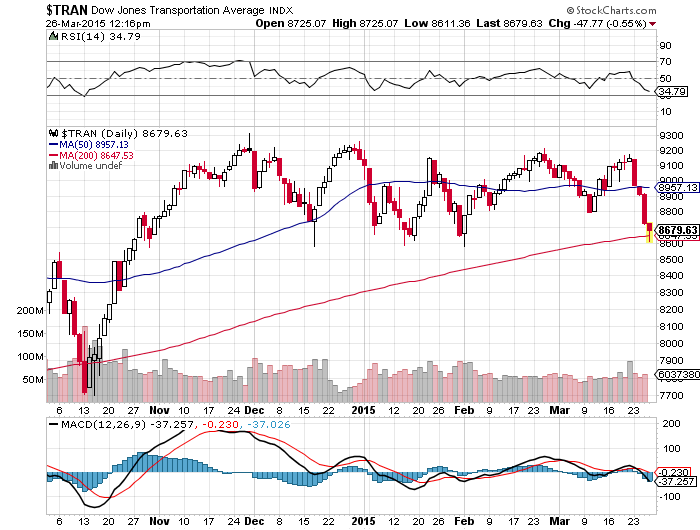
The much ballyhooed Dow Theory is flashing a warning sign: While the Dow Transports made a new high in March, the Dow Industrials did not. The latter’s failure to hit a new high is currently a red flag.
“This leaves a Dow Theory non-confirmation still in place,” said technical analyst JC Parets, founder of Eagle Bay Capital.
Why? Well followers of the century-old Dow Theory–popularized by Charles Dow–maintain the industrials and transports need to move in lockstep to confirm a market’s trend. A pattern of higher highs and lower lows serves as confirmation of the market’s move.
The theory is based on the thinking that making goods is one leg of the industrial economy and moving those goods around is the second leg, so their trends should be in sync.
Since the Dow Transport hit a year-to-date high of 7627.44 on March 7, both the transports and industrials have sagged. The Dow Transport closed at 7510.38 Monday, while the Dow industrials finished at 16276.69.
To see another buying signal, the Dow industrials would have to cross above its early March levels, while the transports would need to maintain its momentum.
“It would take a close above 16588 in the Dow (industrials) this week to corroborate the new high in the transports and clear the way for more near-term U.S. broad market strength,” wrote the team at Asbury Research. “Until then, this warning signal remains intact.”
A sell signal would be triggered if both made new lows, and Mr. Parets pointed to the Feb. 3 lows, 15373 for the industrials and 7054 for the transports, as the critical levels. “This would tell us that the trend has changed,” he wrote. “Until then, it’s more of a red flag (a big red flag).”
Asbury thinks the market is at a “minor inflection point,” and if new highs aren’t made between now and the end of the month, the market could turn back down (they pointed to 1825 on the S&P 500 as a key level), and it would be “the beginning of an overdue correction.”