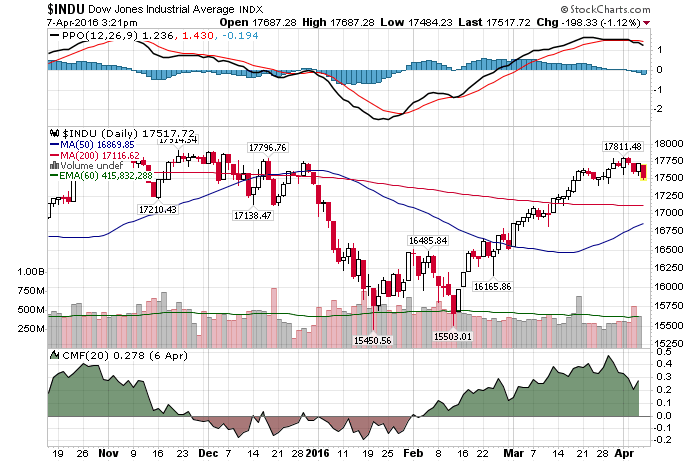
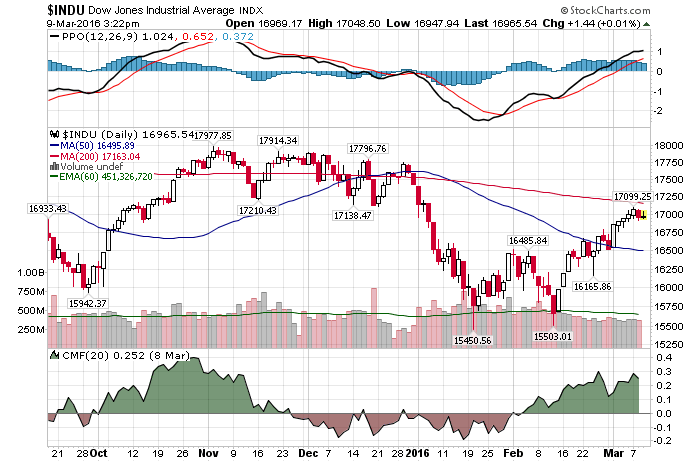
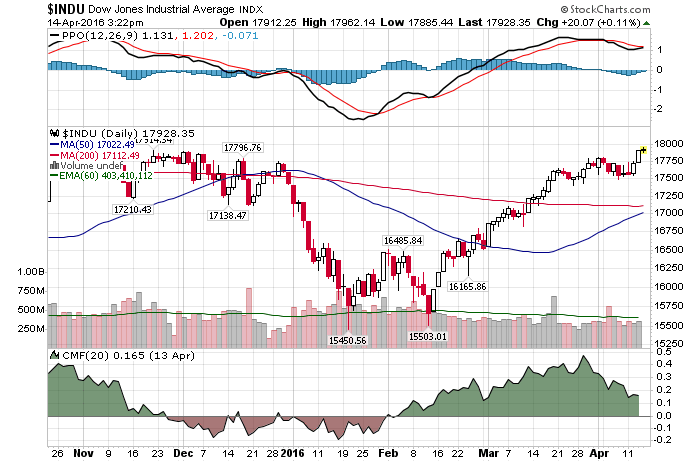
 4/14/2016 – A mixed day with the Dow Jones up 17 points (+0.09%) and the Nasdaq down 2 points (-0.03%).
I typically shy away from giving direct “financial advice”, but this one is a no-brainer. At least based on my long-term mathematical and timing work.
I am executing this “Trade” for myself and I have instructed my entire family to do the same. Most importantly, I believe this “Trade” will allow individuals to do the incredible. That is, to legally loot the bank of their choice. Literally. A truly once in a lifetime opportunity.
Let’s start from the beginning.
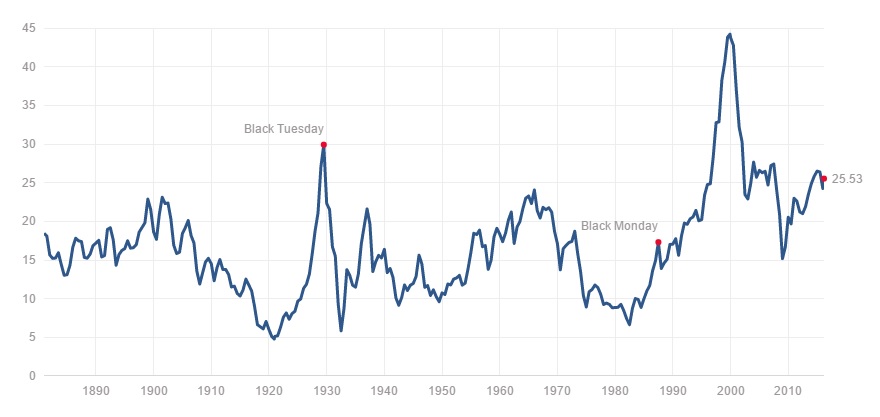
- Over the last two years I have maintained that we will see a double bottom in the 10-Year Treasury Note. Here is a sample post from last year 10-Year Note: All Systems Are A Go For A Double Bottom
- Well, guess what…..we are nearly there. As the chart below shows.
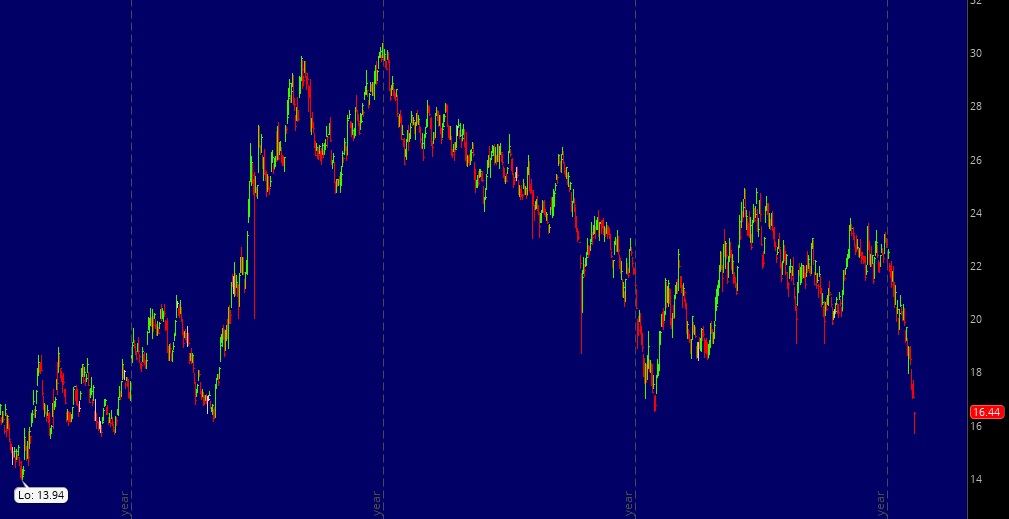
Whether we still push lower, into a double bottom, perhaps even lower is pointless for the purposes of this post. The time to act is NOW. I would say you have about 1-12 months to get this trade done. And the sooner you do it, the better.
What is this trade?
- We are witnessing a multi-generational bottom in interest rates. Refinance and lock in your loans at a fixed rate and do it now. The longer the duration of the loan the better.
- The FED will be forced to inflate away or monetize the dollar or our massive debt.
- Most of your fixed loan value (not underlying asset) will be wiped out through inflation. In other words, you will stick it to the bank. Big time.
Why/How?
Here is what will happen over the next 10-20 years. At least based on my mathematical and timing work.
We are are about to go through a major bear market leg. Since the FED is sitting at zero interest rates already, they will be forced to do additional rounds of QE and to even go Interest rate negative. My work suggests that the US Dollar and Interest rates will have none of that. At a certain point.
The US Dollar will decline while Interest rates head higher (market rates). Additional stimulus will finally get inflation going. An inflation that will accelerate over the next 10-15 years. Think in terms of 1966-1982 period of time.
By the time it is all said and done, in about 20 years, your fixed mortgage might be inflated away to the tune of 75-90%. To the point where a $500,000 fixed 30 year loan and $3,000 monthly payment today, might only be worth about $100,000 or $500 monthly in today’s money. The rest of its value will simply vanish.
In other words, you win and banks lose……..for once.
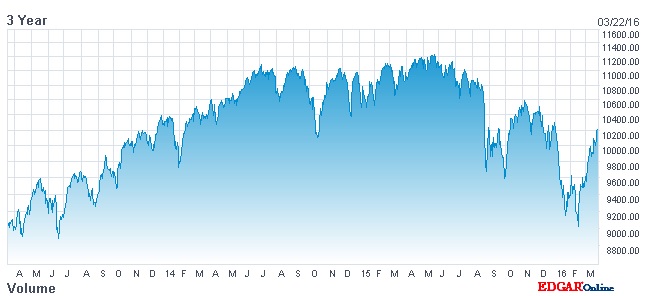
This conclusion is further supported by my mathematical and timing work. It clearly shows a severe bear market between 2015-2017. In fact, when it starts it will very quickly retrace most of the gains accrued over the last few years. If you would be interested in learning when the bear market of 2015-2017 will start (to the day) and its internal composition, please CLICK HERE.
(***Please Note: A bear market might have started already, I am simply not disclosing this information. Due to my obligations to my Subscribers I am unable to provide you with more exact forecasts. In fact, I am being “Wishy Washy” at best with my FREE daily updates here. If you would be interested in exact forecasts, dates, times and precise daily coverage, please Click Here). Daily Stock Market Update. April 14th, 2016 InvestWithAlex.com
Did you enjoy this article? If so, please share our blog with your friends as we try to get traction. Gratitude!!!