Buy Low, Sell High, Go Short & Cover Finale

stock market cycle

Continuation from Friday……..(Buy Low, Sell High, Go Short & Cover Summary)

Making the Buy Low, Sell High, Go Short & Cover approach the best investment strategy for all types of investors. For the following reasons.

Risk Reduction:

  • Through the purchase of undervalued securities.
  • Through knowing where in the cycle you are.
  • Though having the ability to be on both sides of the trade at appropriate times.

Maximizing Profits:

  • Through having the ability to profit from both sides of the move. Long and short.
  • Through purchasing undervalued securities with significant upside potential or shorting overvalued securities with a lot downside.
  • Through compressing anticipated gains into the shortest time frame possible.

A number of examples were provided to verify the strategy.  For instance, it was shown that the Buy & Hold investment strategy would yield a ROI of 525% between 1994 bottom and today through an investment in the Nasdaq. By comparison, the Buy Low, Sell High, Go Short & Cover investment strategy would yield a total compounded return of 8,015% during the same period of time. A final return that is 15 times higher than what most investors were able to achieve if they were lucky enough to hold on to their positions over the last 20 years.   Most importantly, this higher return was obtained while minimizing risk.

Finally, the strategy above can be applied towards most financial instruments and in all market conditions. Once investors determine exactly where they are in the overall cyclical composition of the move, top or bottom, they can initiate an appropriate position when the confirmation is obtained. Then move in and out as the strategy dictates.

The best part about the Buy Low, Sell High, Go Short & Cover investment strategy is the returns it offers. The two examples provided in this book are nothing but a scratch on the surface of what’s possible. If given more time and through proper application of the techniques described in this book, the returns on both investments should expand exponentially. And that’s just the start. Investors or traders that work with shorter time frames might be able to move in and out more frequently, compounding their returns even faster.

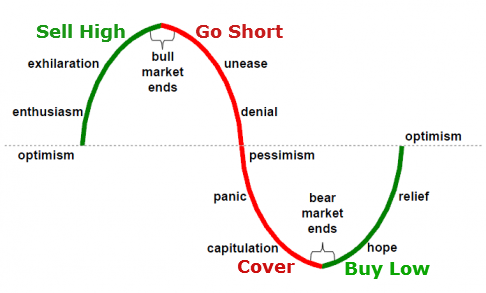
In conclusion, the approach presented in this book forces investors to move with the market and not against it. And that is contrary to what most investor tend to do. It is well known fact that most investors tend to pile in right at the top or when they feel the most optimistic, only to liquidate their positions near the bottom.  Our Buy Low, Sell High, Go Short & Cover investment strategy forces investors to do exactly the opposite. It forces them to move with the market at all times and in all market conditions.  Minimizing the risk and guaranteeing outsized returns in the process.

z32

Buy Low, Sell High, Go Short & Cover Finale Google

Buy Low, Sell High, Go Short & Cover Summary

stock market cycle

Continuation from yesterday…..(Why Warren Buffett Is Wrong About Trading In and Out)

Summary & Conclusion

We have started this book with a simple premise of trying to figure out which investment approach is the best. During the process we have looked at number of investment strategies most commonly associated with the industry. Including value investing, growth investing and various disciplines of active trading.  We have discussed short selling and why the process is not as risky as industry insiders make it out to be. Shortly thereafter and rather quickly we have arrived at a juncture where our priorities were clarified. At the end of the day, most investors want the following.

  • A massive capital gain.
  • In the shortest possible period of time.
  • While taking on very little, if any, risk.

Yet, most of the traditional investment strategies had failed in satisfying all three requirements. As it stands, most commonly practiced investment approaches concentrate on either risk minimization at the cost of ROI or higher returns at the risk of capital.  A new approach was needed.

The author introduced such an approach in the form of Buy Low, Sell High, Go Short and Cover investment strategy.

Although the strategy initially appeared to be complex and unattainable, in reality, it was straight forward and fairly easy to implement.  A simple set of rules was provided.

  • Rule #1: Buy Substantially Undervalued Securities (Minimizing Risks & Maximizing Returns).
  • Rule #2: Sell & Go Short When Technical and Timing Indicators Confirm (Trading)
  • Rule #3: Cover Your Short Positions & Go Long When Technical and Timing Indicators Confirm (Trading)
  • Rule #4: Know Exactly Where You Are At All Times.

In other words, follow the chart.

To Be Continued On Monday……

z32

Buy Low, Sell High, Go Short & Cover Summary Google

Why Warren Buffett Is Wrong About Trading In and Out

NFLX2

Continuation from yesterday…….(What Will Happen To Netflix When A Bear Market Starts)

Justifiably, some will argue that constant trading in and out of your position can increase capital gains taxes and therefore reduce returns. Let’s take a quick look at the numbers based on the Netflix’s trading pattern above to settle the matter once and for all.  First, we have to make the following assumptions.

  • You fall into the 25-35% tax bracket and your long-term capital gains tax is 15%.
  • Your average ordinary income tax is 30%.
  • We liquidated our position as of today at $460. Giving us a net realized total return of 1,740% for “Buy and Hold” and 10,817% for “BLSH”.
  • Original investment of $100,000

If we run the scenario above our total after tax return on investment for the “Buy and Hold” investment strategy will yield a return of $1,479,000 or 1,479%.

For the “Buy Low, Sell High, Go Short & Cover” investment strategy and based on the trades above, an after tax return on investment will be equal to $6,977,321 or 6,877%. If you are counting, that is still more than 4.5 times higher than a simple buy and hold approach used by most investors out there.

Finally, there is yet another hidden benefit to our newly discovered investment strategy. Investors who follow the “Buy Low, Sell High, Go Short & Cover” strategy should be able to avoid company or industry specific risks associated with investing in certain companies.

One of the most common mistakes all investors commit when making long-term investment decisions is relying too heavily on the fundamental analysis. And while fundamental analysis is great, it is fairly useless when it comes to identifying proper entry and exit points. In fact, in 99% of the time the underlying stock price will either surge or collapse by the time important fundamental factors flow though the company’s financial statements or press releases.

Remember, the stock market is a future discounting mechanism.  That means the stock price is likely to reflect all changes before they become evident on the fundamental level. For instance, earlier in the book we have looked at the Nasdaq’s trading pattern over the last 20 years.  And we don’t have to go further than 2007 top and 2009 bottom to illustrate this principal in action. At 2007 top most market participants were incredibly bullish. The US economy was doing great, fundamentals looked good and the FED Chairman Bernanke was concerned about the economy overheating as late as second quarter of 2008.

Yet, the stock market topped out on October 11th, 2007 and accelerated down. By the time fundamentals caught up to the stock market in 3rd and 4th quarter of 2008, about 75% of the entire decline was complete.  The situation was entirely reversed at 2009 bottom. If you recall, most media and financial outlets were calling for the next “Great Depression” and the sky couldn’t be darker.  Luckily, the stock market bottomed on March 6th, 2009 before staging a massive 5.5 year rally.  And again, it took the fundamentals about two years to catch up with all of the positive developments.

Point being, once again, by the time underlying fundamentals filter though, it is oftentimes too late to either get in or get out.  The same line of thinking applies to all individual stocks. When we apply “Buy Low, Sell High, Go Short & Cover” investment strategy we gain the ability to avoid the risk of being caught on the wrong side of the trade. It allows us to eliminate the risk of waiting to see what happens from the fundamental perspective. It allows us to avoid losses most often associated with unforeseen consequences associated with investing.  Most importantly, it puts us in the position of power.

For instance, Netflix’s 2011-2012 collapse gives us a perfect illustration of the subject matter. Outside of its general overvaluation there were no fundamental reasons for Netflix to go through a 75% correction during that time. Certainly not in 4 months. Yet, the stock price topped out in July of 2011 and quickly collapsed.  Followers of “Buy Low, Sell High, Go Short & Cover” wouldn’t care why the stock price was collapsing. They would have exited the stock and gone short as soon as the technical confirmation was obtained.

Subsequently, investors would find themselves at the bottom of the trading range were all of Netflix’s “Fundamental Bad News” would have come out. And while it would be too late for traditional investors who would be sitting on top of massive losses, followers of BLSH would find themselves in a position of power. Trying to decide whether the fundamental news are indeed bad or if the fears are being overblown and the stock price is likely to bounce. Allowing them to re-enter the position right at the bottom or as soon as the stock begins to break out.

In other words, Buy Low, Sell High, Go Short and Cover allows investors to minimize risks most commonly associated with relying too heavily on fundamental analysis.

To Be Continued Tomorrow……..

Z31

Why Warren Buffett Is Wrong About Trading In and Out Google

What Will Happen To Netflix When A Bear Market Starts

fab 5 stocks

Continuation from yesterday……(Trading Netflix Using BLSH)

Netflix’s stock price broke above its higher high and down slopping trend line in January of 2012, suggesting that the decline was now over. As a result, our short position should have been covered at approximately $75 a share in January of 2012 or as soon as this confirmation was obtained.

Trade #3: Cover your short position at $75 and go long at the same time/price. Trade net realized gain $160 or 68%. Net realized gain up to date $395 or 1,480%.

Before surging higher in 2012 the stock re-tested its lows in the mid and late 2012. Setting in a lower low in the process. Investors should have been very careful at this juncture.  A consideration should have been given to the fact that the decline was not over and that we might have gotten back into the stock a little too early.  Luckily, the stock never broke below its critical support levels before rebounding and initiating its come back rally.

That brings us to today. As of September 2014, Netflix’s stock price trades in the $425-475 range. Yet, a bear market is brewing on the horizon. The overall stock market is selling at unsustainable valuation levels and Netflix’s stock is, once again, pushing into a bubble territory. In other words, the stock market is possibly sitting on a verge of a massive sell off and the Netflix might lead it down.  As a result, investors in the stock should be watching the situation very carefully. Ready to liquidate their net long position and to go short as soon as some sort of a confirmation is obtained.

Proposed Trade #4:  Liquidate your long position at $430 and go short at the same price/time. Net realized gain $355 or 473%. Net realized gain up to date $745 or 2,900%.

Compare this return to the Buy & Hold strategy ROI of 1,800% and you begin to realize just how powerful this approach is.  And that is before an upcoming bear market leg develops. If Netflix’s stock price declines just 30% in a bear market, the Buy & Hold strategy ROI will slide to 1,200%. That is while Buy Low, Sell High, Go Short & Cover investment strategy ROI will zoom up to 3,480%. Proving, once again, the validity of the strategy.

Justifiably, some will argue that constant trading in and out of your position can increase capital gains taxes and therefore reduce returns. Let’s take a quick look at the numbers based on the Netflix’s trading pattern above to settle the matter once and for all.  First, we have to make the following assumptions.

  • You fall into the 25-35% tax bracket and your long-term capital gains tax is 15%.
  • Your average ordinary income tax is 30%.
  • We liquidated our position as of today at $460. Giving us a net realized total return of 1,740% for “Buy and Hold” and 3,020% for “BLSH”.
  • Original investment of $100,000

To Be Continued Tomorrow…….

z33

What Will Happen To Netflix When A Bear Market Starts Google

Trading Netflix Using BLSH

Continuation from Friday…..(Long/Short -OR- Buy Low, Sell High, Go Short & Cover?)

Shortly after its IPO in May of 2002 the company’s stock price settled into a fairly stable trading range.  Oscillating between $10 and $40 from mid 2003 to November of 2008. At which juncture the stock price broke out of its trading range to zoom up to its intermediate top of $300 by July of 2011. Collapsing to $64 or 78% shortly thereafter before staging a massive come back rally to approximately $475 by the third quarter of 2014. Where the stock price remains today. 

Let’s for a second assume that you were fortunate enough to invest in Netflix Inc, for whatever reason, sometime between 2003 and 2008 at an average price of $25. If you are still holding this investment your ROI is around 1,800%. A fairly good outcome considering a holding period of around 10 years. However, let’s take a look at what would have happened if Buy Low, Sell High, Go Short & Cover investment strategy was instituted instead.

Trade #1: Buy NFLX at an average price of $25 sometime between 2003 and 2008.

As the stock priced pushed into its 2011 July top, all Netflix investors should have been gravely concerned. For a number of reasons. First, the stock ran up close to 1,500% in just 2.5 years. Suggesting that a speculative bubble was forming. Second, by 2011 most of the company’s fundamentals were out of sync with any sort of reasonable valuation levels.  Finally, the cyclical and mathematical market structure suggested that a 5-year bull market that started in March of 2009 was about to take a one year break in its 2-1-2 internal composition.

In other words, given the circumstances above, investors should have been watching for signs of a reversal. Ready to liquidate their long positions and to go short immediately.

NFLX2

The first sign of a reversal occurred in August of 2011 when NFLX broke below its upward trending support line at around $265. Investors should have liquidated their long positions at that time and gone short as the correction was just beginning.

Trade #2: Liquidate your long position at $260 and go short at the same price.  Net realized gain up to date $235 or 940%.

Netflix’s stock price proceeded to quickly collapse to $64 by November of 2011. Representing a 79% decline from its top of $300 just four months earlier. This was a massive drop and all investors (long or short) should have been aware that such quick declines are unusual, the stock was now oversold and that some sort of a bounce was coming.  That is to say, investors should have been watching for a bottom. Ready to cover their short positions and to go long as soon as some sort of a reversal confirmation was obtained.

To Be Continued Tomorrow…….  

Z30

Trading Netflix Using BLSH Google

What You Ought To Know About Buy Low, Sell High, Go Short & Cover

short selling

Continuation from yesterday…….(The Future Of Nasdaq)

Trade #6 (Anticipated): Exit your long position at 4,300 and go short. Anticipated move gain 2,950 points. Anticipated net realized gain up to date 12,780 or 1,675%.

To quickly summarize, our three investment strategies yielded the following returns between November of 1994 and September of 2014.

  • Buy & Hold: 525%
  • Most Likely Outcome (Average): 425%
  • Buy Low, Sell High, Go Short & Cover: 1,675%

What’s more, by the time a bear market of 2014-2017 completes itself, the first two investment strategies should see their ROI slashed to approximately 300% while the Buy Low, Sell High, Go Short & Cover investment strategy should see its return zoom up to approximately 1,900%. A return on investment that is more than six times higher when compared to what others were able to achieve.  Finally putting to rest the question of what general investment strategy is the best.

Is it really possible to achieve this 16% annualized rate of return without taking on any additional risk?

What most people don’t realize about the proposed investment strategy is that it minimizes risk, not increases it. Think about it in the following fashion. What was more risky, remaining fully invested on the Nasdaq at 2000 and 2007 tops or going short when the tops were confirmed?

Contrary to a popular believe it was exponentially more risky to remain net long at both tops for the following reasons. First, the markets were extremely overvalued and speculative at the time, assuring that any future gains would be miniscule.  Second, the risks associated of major declines and even crashes were too great at both tops.  Finally, the Nasdaq’s cyclical composition clearly showed that dangerous sell offs were just ahead.   Just as it does today.

The best part about Buy Low, Sell High, Go Short & Cover is that this investment strategy works on all time frames and on most commonly used financial instruments. For instance, while the Nasdaq example above uses long-term market developments, the same strategy can be applied to daily trading of any individual stock. For as long as the trader knows exactly where they are in the cyclical composition of the underlying security.

How is this different from Long/Short investment strategy?

If you are not familiar, Long/Short investment strategy is most commonly associated with hedge funds and other professional investors who play on both sides of the market. It involves buying long equities that are expected to increase in value and selling short equities that are expected to decrease in value.  And while it might appear similar to Buy Low, Sell High, Go Short & Cover, it is anything but.  Here is why.

To Be Continued Tomorrow………

Z30

What You Ought To Know About Buy Low, Sell High, Go Short & Cover Google

The Future Of Nasdaq

3nasdaq

Continuation from yesterday….(The Secret Behind Timing 2007 Market Top)

That brings us to today. Between March of 2009 and September of 2014 the Nasdaq ran up from 1,200 to about 4,500. Exhibiting all of the signs typically associated with a 5-year cycle. Particularly, the market surged higher for 2 years (2009-2011), rested for one year (2011) and then resumed its surge higher for the next 2 years (2012-2014). This is a typical internal composition of a 5-year cycle.

The only deviation of the cycle thus far is its longevity. As was suggested earlier in the book, 5-year cycles are typically exact, lasting no longer than 5 years +/- 2 months. As of this writing the 2009-2014 cycle has been in development for more than 5.5 years. While unusual, it is not unheard of. For instance, the 1924-1929 5-year cycle lasted 5.5 years as well, leading right into the 1929 stock market crash.

What’s more, many market participants have come to a conclusion that a bear market that started in 2000 has completed itself at the bottom in March of 2009 and that we are now in a full blown secular bull market.  Sadly, nothing could be further from the truth. Since the stock market first started trading in May of 1790 not a single bear lasted 9 years. Once again, a 17-18 year alternating bear/bull cycle is always present. Plus, given today’s extreme overvaluation/speculation levels and macroeconomic issues, it is evident that the stock market is set for some sort of a decline.  Finally and as was mentioned earlier, all secular bear markets tend to complete themselves with a final 2-3 year bear market leg.

This sort of an arrangement gives us a perfect opportunity to illustrate how one should prepare for a bear market by selling at the top and going short. Given the setup above an analyst following the market and following the “Buy Low, Sell High, Go Short & Cover” investment strategy would be watching the market with extreme caution. Ready to sell his net long position and to go short at a moment’s notice.

What would justify such a move? If the Nasdaq breaks below its lower low and continues lower. That would be a first sign that the market has changed gears and shifted into a multiyear bear market.

Trade #6 (Anticipated): Exit your long position at 4,300 and go short. Anticipated move gain 2,950 points. Anticipated net realized gain up to date 12,780 or 1,675%.

To Be Continued………

z33

The Future Of Nasdaq Google

The Secret Behind Timing 2007 Market Top

2002 nasdaq

Continuation from yesterday…….What You Ought To Know About Shorting Nasdaq In March Of 2000

This simple strategy would have allowed investors to cover their short positions and go long shortly after the bottom was reached.

Trade #3: Cover your short position at 1,350 in October of 2002 and go long.  Move realized gain 3,400. Net realized gain up to date 7,430 or 931%.

What followed was a 5 year bull market represented by an exact 5 year cycle. Lasting between October 10th, 2002 and October 11th, 2007. Once again, any analyst familiar with the work above would have known two things. First, once the five year cycle was over the market was likely to start its next bear leg down. Second, this bear leg would represent a “Mid-Cycle Panic” discussed earlier or the fastest moving decline of the entire 2000-2017 bear market.

In other words, such an analyst should have been looking for a market reversal as soon as October of 2007. Ready to liquidate his or her long position and to go short. Such a confirmation arrived in early January of 2008 when the Nasdaq broke below both its lower low and a rising trend line. Once the confirmation was received a long position should have been liquidated and a short position should have been established.

Trade #4: Exit your long position at 2,550 in January of 2008 and go short at the same time. Move realized gain 1,200. Net realized gain up to date 8,630 or 1,100%.

As expected, the market proceeded to collapse between October of 2007 and March of 2009. When the mid cycle panic ended most indices had lost in excess of 50%. The Nasdaq bottomed on March 9th at 1,265. An analyst familiar with the cyclical composition of the market would have known that “Mid-Cycle Panics” do not last longer than two years. In addition, given the extent of the decline on the Dow and due to a number of powerful cycles arriving in early March of 2009, it would have been a good guess that the market was about to bottom.  As such, a bottom of some sort should have been anticipated in the first half of 2009.

The first signs of a reversal occurred in late March and early April of 2009 when the Nasdaq both broke above a down slopping trend line and set a higher high. Suggesting a trend reversal. A short position should have been covered at the time and a log position should have been established.

Trade #5:  Cover your short position at 1,350 in April of 2009 and go long at the same time. Move realized gain 1,200. Net realized gain up to date 9,830 or 1,265%.

To Be Continued Tomorrow……

z33

The Secret Behind Timing 2007 Market Top Google

What You Ought To Know About Shorting Nasdaq In March Of 2000

nasdaq

Continuation from Friday….. (How You Could Have Made A Fortune Shorting The Nasdaq)

That is exactly what happened in early March of 2000. The Nasdaq topped out at around 5,050, declined slightly into the middle of March before bouncing up into a perfect bearish setup by March 24th.  An analyst familiar with the cyclical work above would have been aware that if the March bottom of 4,800 was to be penetrated on the downside a bear leg and a possible crash would be in the cards.

As soon as such confirmation was realized, all investors following the “Buy Low, Sell High, Go Short & Cover” investment strategy should have exited their net long Nasdaq positions and reversed their portfolios to net short. Immediately. And indeed, the confirmation was received by the end of March when the Nasdaq broke below its March 17th bottom of 4,800.

Trade #2:  Exit long position at 4,750. Reverse course and go short at the same price. Net realized gain up to date 4,030 points or 560%.

As soon as March low was broken on the downside the Nasdaq quickly collapsed by more than 30%, reaching its intermediary bottom by the end of May. Yet, investors familiar with the overall cyclical composition of the market would have been aware that bear market legs do not last 60 days.  They would have been aware that this collapse was just the start of a prolonged bear market cycle.

Furthermore, they would have been aware that initial bear market legs tend to last 2-3 years as all previous bear markets had initiated with such prolonged declines. For example, 1900 top to 1903 bottom, 1929 top to 1932 bottom and 1966 top to 1970 bottom. The Nasdaq continued to decline until it reached its bottom of 1,108 on October 10th, 2002. An 80% decline.

By the time October 2002 bottom was reached, analysts familiar with the cyclical work above should have been, once again, on a heightened state of alert. This time around they would have been anticipating and looking for a market bottom.  Ready to cover their short positions and to go long at a moment’s notice.  Such a confirmation was obtained when the market broke above its down trending trend line in October of 2002.

To Be Continued Tomorrow……

Z30

What You Ought To Know About Shorting Nasdaq In March Of 2000 Google

How You Could Have Made A Fortune Shorting The Nasdaq

stock market cycle

Continuation from yesterday……(The Composition Of 2000 -2017 Bear Market)

Investment Strategy #2: What Most People Did  (The Reality….Worst Possible Outcome).

Think about the following for a second. While “Buying & Holding Forever” is a nice catch phrase, very few investors out there can do so consistently. For instance, how many people do you know that were able not only to hold on to most of their stock positions during the bear legs of 2002 and 2008, but to add to their positions during the time. Chances are, not many.

For the purposes of this discussion, let’s assume that ….

  • You were fortunate enough to originate your position in November of 1994. Right before the final 600% run up took place.
  • Subsequently, you sold out half way through all of the bear legs and bought back in half way thought all of the bull market legs.

… which should be lot better than what most people were able to accomplish during this difficult time.

Given the circumstances above, your total ROI should have been around 425% by September of 2014 and approximately 320% by the time the bear market of 2014-2017 completes itself. Yielding a net annualized rate of return of 8.5% and 6.5% respectively. Not bad, but once again, buying and holding a 30-Year US Treasury in 1994 would have outperformed this gut wrenching speculation in Nasdaq by a fairly good margin.

Investment Strategy #3: Buy Low, Sell High, Go Short and Cover

As was suggested earlier, based on the cyclical composition within the stock market you should have been aware that the last phase of the 1982-1999/2000 bull market was about to start. In addition, you should have been aware that the upcoming cycle is likely to develop as a powerful “blow-off top” 5-Year cycle.  Leading you to initiate a long position in November of 1994.

Trade #1:  Go long in November of 1994 at 720 on Nasdaq.

As October and November of  1999 rolled around, any investor familiar with the cyclical composition of the stock market should have been aware that a bull market was ending and that a 17-18 year bear market was about to begin. As a result, such investors would have been looking for any sign of a top and an opportunity to reverse position.

The first sign of a top occurred in early January of 2000 when the Dow topped out at 11,850. Exactly 5 years and 35 trading days after the cycle began in November of 1994. Yet, despite the Dow’s sell-off between January and March of 2000, the Nasdaq kept surging higher. Setting a blow off top in the process.

Believe it or not, that was an optimal outcome and a trade setup. This divergence should have been a clear sign that a blow off top was forming and that a market crash was likely once the top on the Nasdaq was set and confirmed. In fact, investors familiar with the cyclical composition above should have been watching the market like hawks for any sign of a top and bearish reversal. Ready to liquidate their long positions and go short at a moment’s notice.

To Be Continued On Monday…….

Z31

How You Could Have Made A Fortune Shorting The Nasdaq Google