
Exact Stock Market Turning
Points Can Be Calculated

“Alex’s market analyses are some of the most accurate I have seen. He got his subscribers short for the October 2014 correction and covered almost at the nadir. His subsequent call of an early December top of 17,990 was astonishingly accurate. The actual peak was 17,991 followed by a -5% drop. I enjoy his daily updates in which he provides clear price and timing parameters. Predicting both price and time is exceptionally difficult to do and it is a very rare ability amongst technicians. Alex has made me a believer in his cycle method. Overall, an excellent service!”
Matthew Demeter
Demeter Capital Partners
Let Me Show You Just One Example
"Apple's Perfect Hits"
October 2022: AAPL should bottom around December 31st
(+/- 2 trading days) at $124 (+/- $2)
Exact Bottom Hit: January 3rd, 2023 at $124.17

October 2022: Once the bottom is in and confirmed AAPL
should run up to $200 - its next top
Apple (AAPL) reaches our $200 target by December of 2023

"In other words..... we know exactly what the overall stock market or individual stocks will do, most of the time,
in both price & time".
What About The Overall Stock Market?
Perfect Time & Price Hit On Major 2022 Bottom
Exact TIME/PRICE Hit On October 2022 Major Market Bottom & Subsequent All Time High Projection

YES, We Can Project Exact
TIME & PRICE
Turning Points In Most
Financial Instruments And
On Most Time Frames
“Alex’s market analyses are some of the most accurate I have seen. He got his subscribers short for the October 2014 correction and covered almost at the nadir. His subsequent call of an early December top of 17,990 was astonishingly accurate. The actual peak was 17,991 followed by a -5% drop. I enjoy his daily updates in which he provides clear price and timing parameters. Predicting both price and time is exceptionally difficult to do and it is a very rare ability amongst technicians. Alex has made me a believer in his cycle method. Overall, an excellent service!”
Matthew Demeter
Demeter Capital Partners
I have subscribed to many investment newsletters over the years. None of them come close to what you have done so far considering the price. I really enjoy your daily and weekly updates. While I pick my own stocks, your turning points are incredibly helpful. For the most part we are flying blind so it’s always great to know what the market will do in the future. It would be great if you can give us an annual forecast, but I understand your hesitation. Congratulations on the job well done. Keep it up…..

George Watson
Los Altos, CA
(408) 949-4997

OUR SALES PITCH
Our sales pitch is rather simple…..
We are able to predict the stock market and other financial instruments with incredible accuracy in both PRICE and, most importantly, TIME.
Our work is based on W.D. Gann and what we believe Jim Simons has been able to accomplish at Renaissance Technologies (if you are familiar with these individuals). Plus, a whole range of our own mathematical discoveries.
Consider the following “scientific” definition for our mathematical and timing work……
“The markets being, at minimum, a 3-Dimensional phenomena, exactly like a large molecule rotating in space, in and out of the Z plane, with DNA coding sequences governing the entire process. Without understanding that the market is 3-D, twisting like a plant governed by the phyllotactic laws of dual number series and harmonic composition and decomposition, all measurements taken on a 2-D chart become misleading.”
In other words, over the years we have developed a number of complex calculations that allow us to pin point not only the PRICE variable of most anticipated turns, but also its TIME counterpart.
As a matter of fact, they go hand in hand in helping us identify the exact Time/Price location of a turning point. Most importantly, these calculations can be applied to most financial instruments and to most time frames. At times allowing us to pin point important turning points within +/- 10 minute resolution.
YES, EXACT TIME & PRICE TARGETING CAN BE ACHIEVED


Let's Take a Look At Another Example
October 18th, 2022 Amazon (AMZN) Forecast…..
- The stock will bottom this December 29th, 2022 (+/- 5 trading days) at $82 (+/- $2)
- AMZN should then run up and top out at $174 (+/- $2)


That is to say, this work allows you to make an absolute killing in the market while taking on very little risk.
Please review the following page for more information. ***A quick note, this informational page may or may not contain information that has been outdated. Our own analytical work has progressed forward quite nicely since it was first published, but it will indeed give you a very good overview of our overall approach.
In summary, when all of the above mentioned points are combined in an appropriate fashion, the stock market and most other financial instruments can be predicted with ASTONISHING accuracy. In both PRICE and, most importantly, TIME. On all time frames and in all market conditions.
We can write quite a few encyclopedia size books on the subject matter, its application to the stock market or about how great our work is. And if I have learned anything, such details would be quite boring to most people. For instance, most investors would like to know exactly WHEN and WHERE the Nasdaq bottoms (or tops), not necessarily how or why.
And so, instead of boring you with the mathematical details, I invite you to join us for a 14-day FREE trial that will give you all the answers you seek…… And if you don’t like what you see or if the work is subpar, please cancel it at any time. It is as simple as that.
What Is Included In Your Offer?
We Have A Number of Products Available……
Dow Jones Weekly, Daily & Intraday Analyses
$49 - Monthly
$299 - Yearly (50% Off)
Weekly, Daily and Summary Intraday Dow Jones updates and associated calculations.
Exact Time/Price projections for the Dow published on the daily and weekly basis.
Summary pre-market Intraday overviews.
End of day updates and weekly updates.
This analysis identifying future turning points for the Dow Jones in both TIME and PRICE.
Dow Jones Intraday Updates & Trading Parameters
$29 - Monthly
$179 - Yearly (50% Off)
Mid-Term & Short-Term Cycle Clusters
Mid-Term & Short-Term Cycle Composites
Mathematical Mid-Term & Short-Term PRICE/TIME Projections
Summary of Important Upcoming Time/Price Parameters For The Day
Short-Term Analytical Conclusion
Trading Parameters - If Available
MegaCap Stocks TIME/PRICE Analysis & Projections
$49 - Monthy
$299 - Yearly (50% Off)
We analyze important financial instruments such as Gold, Oil, Interest Rates, Currencies or big cap individual stocks on a weekly basis.
One such weekly analysis and associated time/price turning points will be presented. We have about 26 major instruments we follow.
Stocks like AAPL, NVDA, Gold, Bitcoin, TSLA, Etc... (Please click Learn More below to see full list)
This analysis includes exact TIME and PRICE calculations for the underlying securities.
Packaged Deal Pricing
+Fast Movers
Our Fast Movers Supplementary Analysis Is Available With Packaged Deals Only. "Fast Movers" are stocks that are about to stage powerful directional moves of 50%+ within a compressed time window of 12 months or less. Please CLICK HERE to learn more about how our fast movers work.
Packaged Deal # 1
$75 - Monthly
$449 - Yearly (50% Off)
- Dow Jones Weekly, Daily & Intraday Analysis
- MegaCap Stocks TIME/PRICE Analysis & Projections
***New Addition: Individual "Fast Movers"
Names & General Guidance
Packaged Deal #2
$99 - Monthly
$599 - Yearly (50% Off)
-Dow Jones Weekly, Daily & Intraday Analysis
-MegaCap Stocks TIME/PRICE Analysis & Projections
-Dow Jones Intraday Updates & Trading Parameters
***New Addition: Individual "Mast Movers"
Names & General Guidance
Plus, A FREE Bonus
(Sign Up Now and Receive Access To My Books)
Not Available From Any Other source


Thank you for getting back to me and explaining your forecast in a more detailed fashion. It makes a lot more sense now. I have been using technical analysis and elliot wave over the last few years while trying to short the market. Unsuccessfully, I might add. After your explanation I am reconsidering my entire approach. Now that I think about it, it makes perfect sense. I will be implementing your turning points into my system to see if that makes a difference.
 MARK OSSOLA
LOS ANGELES, CA
(818) 880-8464
For the first time in my life I am starting to understand what the market is doing and why it is doing it. Thank you Alex. Great daily updates and trading advice. I haven’t yet taken any of the positions you describe, but I am getting ready. It gives me a lot of comfort knowing that I will be taking the same positions as you will. Plus, I like your approach to risk management. I think waiting for a confirmation and having exact points of entry and exit are good ideas.

Chris Burke
Greenwich, CT
(203) 913-6367
I am still scratching my head. Not sure how you are able to do it, but your forecasts have been spot on thus far.

Joseph Sweeney
Boston, MA
(617) 267-5410
I was very skeptical at first. I mean, come on. Timing the market? Even Warren Buffett tells people that timing the market is impossible. My point of view changed when the market ran right into your turning point on February 19th, 2014 at the exact price and time you have described a week earlier. I have never seen anything like that before. How is that possible? I told myself there is no way it’s going to happen and then boom, the market runs right into your target and that’s the exact spot where a multi week massive stock market rally stops. How do you do it? I can’t tell you how incredibly excited I am about this. If your future turning points are as accurate as this one I will be making a bank. It’s nice to know exactly where we are and how to approach the market. Cheers Mate!!!

Briana Kelly
Melbourne, Australia
I Am Sorry, BUT…
This Subscription Is Now Highly Restricted
Due to high demand for this service and due to my contractual obligations to a large hedge fund, this service is now limited to 20 new monthly subscribers.
Further Explanation: My largest client, a multi-billion dollar hedge fund has asked me to limit the number of new subscribers to 20 individual investors per month in order to limit the number of people who have access to this information.
This is an unfortunate development, but there is very little I can do. Please follow the steps below to gain access to this service – it takes less than a minute. Please note, you will still have a 14-day money back guarantee and a complimentary book if an invitation to join is e-mailed to you over the next 24-48 hours.
Step #1: Please fill out “Reserve Your Spot” form below and click SEND.
Step #2: You will receive an email from us within 24-48 hours. If we have availability you will be granted access right away. And if not, you will be put on a waiting list. That depends on a number of subscriptions we have left for the month (if any). That is why it is critical that you request access as soon as possible.
Again, you will still get a 14-day money back guarantee and a complimentary book. I do apologize for this somewhat confusing process, but it is the best solution that we could come up with. It is the only way my work can remain available while I satisfy my contractual obligations. Thank you for your understanding.
*** Please input your full name, your email and click SEND. We will e-mail you back with your reservation details within 24-48 hours. Thank You!!!


OUR TEAM
My name is Alex Dvorkin and I am a hedge fund manager at 4D Capital, L.P., mostly managing my own money, as well as the person behind the body of work presented on this site.
This work is my blood, sweat and tears over the past 15-20 years. I have spent an incredibly amount of time on the study of financial markets and how they truly work. After learning everything I could about fundamental and technical analysis I found them to be lacking in one important area. TIMING. That is why I have spent the last 10 years of my life doing an in-depth scientific and mathematical research into the area. During that time I have made a number of significant breakthroughs that allow me to predict the market with precision of a surgeon. I do my best to make all of this information available to you here.
You get all of my knowledge compressed and presented to you in an easy to understand format and trading advice. Daily. Thereafter, you are free to either follow my trading/portfolio strategy or to build your own.Following my work gives you the ability to know what the stock market or other financial instruments will do in both price and time. On multiple time frames. Giving you the ability to make a lot of money, outperform the market and minimize risk.
Feel free to contact me at any time. Thank you……Alex Dvorkin
"Mr. X” – Brilliant Ph.D. Mathematician (full name known to investment partners only due to the secret nature of this underlying work) – currently completing the sequencing and coding of this work in order to get us to that 90-95% constant accuracy target. Young, aggressive, one of the most brilliant minds in the mathematical world of today. Very well published.
Our Personal Guarantee
Once you sign up, you will have a 14-day free trial period. If you don’t believe we deliver as per our outline above or if you don’t like the service for any other reason, simply let us know before your 14-day trial is over and your credit card will be refunded in full – no questions asked.

Otherwise, cancel at any time. It is as simple as that. Our only other guarantee is as follows. We will work our behinds off to provide you with the best analytical work available on the face of this earth. If you find something better or if you don’t like it, please cancel your subscription.
Questions & Answers...
Is Your Work Similar To Elliot Wave?
Elliot Wave is too simplistic as the stock market structure is a lot more complicated. Elliot Wave picked out a repeating pattern out of the stock market structure and then applied it to everything. It is a good pattern and I know exactly why that pattern occurs. Yet, EW work represents about 5% of my work. Same thing with the Dow Theory. And I am being generous. Both systems look at pattern recognition. That is not enough. Again, the stock market is a much more complex entity. It moves in multi-dimensional space, tracing out points of force. When we apply mathematics, we begin to see its exact structure, giving us the ability to make exact forecasts into the future. Elliot Wave doesn’t do that. Not even close.
Is Your System Fool Proof?
Yes and No. It’s hard to explain, but the stock market is a dynamic “Life” entity. Through the use of mathematics we can predict it with great accuracy. However, at this stage it is only 85-90% correct as I am not 100% done putting all of the pieces together. Yes, we can get incredibly accurate results, but we (as investors and traders) must always be ready to adjust our position in 10-15% of the cases where our work is incorrect. That is why market confirmations become incredibly important. By implementing proper positioning and trading technique we can bring our level of accuracy to about 95%. Plus, I am working hard on the remaining 5%.
Who can benefit from either learning this system or following you?
Everyone! Let me explain – whether a you are a beginner, a passive 401K investor, a market enthusiast, a sophisticated investor or a professional trader/investor… you can benefit greatly from using Timed Profits. Simply put, you will know, well into the future, exactly what the stock market is going to do. And that will allow you to minimize risk while increasing returns.
The best part is, ANYONE can do this. If you are beginner you can simply follow my lead, trades and portfolio allocation. If you are an experienced market practitioner, you can build or implement your own investment strategy around my forecasts.
Where Can I Learn More?
Please CLICK HERE to learn more.
How is Timed Profits better than any other newsletter, subscription or advisory service?
As of right now I am aware of only one other person on the face of this Earth who processes this same knowledge. And he is not talking.
Please understand, this is not a simple approach where I use technical, fundamental, trend, etc…. analysis that everyone else uses to predict the markets. My work is incredibly unique, highly structured and precise. I use mathematical analysis that goes well beyond typical stock market analysis. As a matter of fact, it is in a league of its own. I approach the stock market from a completely different vantage point and as such provide incredibly accurate forecasts. In short, I am different because I can predict the markets with precision of a surgeon. I am not aware of anyone else who can do the same.
I suggest that you try the service first. If you disagree with any of the above after the fact, please cancel before your trial period is over.
I have tried other similar offers with similar promises, but I have not experienced the results I expected. Why would your system be any different?
Few programs have the scientific and mathematical backing that I offer. Plus, there is no way I would risk my personal credibility and my multi-million dollar hedge fund business by offering you something that doesn’t work as I say it does.
Here is what I suggest. Please get and read my book to fully understand what it is that I do when it comes to the stock market analysis and timing. If you have any interest thereafter, I suggest that you register for our premium service free trial and see for yourself. If you don’t believe it’s for you or if you don’t believe I deliver, simply cancel before your trial period is up and you will never be charged. My work speaks for itself. It is as simple as that.
Let's Talk About Our Fast Movers
Fast movers are stock that are about to stage powerful directional moves of 50%+ within a compressed time window of 12 months or less.
Over the years, as our work progressed, we have noticed something of significant importance. We have noticed that large directional moves in underlying equities or markets typically happen when there is a short period of TIME between a major cycle top or bottom and its subsequent upcoming bottom or top.
In other words, powerful directional moves typically happen between these two important points of force. Our work is able to identify these points and then project when any underlying security will make a powerful move up or down. Typically within a compressed period of time of 12 months or less.
Crude Light (CL) chart below is a perfect illustration of that in 2008, recent March of 2020 low and to a lesser extend in 2016. For instance, there was a major cyclical top in CL in July of 2008 and a major bottom arriving in March of 2009. It would have been reasonable to assume that a major move down would take place during this period of time. And it did.
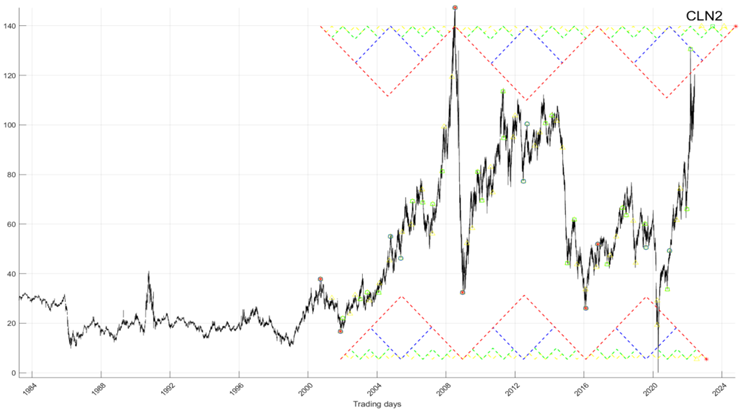
Our software is able to scan all financial instruments and identify stocks or markets where such periods of volatility are coming up in the near future. We can then use the rest of our mathematical and timing calculations to confirm the move and its directional extent.
Please CLICK HERE To Learn More