
It can be argued that, Tulip or Bitcoin manias aside, the overall stock market and the US Economy are so out of sync with reality that upcoming crash will make 2007-2009 look pale in comparison.
What is happening here?
Let’s start with the following chart. 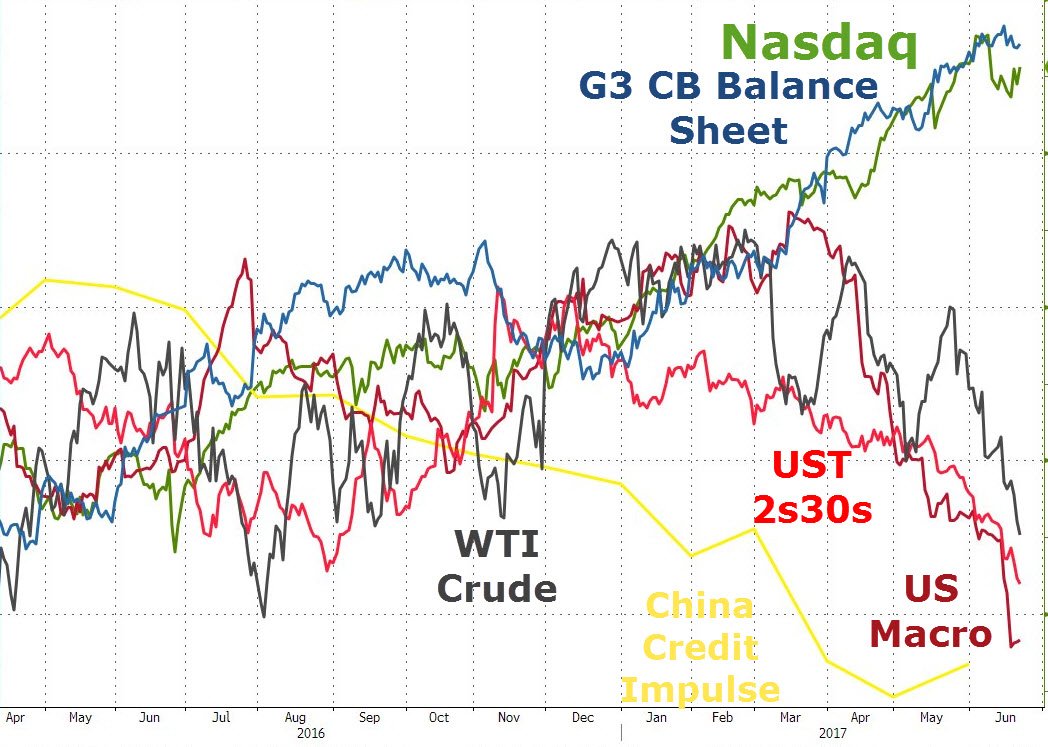 The chart is rather self explanatory and it doesn’t take long to figure out what or who is behind today’s stock market bubble. While everything is crashing, due to Ponzi Finance of QE expansion losing velocity, central bankers around the world are keeping the party going, at least for the time being, by buying everything hand over fist.
Downright Crazy Valuations:
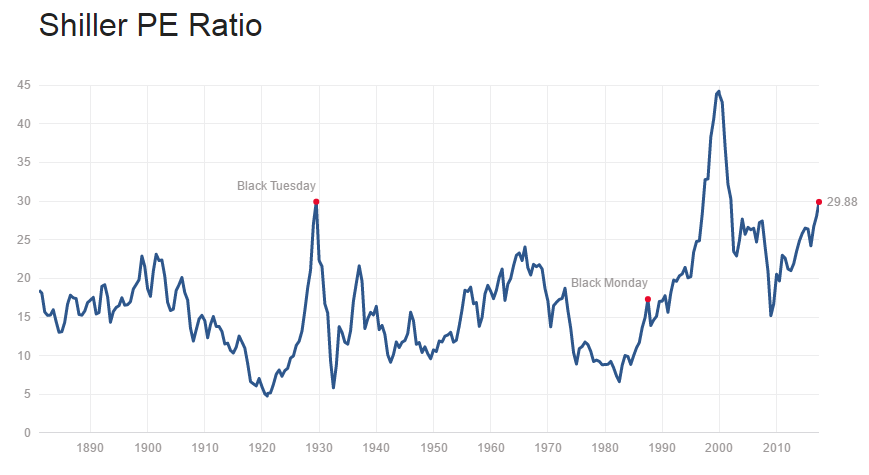
When we look at today’s valuations the picture is even scarier. Earlier in the week Shiller’s P/E Ratio on the S&P has pushed above 30 (median 15-16) for the first time ever. Especially if we adjust for the lack of earnings in the index during the tech bubble.
Allow me to rephrase that. The stock market today is selling at the highest valuation level in human history. Higher than 1929, 1937, 1966, 1972, 1987, 2000 and 2007.
Now, most bulls would argue that today’s valuation are justified by low interest rates. Not so fast there…….
While there is much to debate about the current level of interest rates and future stock market returns, it is clear is the 30-year decline in rates did not mitigate two extremely nasty bear markets since 1998, just as falling rates did not mitigate the crash in 1929 and the subsequent depression.
Do low-interest rates justify high valuations?
History suggests not. It is likely a trap which will once again leave investors with the four “B’s” following the next recession – Beaten, Battered, Bruised and Broke.
Take that Warren Buffett
Incredibly Bullish Sentiment
Open any financial media outlet today and you will be greeted with the following nonsense.
Please note something of significant importance here. People are now making “sure bet” prediction about highly speculative bets. In other words, shoe shine boys are now sure “this thing” is going higher.
Scary similarities between President Hoover 1928 election/market and Mr. Trump. 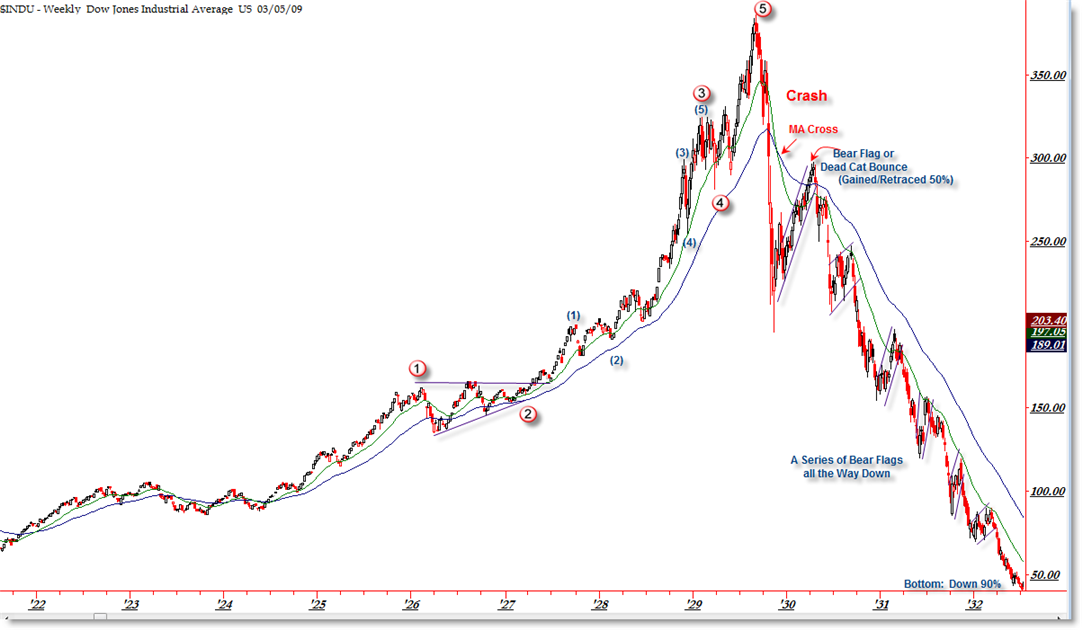
On November 6th, 1928 Republican Herbert Hoover won the US Presidency. The stock market took off like crazy after Mr. President has offered the moon. Instead, what he delievered was a trade war that deepened the great depression. Trump, Trade Wars, And The Traumatic Example Of The 1930s. Sounds familiar?
Who said history doesn’t repeat itself. That is to say, replace Hoover with Trump and we have ourselves a perfect match.
Growth – What Growth?
Now, I would be the first one to admit that today’s valuation levels can be justified if the US went on some sort of an economic or earnings growth spurt. Yet, as I have argued here On Friday The S&P Hit Its Highest Valuation Level In HISTORY – Find Out What Happens Next, that is nearly impossible. And I am not the only one who thinks that way. Consider this……
Don’t fight the FED.
Finally, most bullish investors today will dismiss all of the above based on a simple premise. The FED will backstop any correction and/or flood the system with money in case of an emergency.
Perhaps they will and that might even work. At the same time, consider the following data point
But I think that if your investment mantra is “don’t fight the Fed”, you now must have a short bias to both the U.S. equity and bond markets, not the long bias that you’ve been so well trained and so well rewarded to maintain over the past eight years. This is a sea change in how to navigate a policy-driven market, and it’s a sea change I expect to last for years.
Make no mistake, an absolute bloodbath in equity markets is steaming our way. The only remaining question is…… when? If you would like to find out exactly when this sell-off will start, based on our mathematical and timing work, please Click Here.