
My $100,000 Guarantee!!!
As you very well know, this industry is full of BS. From traders who never have a losing trade to secret formulas that lead to untold riches. You will not find any of that here and I am willing to put my money where my mouth is. To some, the calls below might appear incredible. And they are. They are based on close to 10+ years of full time research into highly advanced mathematical/timing work and its application to the stock market (to learn more click here). This is where my guarantee comes in. I welcome you to check our 14-day free trial where you will have access to ALL of my current and previous forecasts. 
Warning: Do not use the charts and forecasts below as an investment advice. By the time they are posted here, they are old news. That is to say, they are designed to showcase past work, not to project future moves. To see what the market will do next, please request your free 14 day trial.
Recent Market Calls & Direct Hits
October 1st, 2022- December 31st, 2023
-
-
- Total Number Of Calls: 44
- Direct Hits & Successful Trades: 17
- In Progress -Or- Stocks Moving Towards Their Respective TIME/PRICE Targets: 21
- Failed Forecasts (stocks did not move towards their time/price targets): 4
- Failed Trades (2-3% loss): 2
-
Average “Fast Movers” ROI – 10% in 60 Days (*New)
Average MegaCap Direct Hit Monthly Return – 6%
PERCENTAGE ACCURACY: 88%
AVERAGE POSITION PERFORMANCE SINCE OCTOBER of 2022: +65.89%
| Stock Symbol | Projection Summary | Actual Top/Bottom | Margin Of Error | Time/Price Projection | Open Closed | 12/31/23 Price | 12/31/2023 Gain |
| IAT | A slightly lower secondary bottom is possible on May 2nd (+/- 2 trading weeks) at $30 (+/- 1). | May 4th at $28.80 | Direct Hit | Ask Us | Open | 41.83 | +39.43% |
| HG | November 29th,2022. We did see an important cyclical top in March of 2022 at $4.99. It appears Copper’s 14 year up cycle topped out at that juncture. | $4.99 top March 2022. | March top confirmed | Ask Us | Open as bottom price projection has not yet been met | 4.01 | N/A |
| Crude Light (CL) | Our calculations suggest the bottom will arrive at around $72 (+/- $3). If the CL breaks below $69, which is possible, it would shift to a lower set of targets located at around $64. | 5/3/2023 bottom at $63.64 | Bottom not yet confirmed | Ask Us | Open | 71.30 | +11.40% |
| TSLA | January 18th, 2023 Telsa has likely achieved an important bottom on January 6th, 2023 at $101.81. | $101.81 on January 6th, 2023 | January bottom confirmed | Ask Us | Exit7/10/2023 | 275.43 | +129.73% |
| Bitcoin (BTC) | November bottom projected and confirmed first in November and then of February 2023. | $21,900 on Feb 13th | November bottom confirmed. | Ask Us | Open | 44,500 | +103.19% |
| AMZN | Bottom to arrive December 29th (+/- 5 trading days) at $82 (+/- $2) | $81.43 on January 6th, 2023 | 0%Direct Hit In Both Price & Time | Ask Us | Open | 152.20 | +85.69% |
| AAPL | Bottom at $124 (+/- $2). First TIME Turning Point on October 31st, 2022 not reached, secondary TTP on December 31st (+/- 1 trading day). | $124.17 on January 3rd, 2023 | 0%*Direct Hit on Price*Slight Time Change. Secondary TIME hit dead on. | Ask Us | ClosedDec14, 2023Target Reached | $199.00 | +60.48% |
| DJIclick link | Bottom on 10/10/2022 (+/- 2 trading days) at 28500 (+/- 100 points) | 28,661 on October 13th @ opening | 0% | Ask Us | Open | 37,697 | +31.34% |
Some Of Our Prior Market Calls
***May 2020 – December 2023:
We were under a contractual obligation not to post anything during this time. We should start posting recent calls in January of 2024.
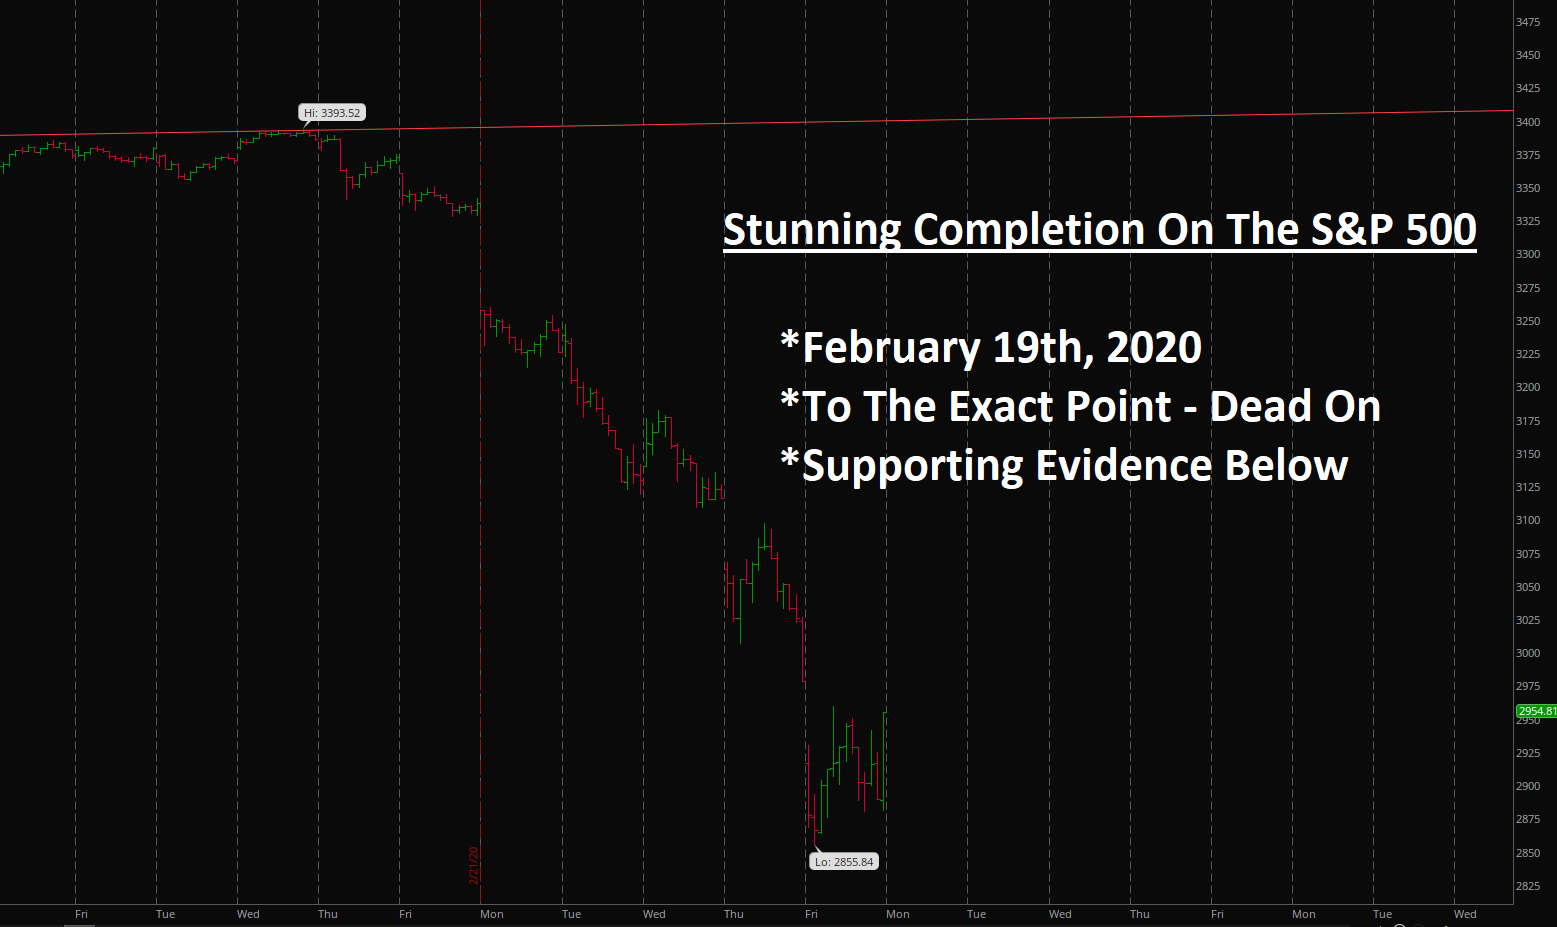
Latest Update: February 2020
While everyone was “Long & Strong” we were preparing for a major top.
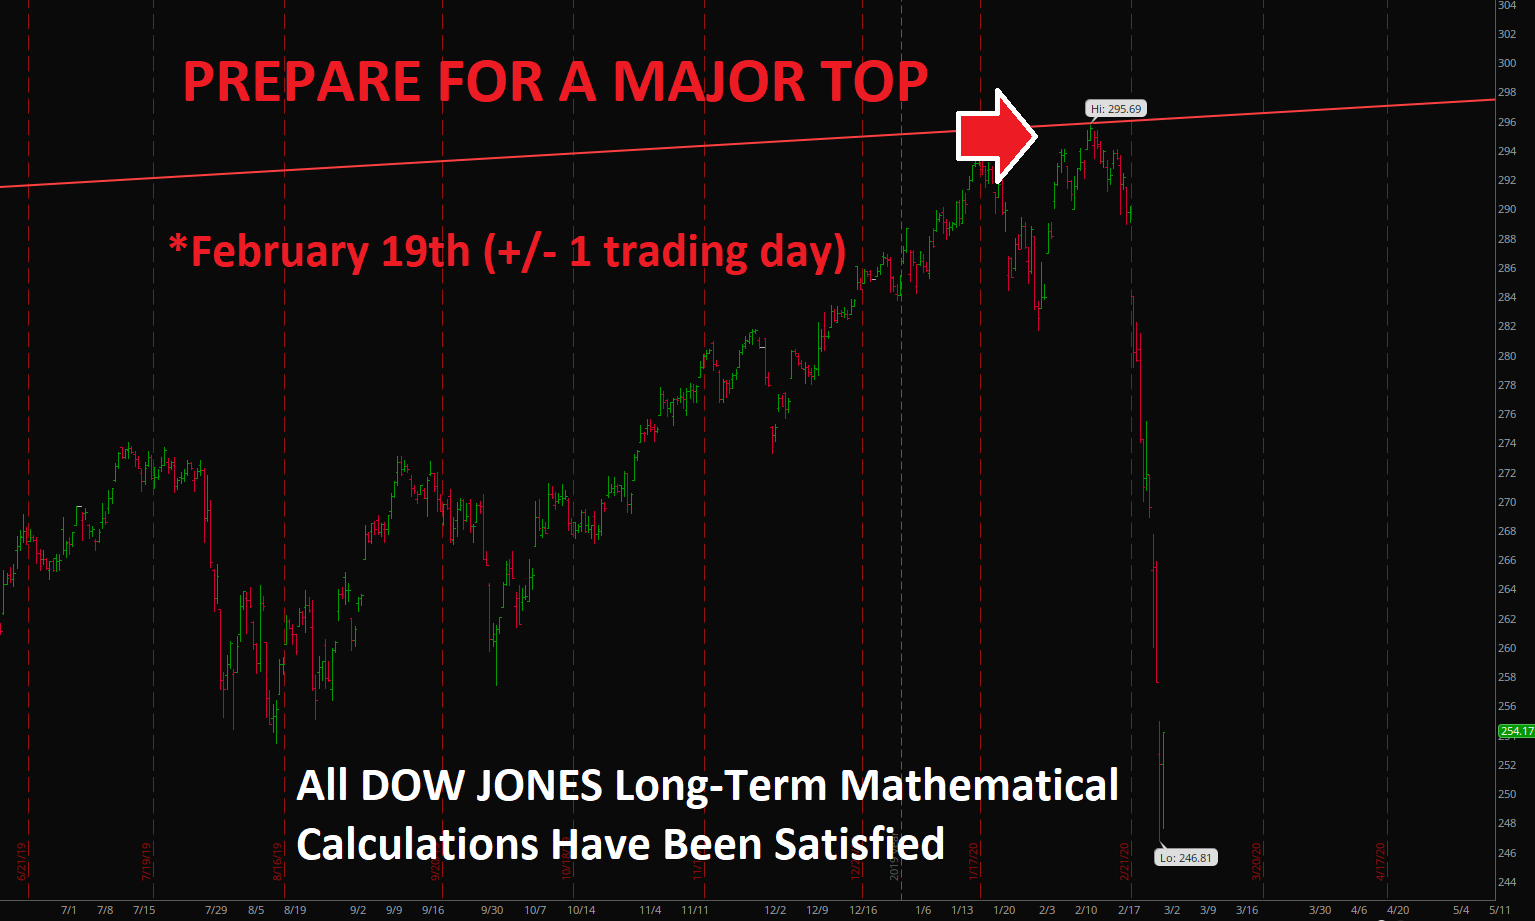
Click Here to learn more about this call
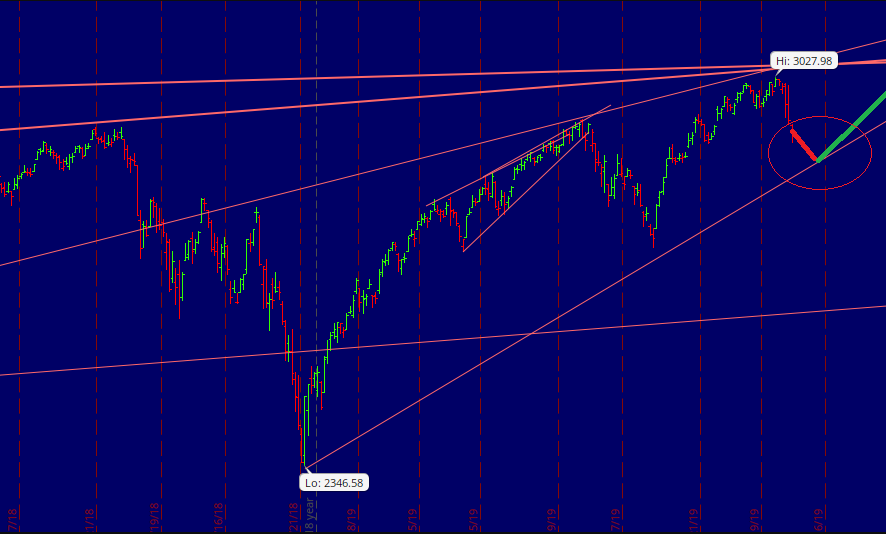
October 2019
Our subscribers have been following the chart below for quite some time. Our August 16th (+/- 1 trading day) bottom call and subsequent bounce were a direct hit.
How We Predicted April’s High & June 3rd, 2019 Bottom
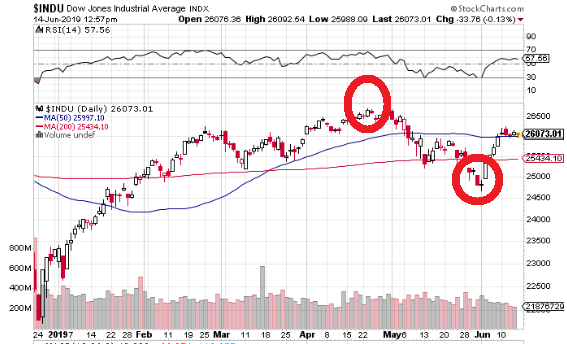
If you recall, we delivered an exact hit on December 26th, 2018 bottom. While everyone was panicking our work projected an important bottom on December 27th (+/- 1 trading day) on the Dow at 21,725 (+/- 50 points). An actual bottom was put in place on December 26th at 21,713.
The stage was set for a rally/bounce and boy did the market do just that. Having said that, subsequent market action has proven to be much more difficult than originally anticipated. You see, our work was projecting an important TIME turning point in the beginning of February. The Dow did top out on February 6th, but that top was short lived.
It soon became apparent what was happening and we talked about it in our Premium Section for nearly two months. Most indices were compressing into their respective rising wedges – signaling an eventual demise of the rally. At the time we were looking at various charts, including these……
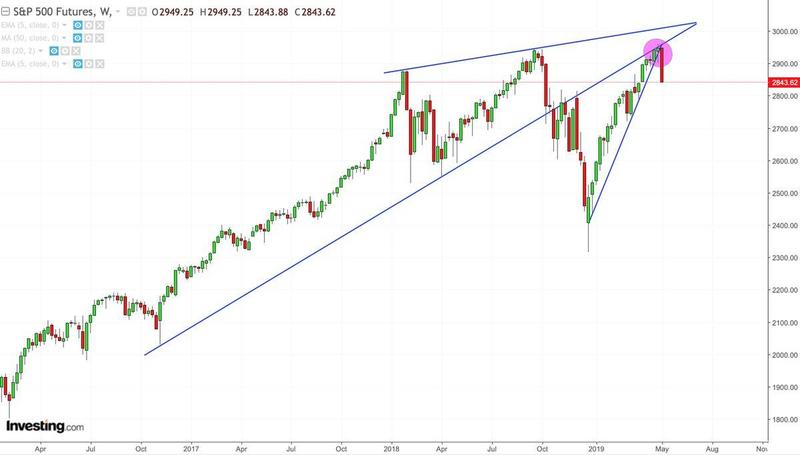
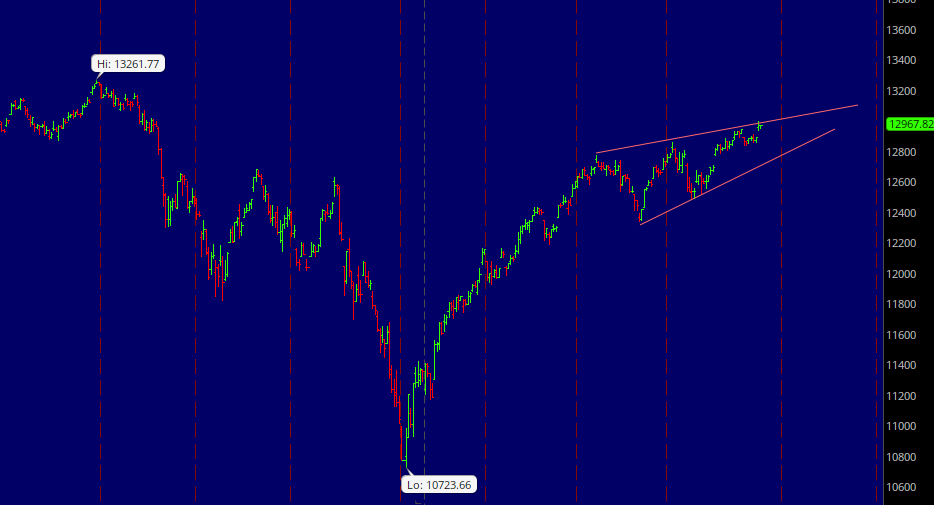
As we approached the termination phase of these wedges an important Time/Price point of force was coming on the Dow on April 21st (+/- 2 trading days). We theorized, at the time, that this would be the point that would end the rally/bounce. Sure enough, the Dow topped out on April 23rd and a fairly large scale sell-off followed.
During this sell-off the Dow put in an impressive bottom on May 13th. However, we were quick to dismiss this bottom because the Dow did not hit any time or price points of force. The next significant TIME turning point of interest was arriving on May 31st – Friday (+/- 2 trading days).
As we got closer two potential PRICE turning points were identified on the Dow. One at 24,870 and the other at 24,610 (+/- 50 points each). On Friday, May 31st the Dow sliced though the first point. That forced us to concentrate on the second point on Monday. The bottom was achieved on 24,681 or just 21 points outside of our window.
December 2018 Bottom Analysis 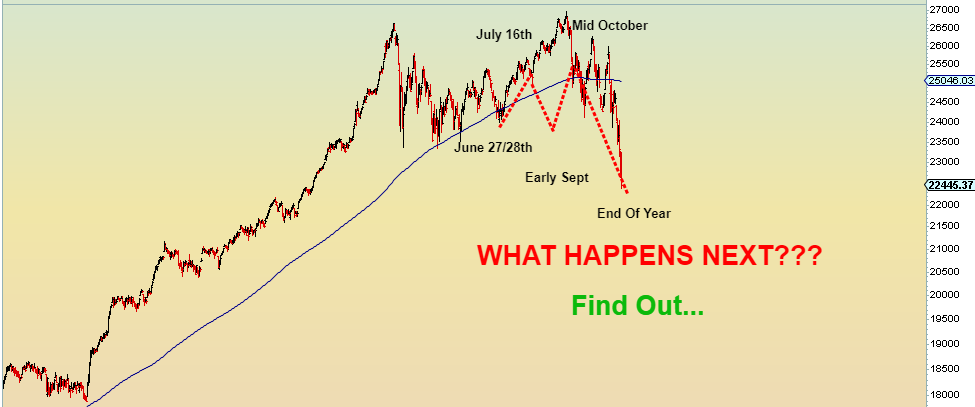 In early June of 2018 we presented our subscribers with the following chart. At that time it was just a red dotted line you see above projecting upcoming stock market moves. June 27/28th bottom was a direct hit. The biggest discrepancy for the forecast above was our anticipated early September bottom. September 11th bottom ended up being much shallower than we originally anticipated. The forecast was slightly adjusted in our weekly/daily updates with price/time calculations as we went along and an important top arrived on early October. The sell-off thus far has been fairly straight forward. Not too bad for a forecast issued 6 months ago. Over the last two weeks I issued the following warnings to our premium members.
December 8th Update: Market’s structural composition suggests the market will very quickly slice though both 24K and 23K on the Dow over the next 10 trading days. Once those major support levels are taken out, the Dow might very quickly collapse to XXX by the time our XXX TIME turning point arrives. December 15th Update: The Dow did briefly break below 23K on Monday, followed by an ideal structural bounce discussed in our daily updates. It appears the bounce did conclude on Wednesday and that we are now in very early stages of XXX down. A word of caution. These structural locations in the stock market are incredibly dangerous and/or violent.
As we came into December most traders/investors were anticipating a massive “Santa Rally”. Our work was projecting the exact opposite months ago and we made sure our subscribers knew. Subsequently, as the market approached our December 27th (+/- 1 trading day) important TIME turning point, two mathematical points of force were identified on the Dow in our daily updates. One was located at about 20,750 and the other at 21,725 (+/- 50 points). A trade entry point and a plan of action were offered at the time for our 21,725 PRICE turning point. Like clockwork, the Dow proceeded to bottom on December 26th at 21,713 and the rest, as they say, is history. Not all of our market calls are as accurate as the one above has been. Yet, we do our best in an attempt to nail them all…..tops and bottoms. If you would like to find out exactly what the stock market will do next, in both price and time, based on our timing and mathematical work, please Click Here. June 2018 This week’s market action was entirely predictable. In fact, the stock market continues to follow our exact forecast. This is one of the charts our subscribers have been following for quite a few weeks now. 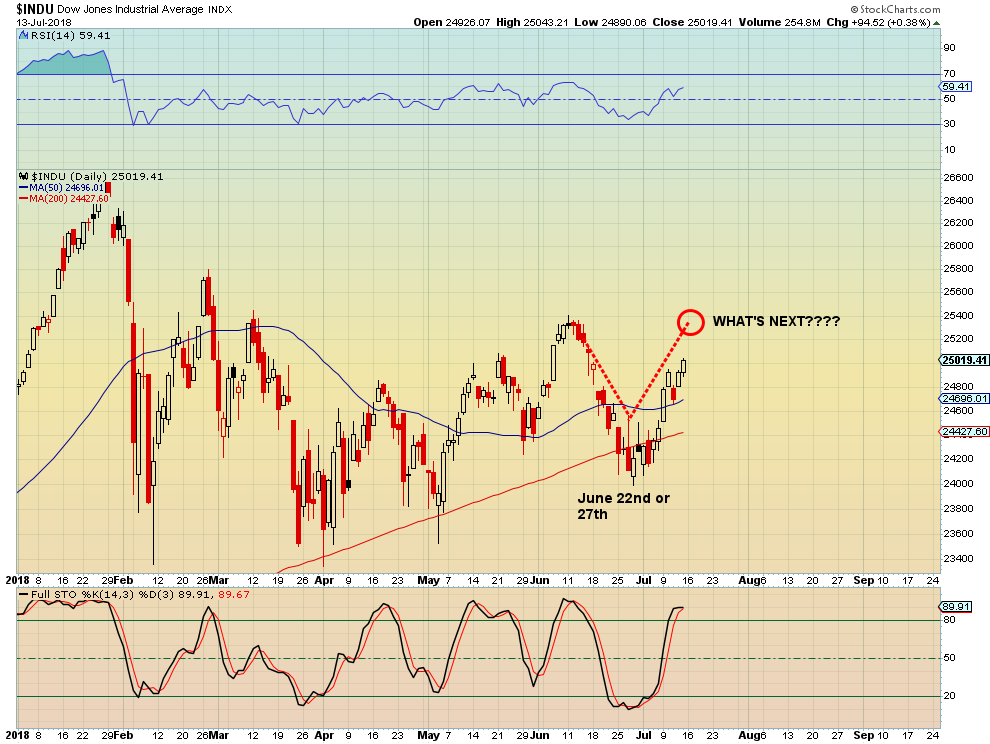 *** Please Note: Red dotted line represents TIME only, not price. Our mathematical and timing work indicated the stock market would decline from June 11th top to either June 22nd or June 27th (+/- 1 trading day). We did see a smaller bottom on June 22nd, but as I have told my subscribers at that time short-term and long-term calculations did not line up for a bottom to occur at that juncture. Once the market began to collapse into June 27th we were able to identify the exact point of force. At that time I projected a bottom on June 28th, within the first 60 minutes of trading with the Dow at 24,050 +/- a few points. The exact bottom occurred 15 minutes into trading at 9:45 AM EST at 23,997. That is why while everyone was turning super bearish I was telling you here how oversold the market was at that juncture. Just take a look at stochastics on the chart above at the end of June (a condition that no longer exists). Our internal work was calling for a powerful bounce to then occur off of June 28th into XXX TIME turning point. March 2018
 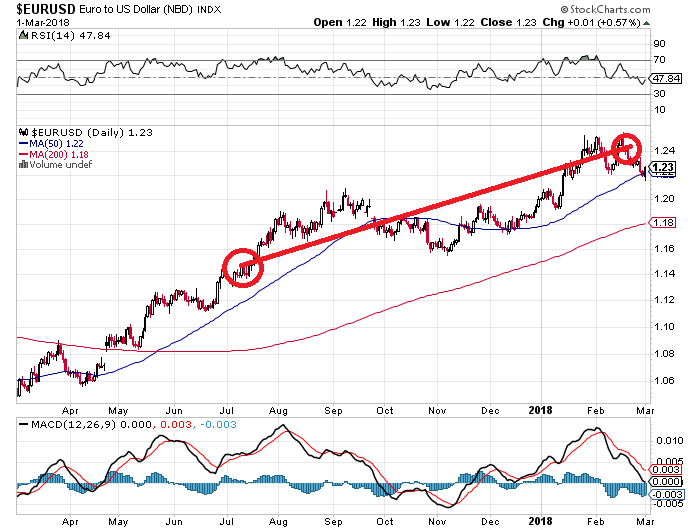 In July of 2017 we entered into a long position on the Euro at $1.1502. Why? Well, at that juncture the Euro broke above major resistance line, suggesting much further upside to come. This entry point was also confirmed by a TIME turning point. Just recently we liquidated this position at $1.2459. Why? The Euro run into a major Time/Price resistance line. Plus, our other work suggests a major move in the currencies market that has something to do with the USD.
November 2015 Top Explanation and subsequent market action.
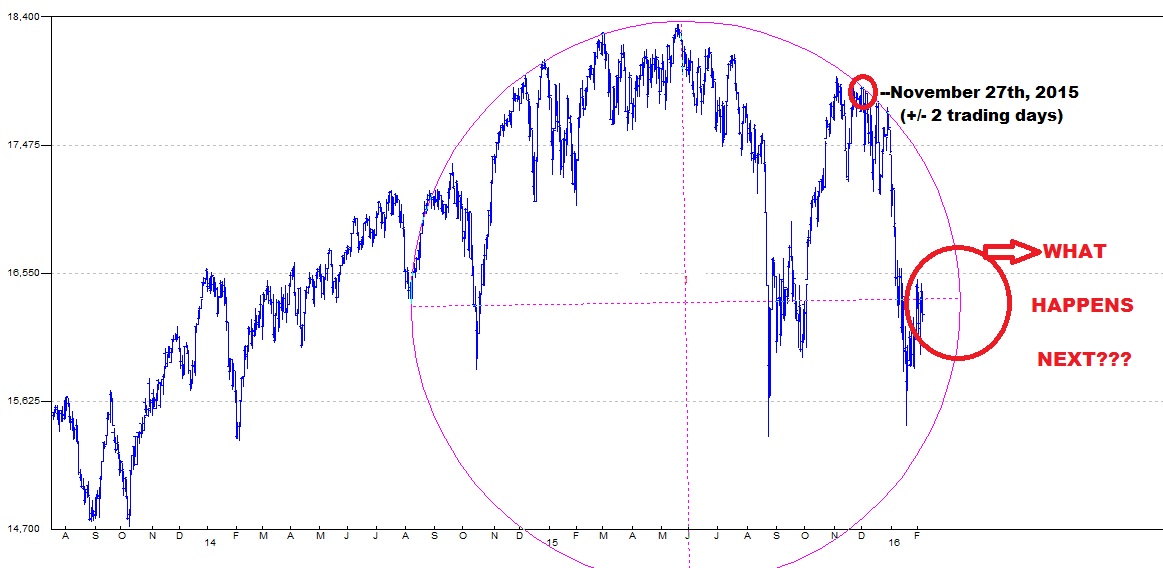 I first introduced my TIME turning point of November 27th (+/- 2 trading days) to my subscribers in early September of 2015. At that point I have suggested that this TIME turning point is one of the most powerful TIME turning points of the year. Just as strong as May 19th TIME turning point was. As the market bottomed (higher low) on September 29th and then surged higher it became evident that Nombember 27th would be a top and not a bottom. As a result, I then introduced the elliptical structure above. Displaying clear resistance levels. To summarize, as we pushed into this top we knew two things.
- The exact TIMING – Nobember 27th and…
- The price level where the market is likely to top out (at resistance).
In fact, this is the chart to my subscribers, first posted in our subscriber section on October 31st, 2015. Before the projected top was put in and subsequent decline. 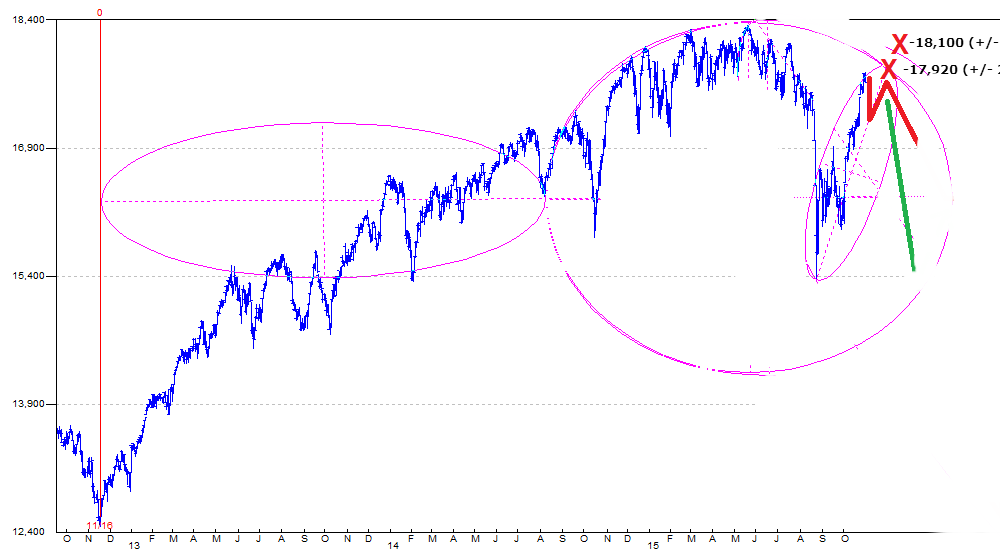 Actually, this top was quite a bit uglier than the work above indicates. The actual PRICE top on the Dow arrived on November 3rd. The top on our TIME turning point of November 27th was slightly lower (secondary top). Then, the market proceeded to run into our elliptical resistance at lower levels twice more. Once on December 17th and once on December 29th, before the massive sell-off in early January. I discuss why we had those attempts at resistance in our subscriber section in greater detail. The chart above also helps explain the market action thus far and most importantly, what happens next. There are two things to consider at this time……
- The market will remain within a tight trading range until the elliptical structure above terminates. My subscribers know the exact date and price of such termination.
- Something incredibly important will happen as soon as this structure terminates. Unfortunately, what that is, is only available to my subscriber.
If this type of Price/Time analysis is of interest to you, please Click Here
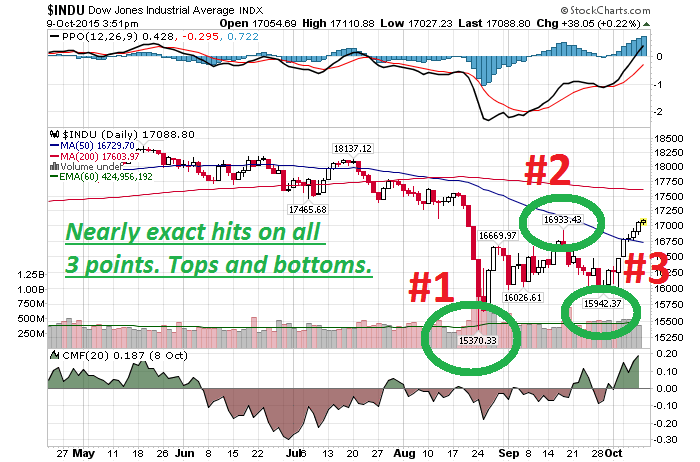
August 24th, 2015 Bottom, September 17th, 2015 Top and September 29th, 2015 Bottom Please click on the links below to see an in depth explanation of how we were able to pick out these tops/bottoms and our associated margin of error.
- Exact hit on August 24th, 2015 Dow 15,370 bottom.
- Nearly exact hits on September 17th top and September 29th bottom.
How We Nailed May 19th, 2015 Top
As the Dow pushed higher in mid May, 95% of market pundits, money managers and economists were predicting the Dow 20,000 by the end of the year. I was NOT in that camp. Not by a long shot. On the contrary, I was building into 100% short position at the time and so were my subscribers. Here is why…..take a look at the chart below. My subscribers first saw this chart in early April of 2015. 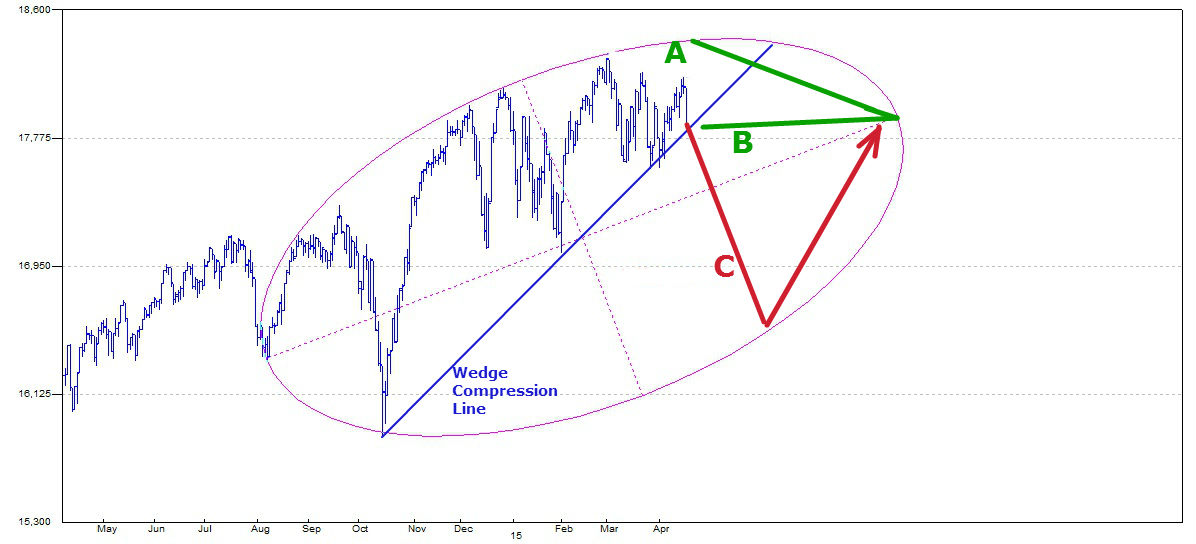 At that time, April of 2015, my basic forecast was as follows (without getting into intricacies of it).
- The Dow will remain within the confines of the elliptical structure above until the ellipse terminates at the right hand side mid-point in late July of 2015.
- The market will not move fast or we will remains within the confines of a low energy market until we terminate the ellipse in late July. But as soon as we do, energy levels and volatility should spike higher. In other words, we will move fast.
Here is the actual outcome: 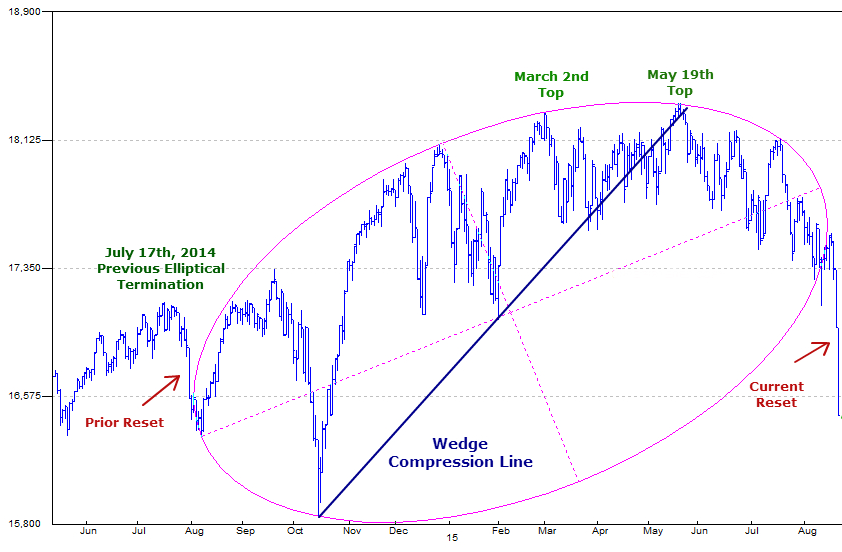 Pay particularly close attention to the following.
- We had a very powerful TIME turning point arriving on May 19th (+/- 1 trading day)
- The market ran right into elliptical resistance at the same time.
- Plus, wedge compression line terminated at the same time.
All of that was indicative of a major top being put in place. So, while everyone was extremely bullish, I was telling my subscribers….
“Do not wait for elliptical termination point, go short NOW. We are unlikely to see these top levels again anytime soon.”
Finally, notice what has happened right after the market fell out of the ellipse. Just as suggested above, we have had a major spike in volatility and the market covered more ground to the downside in 7 trading hours, than it did in the 3 months prior. I have had quite a few blog posts prior to that, warning people of the same. For instance, Is Our Historically Boring Market About To Get Exciting? You Bet – Published on July 31st, 2015 If you would be interested in this type of an analysis and/or if you would like to find out what happens next, please Click Here August 1st, 2015: Still NOT updating (see below), but to see how amazingly accurate our Intraday forecasts can be, please click on the following link. How We Missed Monday’s Bottom By 1 Point On The Dow July 1st Update: Please Note: I am currently NOT updating this section due to a certain structure developing within the stock market. A structure that will lead to a violent move ahead…up or down. A structure that my subscribers are very well aware of and its exact completion date. I will update this section once the resulting move completes itself. In the meantime, I continue to call short-term tops and bottoms in our subscribers section. For instance, May 19th and 28th tops, etc… Maybe it’s time to Subscribe. March 2nd, 2015 Top Call: Going into the end of February my subscribers knew that we were facing a major turning point at the Dow 18,320 (+/- 50 points) and that it would occur on February 27th (+/- 1 trading day). If you are wondering, yes, +/- 1 trading day included March 2nd. My advice was also rather simple, to go short right at the top. The actual top arrived on March 2nd at the Dow 18,288. Not bad. 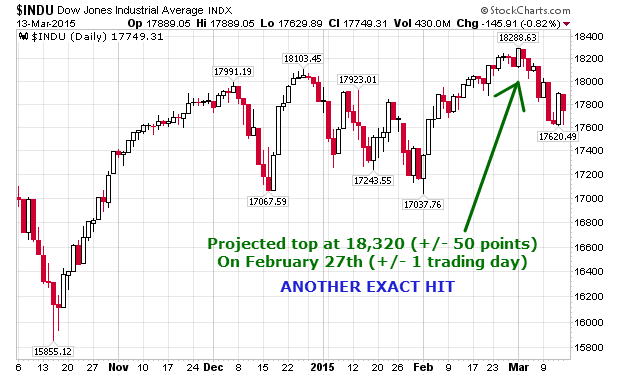 February 2nd, 2015 bottom call: In my weekly update to my premium subscribers on January 31st, 2015 I have identified February 3rd, 2015 (+/- 1 trading day) at the Dow 17,050 (+/- 50 points) as a possible turning point. Further, I suggested that if the Dow is to stop there and reverse, it would be highly likely we experience a substantial bounce. Just as we did.
 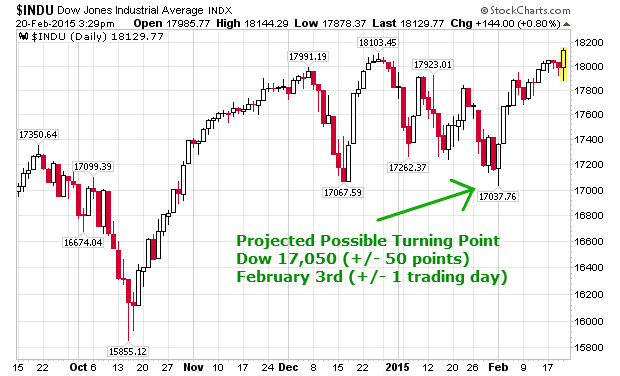 December 26th, 2014 top call: My subscribers knew as early as mid December that the Dow is likely to top out on December 27th at 18,100 (+/- 50 points). The Dow topped out on December 26th at 18,103. I started to build into my short positions as soon as various technical confirmations arrived. By January 31st, 2015 the Dow was down 5.2%.
 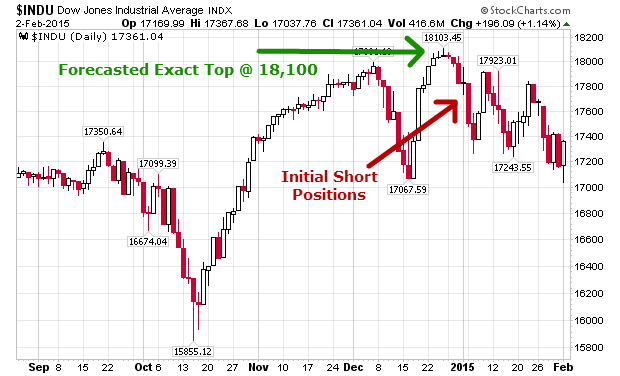 December 5th, 2014 top and December 16th, 2014 bottom calls: A forecast was provided in November that the Dow is likely to top out in early December at 17,990 (+/- 50 points). The actual top was hit on December 5th at 17,991. Once a technical confirmation was received, I started to initiate a short position. December 16th was then identified as a potential bottom in both price and time. As soon as a confirmation was received, all short positions were covered. No long positions were established at the time due to a large upside gap and the forecast above (upcoming top).
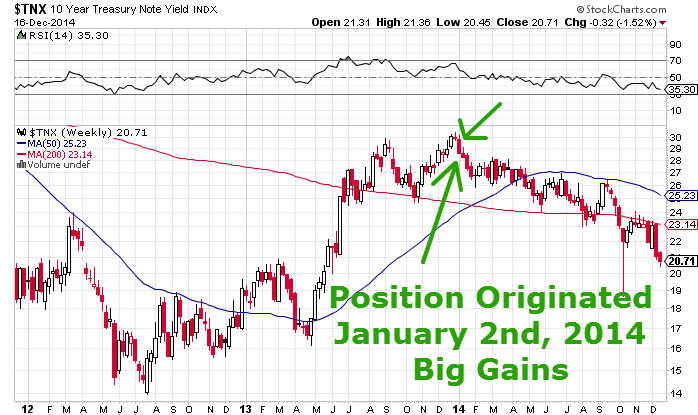
  January 2014: 10-Year Note: Position originated on January 2,2014. Still holding (Dec. 2014) as per our long-term forecast.
2014 FORECAST SUMMARY: Please see explanation below.
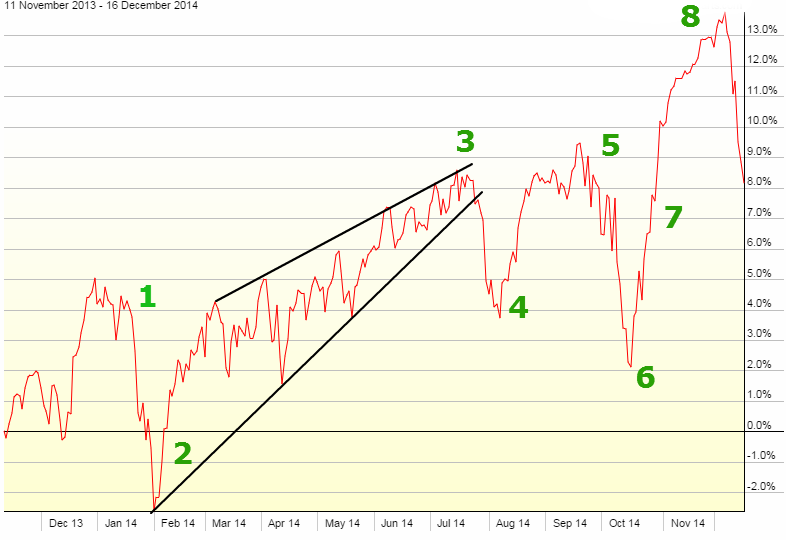
- Top identified. Decline anticipated.
- Bottom identified. Bounce predicted.
- Wedge identified. Top identified in both price/time. Sell-off predicted.
- Bottom anticipated and identified.
- Top identified. Short position established.
- Bottomed identified. Short position covered, long position established.
- Long position liquidated. What most people don’t realize is how close we came to a 1987 style “stock market crash” sequence initiation at this point. We were literally 2 days away from confirming a market crash. And even thought the crash didn’t materialize, it is nice to know when a possible crash can develop. No other service can do that. (No short position was established as there was no confirmation).
- Top predicted and identified. Short position established and subsequently covered around December 16th bottom.
Reserve Your Spot Now: Please note, due to my hedge fund obligations only 20 premium subscription spots are available each month. To reserve yours, please click on the button below to request your 14-day free trial -OR- read on for more details. Thanks.
 Please Click Here Reserve Your Spot Now