
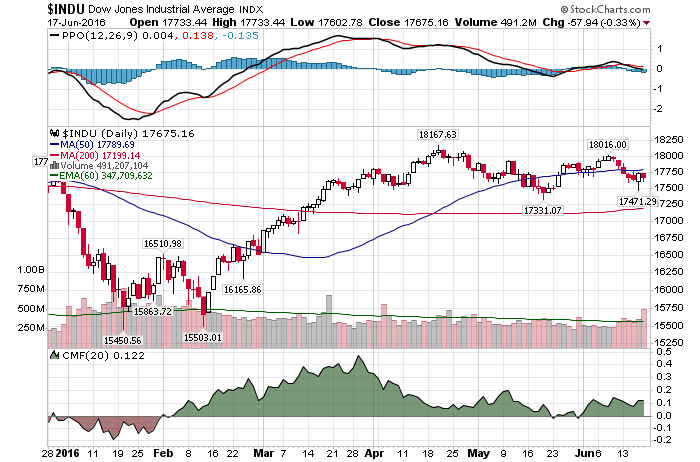
6/17/2016 – A negative day with the Dow Jones down 58 points (-0.33%) and the Nasdaq down 45 points (-0.92%)
Dear Readers,
I have decided to terminate daily posting on this blog for the time being. Mostly due to the lack of time, but also because I have already said everything that I wanted to say. At least for now.
OUR PREMIUM SERVICE CONTINUES UNINTERRUPTED (Click Here).
I will continue to post here, but not based on any fixed schedule. Further, I am currently developing a technical approach to the daily market summary and explanation. This analysis might become available on the regular basis later in the Fall.
Finally, in addition to our all important “Long-Term Market Analysis” article below, I am including links to some of the most popular pages and posts on this site (in no particular order). Enjoy. And don’t forget, our premium services remains fully functional Click Here. For everything else use the search box to the right. Thank you!!!
- How We Nailed May 19th, 2015 Top -To The Day.
- What You Ought To Know About This Shocking Carl Icahn Video
- Nuclear World War 3 Is Coming Soon.When, How & Why (Full Report)
- Investment Grin Of The Day
- Is It Time To Buy Russia (RSX)?
- Bulls Win As Housing Bubble Gets Even Bigger
- GAAP Earnings Collapse 18% As Valuations Approach “Insane Levels”
- Central Bank Mafia Goes All In…Stocks Rally…A Little
- If Our Entire Universe Is Holographic, What About The Stock Market?
- These Shocking Charts Lead To Bullish Nightmares. At Least They Should.
- 2007 Top Vs. Today. Just How Bad Is It?
- How Financial Media Sentiment Can Help You Time The Market
- Why ALL Investors Should Be Furious With The FED
- How To Legally Loot The Bank Of Your Choice
- Margin Debt Points To A Bear Market.
- Ichan, Druckenmiller & Wynn: Dead On Or Have They Gone Insane?
- Bridgewater Associates Secret To Success
- Is Russia Fearful Of NATO’s Strike?
- Why The FED Will Not Raise Interest Rates
- Just How Big Is China’s Credit Bubble?
- InvestWithAlex Predicts: Donald Trump Will Be The Next President
- Jim Rogers’s Shocking Interview
- Investment Heavyweights Load Up On The Short Side. Should You?
- What You Ought To Know About The Fed
- Apple (AAPL) Hits An Important Technical Juncture – What Will It Do Next?
- Global Stock Indices, Futures, Bonds and Stocks
- Commodities & Currencies
- Timed Value: Timing The Stock Market
LONG-TERM MARKET ANALYSIS
I have been sharing the analysis below, on and off, for over a year. Coincidentally, the Dow topped out exactly a year ago or on May 19th, 2015 at 18,351. Yet, to see a more exact long-term hit investor must look at the NYSE (largest index by capitalization). That index topped out in June of 2014. Right on schedule and 5.5 years into its bull cycle. That’s right, most stocks have been in a “stealth bear market” of sorts for close to two years.
So, what happens next?
Consider our analysis below. It is just as relevant today as it was 12-18 months ago.
Below is a comprehensive longer-term review of the stock market and what the next few years holds.
In the early January of 2000, the US Economy wa s booming. The Dow was fast approaching 11,800 and the Nasdaq was a stone throws away from its improbable benchmark of 5,000. Everyone was making a ton of money and as far as most people were concerned, the future looked very bright. So much so, that very few people predicted a bear market of 2000-2002, let alone a secular 2000-2017 bear market that was about to begin.
The only way to do so was to know and to understand the cyclical TIME structure oscillating within the stock market. For instance, an analyst working with such time cycles would know that the stock market’s 17-18 year cycle was topping out in conjunction with the 5 year cycle that started at 1994 bottom. The bull market that started at the bottom in August of 1982 was coming to a conclusion. In fact, it would top out exactly 17.5 years after it had started or on January 14th, 2000 at 11,800. The 5 year cycle that started in December of 1994 would top out at exactly the same time; 5 years and 35 trading days after it had started.
What does this have to do with predicting a severe bear market of 2014/15-2017?
Everything. Based on my work the stock market is a mathematically precise entity. And while there are hundreds of TIME cycles oscillating within the stock market at any one time, I will concentrate on only two to prove my point. The 17-18 cycle and the 5 year cycles. We will look at these cycles over the last 100+ years and I will prove to you, without a shadow of a doubt, they work.
THE 17-18 YEAR CYCLE IN THE STOCK MARKET:
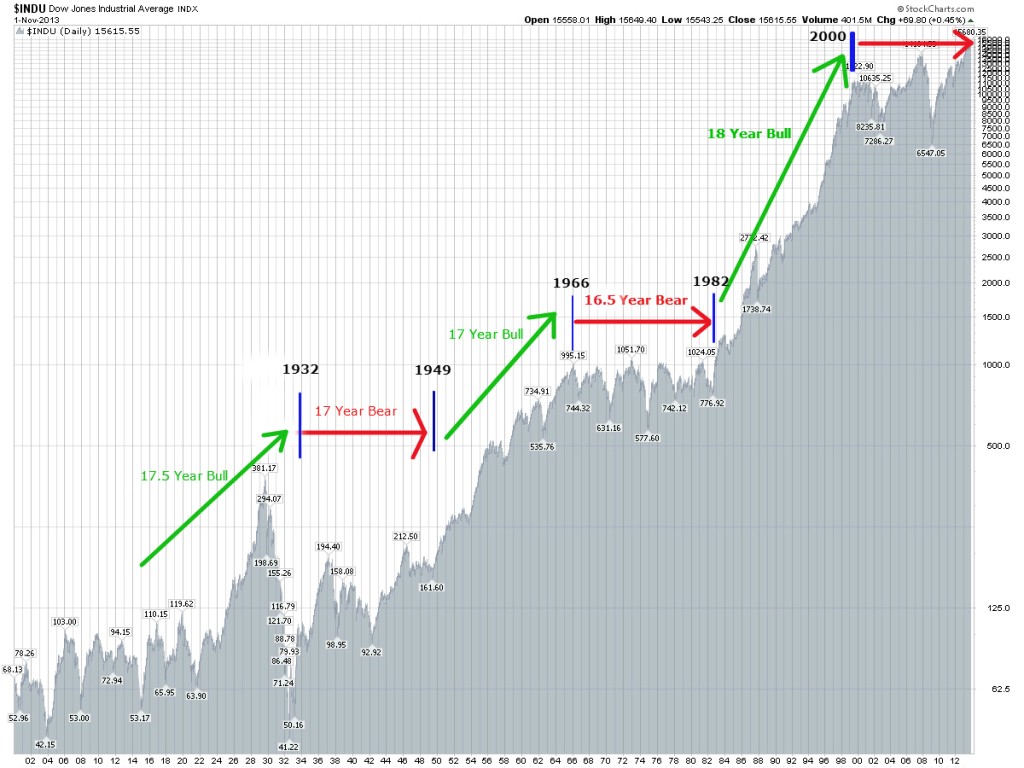
Long-term cycles within the stock market tend to oscillate going all the way back to the first day of trading, in May of 1790. If you would be inclined, I would encourage you to verify that information for yourself. For our purposes we will start our analysis a little bit later or exactly 100 years ago. As the chart above indicates, the stock market tends to oscillate in clearly defined 17-18 year alternating Bull/Bear market cycles.
- 17.5 Year Bull Market (1914 bottom to 1932 bottom): The previous bear market terminated in July of 1914. At that time the US stock market shut down for World War 1. The stock market remained closed between August of 1914 and December of 1914 (a very rare occurrence). When the market finally reopened in December of 1914 it immediately began a rally that would not terminate until October of 1929. Followed by a now famous 1929 stock market crash and a massive 90% 3 year decline. The cycle terminated at the bottom in 1932, completing the 17.5 year bull market cycle at that time.
*Note: It is important to address the 1929-1932 bear market and its impact on the overall 1914-1932 Bull Market cycle. It is a complex matter to discuss without sufficient background or understanding, but the final (short-term) structural composition of this Bull Cycle inverted over the last 3 years (1929-1932). Mostly due to a massive rally between 1924-1929 and a number of down cycles converging on this time period at the same time. Regardless, the overall cycle lasted 17.5 years.
- 17 Year BEAR Market (1932 bottom to 1949 bottom): The cycle originated at the bottom in July of 1932 and lasted until June of 1949. During this period of time we had a post great depression bounce, 1937 crash and World War 2. Yet, despite the overall upward trajectory, this clearly defined 1949 bottom remained 60% below its 1929 top and well below both its 1937 and 1942 tops.
- 17 Year BULL Market (1949 bottom to 1966 top): The market surged higher between 1949 bottom and 1966 top. This was the so called “Golden Age” of post war reconstruction and the American industrial boom. During this time the Dow appreciated over 500% in a clearly defined bull market cycle.
- 16.5 Year BEAR Market (1966 top to 1982 bottom): The market stayed relatively flat during this period of time with a few notable declines of 30-50%. With the 1972-1974 mid cycle decline of 54% being the largest one. This clearly defined bear market completed in August of 1982. Approximately 25% below its 1966 top.
- 17.5 Year BULL Market (1982 bottom to 2000 top): A very well known period and a clearly defined bull market. The market surged higher from its August of 1982 bottom to reach its historic top in January of 2000. During this time the Dow appreciated over 1,400% in one of the strongest bull markets in history.
- 17 Year BEAR Market (2000 top to 2017 bottom): Even though the market is sitting near all time highs (as of this writing in January of 2014) and even though most people have assumed that the new bull market has started, in relative terms the market hasn’t appreciated very much since its top in 2000. The Nasdaq is still down. Plus, with the final down leg of this bear market being ahead of us (based on my mathematical and timing work), the BEAR market of 2000-2017 should complete itself in a negative territory or below its 2000 top.
It is important to note that the small variation (of +/- 1 year) in duration of these cycles is caused by smaller or larger cycles arriving at the same time. As such and based on the cycles above, we are no longer working in an arbitrary fashion when it comes to predicting the stock market. In other words, if the stock market repeats a clearly defined 17-18 year Bull/Bear cycle over a 220 year period of time (since 1790) and does so without interruption, it is safe to assume that the future is predictable and not random.
THE 5 YEAR CYCLE IN THE STOCK MARKET
One other easily identifiable cycle within the stock market is the 5 year cycle. These 5 year cycles represent one completed growth pattern or one completed Bull or Bear cycle. Typically, they tend to appear for 5 years, disappear and then reappear at a certain point in the future. While they are not sequential as the 17-18 year cycle above, once their place within the overall stock market is understood, they show up at exactly the right time. For instance,
- 1914 -1920: Bull Market
- 1924-1929: Bull Market (followed by a 1929 crash)
- 1932-1937: Bull Market (followed by a 1937 crash)
- 1937-1942: Bear Market
- 1966-1971: Bear Market
- 1982-1987: Bull Market (followed by a 1987 crash)
- 1994-2000: Bull Market (followed by a 2000 crash)
- 2002-2007: Bull Market (followed by a 2007 crash)
- 2009-2014: Bull Market
One thing to understand about these 5 Year cycles is that they are exact. They have much lower level variance as compared to their longer counterparts. Essentially, we are NOT talking about 5 years +/- 6 months. We are talking about 5 years +/- a few days. For instance, the 2002-2007cycle started on October 10th, 2002 (at 2002 bottom) and terminated on October 11th, 2007. If you are counting, that is exactly 5 Years and 1 day or scary accurate. I encourage you to study the other cycles outlined above in order to prove to yourself how shockingly accurate they all are.
CONCLUSION:
In summary, predicting a bear market of 2015-2017 is rather simple. All 17-18 year bear cycles end with a 2-3 year bear market. For instance, 1912-1914, 1946-1949 and 1979-1982. And while most believe that the secular bear market ended at 2009 bottom, it is not the case. The secular bear market of 2000-2017 is still in effect and will terminate only when the year 2017 is reached. Although the final price bottom will be higher than the mid-cycle bottom reached in March of 2009.
Further, the 5-Year cycle that started on March 6th, 2009 bottom terminated on July 16th, 2014. Suggesting that the stock market is now ready to initiate its bear leg (despite recent higher highs). When I combine this cyclical analysis with the rest of my mathematical and timing work, the outcome is crystal clear. A severe bear market of 2015-2017 is just around the corner.
This conclusion is further supported by my mathematical and timing work. It clearly shows a severe bear market between 2014/15-2017. In fact, when it starts it will very quickly retrace most of the gains accrued over the last few years. If you would be interested in learning when the bear market of 2014/15-2017 will start (to the day) and its internal composition, please CLICK HERE.
(***Please Note: A bear market might have started already, I am simply not disclosing this information. Due to my obligations to my Subscribers I am unable to provide you with more exact forecasts. In fact, I am being “Wishy Washy” at best with my FREE daily updates here. If you would be interested in exact forecasts, dates, times and precise daily coverage, please Click Here). Daily Stock Market Update. April 1st, 2016 InvestWithAlex.com
Did you enjoy this article? If so, please share our blog with your friends as we try to get traction. Gratitude!!!
