
That’s right ladies and gentlemen, this improved version of the CAPE ratio (improved because it has a greater negative correlation with future 12-year returns) shows equity valuations have now surpassed both the dotcom mania peak in 2000 and the 1929 mania peak. We are truly in uncharted territory. 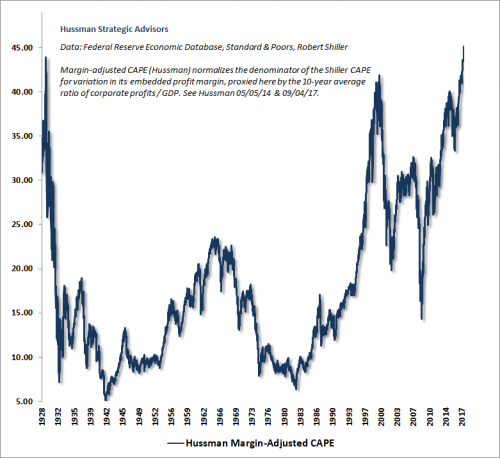
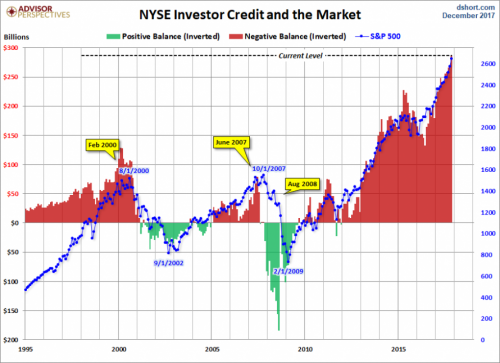
Plus, investors today are employing more leverage than ever before. In fact, margin debt has at least doubled from its prior 2000 peak. And this doesn’t even include the asset-backed loans at major financial firms which have become so popular in recent years.
To very quickly summarize: Everyone is long and strong, the stock market has never been more expensive by quite a few measures AND jet fuel margin debt (both up and down) has doubled from its Dot.com bubble peak.
That is to say, what can possibly go wrong?
If you would like to find out what the stock market will do next based on our timing and mathematical work, please Click Here.