
 State of the Market Address:
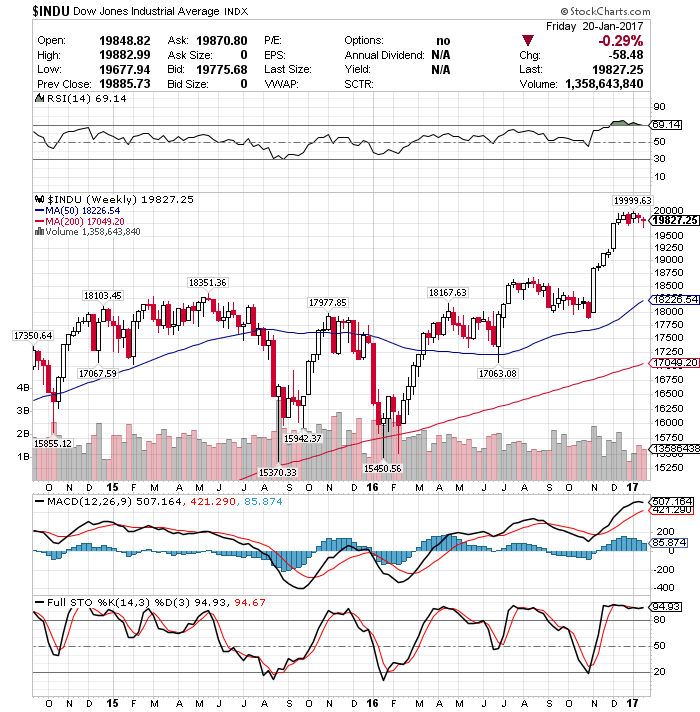
- The Dow has been stuck in a 300 point trading range (19,999-19,700) since about December 12th of 2016. Either distributing at the top or consolidating.
- Shiller’s Adjusted S&P P/E ratio is at 28.15. Arguably the second highest level in history (if we adjust for 2000 distortions) and right behind 1929 top at 29.55.
- Weekly RSI at 69.14 Remains at overbough levels.
- Prior years corrections terminated at around 200 day moving average. Located at around 17,000 today.
- Short-term MACD is beginning to roll over.
- Stochastics weekly remain at 94.93 and slowly declining. Extremely overbought level associated with prior market peaks.
- Last weeks CTO Reports suggest that commercials (smart money) are shifting their positioning to net short. For instance, the Dow is 5X, the S&P is at 2X and the Nasdaq is at 4X short. That is a significant short position against the market.
- Demand for VIX has spiked. Last week, investors have purchased 250,000 VIX call options with a strike price at 21, and another 100,000 with the strike at 22. Commercial VIX position is at 5X long.
In summary: For the time being the market remains in a clear bull trend. Yet, a number of indicators suggest the market might experience a substantial correction ahead. The market remains at extreme valuation levels and severely overbought on weekly charts. Plus, the “smart money” is positioning for some sort of a sell-off. If you would like to find out exactly what happens next based on our Timing and Mathematical work, please Click Here.
ATTENTION!!! Please note, we have moved most of our free editorial content to our new website MarketSpartans.com Please Click Here to view it.