
 – State of the Market Address:
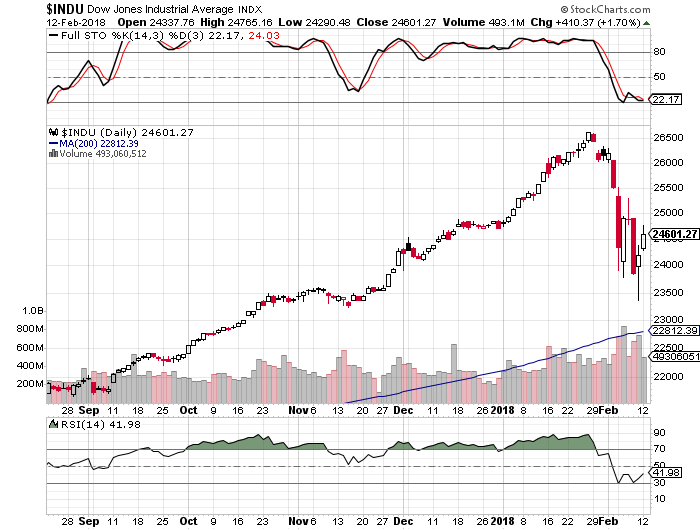
- The Dow is back above 24,000
- Shiller’s Adjusted S&P P/E ratio is now at 32.14 Off highs, but still arguably at the highest level in history (if we adjust for 2000 distortions) and still above 1929 top of 29.55.
- Weekly RSI at 53 – neutral. Daily RSI is at 42 – neutral.
- Prior years corrections terminated at around 200 day moving average. Located at around 18,800 today (on weekly).
- Weekly Stochastics at 56 – neutral. Daily at 22 – oversold
- NYSE McClellan Oscillator is at -74. Oversold.
- Volatility measures VIX/VXX positioning reversed dramatically right before the “crash”. Commercial VIX long interest went from being 22K contracts net long to being 30K contracts net short.
- Last week’s CTO Reports suggest that commercials (smart money) have, more or less, maintained their positioning. For now, the Dow is 3X, the S&P is at 4X net short, Russell 2000 is now at 2.5X net short and the Nasdaq is net neutral.
In summary: For the time being and long-term, the market remains in a clear bull trend. Yet, a number of longer-term indicators suggest the market might experience a substantial correction ahead. Plus, the “smart money” is positioning for some sort of a sell-off.
If you would like to find out exactly what happens next based on our Timing and Mathematical work, please Click Here.
ATTENTION!!! Please note, we have moved most of our free editorial content to our new website MarketSpartans.com Please Click Here to view it.