
 State of the Market Address:
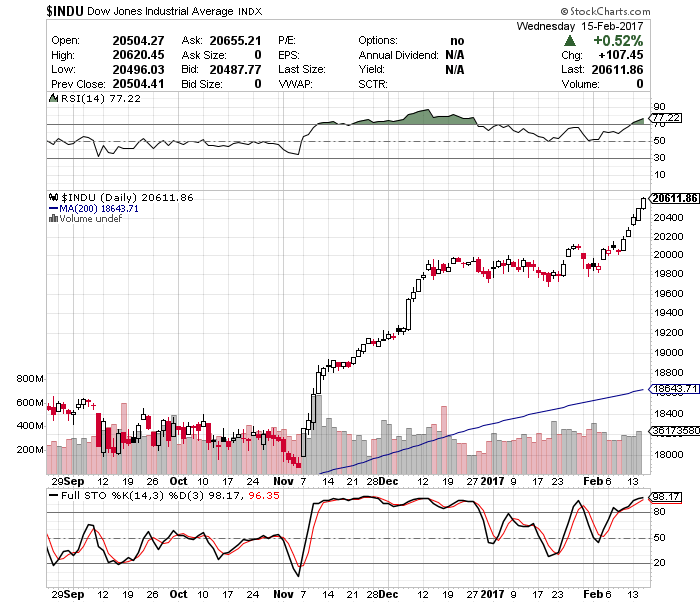
- The Dow, and other indices, continue to surge higher.
- Shiller’s Adjusted S&P P/E ratio is now at 29.11. Arguably the second highest level in history (if we adjust for 2000 distortions) and right behind 1929 top at 29.55.
- Weekly RSI at 77.29. At severely overbought levels. Daily RSI is at 77.22- at severely overbought levels as well.
- Prior years corrections terminated at around 200 day moving average. Located at around 17,100 today (on weekly).
- Weekly stochastics at 98.8. Extremely overbought level associated with prior market peaks. Daily at 98.17 – at severly overbought levels as well.
- VIX/VXX either at or approaching their historic lows. Commercial VIX long interest approaching record highs. Now at 11X net long.
- Last week’s CTO Reports suggest that commercials (smart money) are shifting their positioning to net short. For instance, the Dow is 4X, the S&P is at 2X, Russell 2000 is at 4X and the Nasdaq is at 3X short. That is a significant short position against the market.
In summary: For the time being the market remains in a clear bull trend. Yet, a number of longer-term indicators suggest the market might experience a substantial correction ahead. The market remains at extreme valuation levels and severely overbought on weekly charts. Plus, the “smart money” is positioning for some sort of a sell-off. Short-term, the market is back to being overbought.
If you would like to find out exactly what happens next based on our Timing and Mathematical work, please Click Here.
ATTENTION!!! Please note, we have moved most of our free editorial content to our new website MarketSpartans.com Please Click Here to view it.