
State of the Market Address:
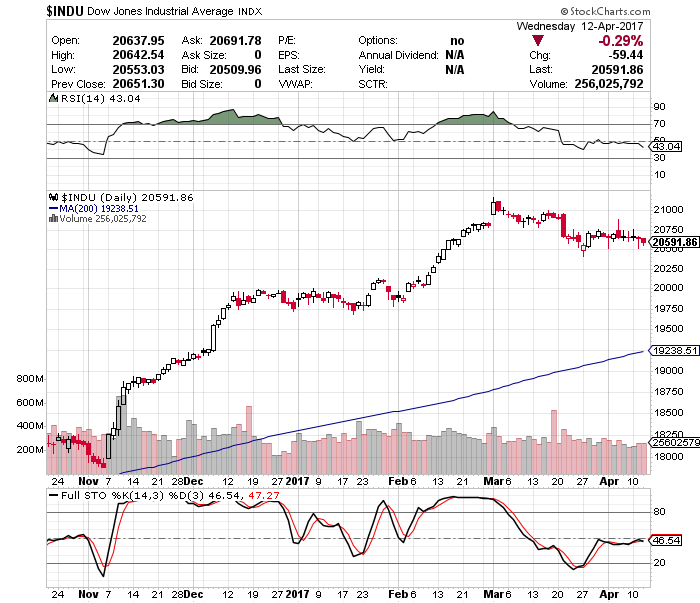
- The Dow remains below 21,000.
- Shiller’s Adjusted S&P P/E ratio is now at 28.80 Arguably the second highest level in history (if we adjust for 2000 distortions) and right behind 1929 top at 29.55.
- Weekly RSI at 66.36 Remains at overbought levels. Daily RSI is at 43.06 – neutral.
- Prior years corrections terminated at around 200 day moving average. Located at around 17,350 today (on weekly).
- Weekly stochastics at 64.32. Approaching neutral levels. Daily at 46.54 – neutral.
- NYSE McClellan Oscillator is at +33. Neutral, but has worked off severely oversold conditions. The market might be ready for another leg down.
- VIX/VXX remain near their historic lows. Commercial VIX long interest was slightly lower this week, but remains at near record levels. Now at 95K contracts net long.
- Last week’s CTO Reports suggest that commercials (smart money) are shifting their positioning to net short. In fact, short interest jumped dramatically as compared to last week. For instance, the Dow is 5.5X, the S&P is at 2X, Russell 2000 is at 2.5X and the Nasdaq is at 7X short. That is a significant short position against the market.
In summary: For the time being the market remains in a clear bull trend. Yet, a number of longer-term indicators suggest the market might experience a substantial correction ahead. The market remains at extreme valuation levels and severely overbought on both daily and weekly charts. Plus, the “smart money” is positioning for some sort of a sell-off.
If you would like to find out exactly what happens next based on our Timing and Mathematical work, please Click Here.
ATTENTION!!! Please note, we have moved most of our free editorial content to our new website MarketSpartans.com Please Click Here to view it.