Would You Believe Me If I Told You Bitcoin Did Not Bottom in 2022?

Here we go again………….to the moon !!!

Bitcoin could hit $80,000 by year-end, says this prominent asset manager

    • Bitcoin could reach an all-time high in 2024, with the potential to end the year at around $80,000, according to analysts at AllianceBernstein. The crypto BTCUSD’s price will likely be driven higher this year by the potential approval of an exchange-traded fund investing directly in bitcoin, the so-called halving event expected in April, and growing demand from companies, according to Gautam Chhugani and Mahika Sapra, analysts at AllianceBernstein. “We expect 2024 to be a breakout inflection year for crypto,” the analysts…

In early January of 2023 we confirmed Bitcoin’s November of 2022 bottom as a longer-term precise mathematical bottom and have suggested at the time that Bitcoin will run up to above $30K. No one believed us at the time – what else is new. 

It appears now that the proverbial Bitcoin bulls are coming back from the dead, their outlandish predictions are once again gaining steam. Not so fast….here is our latest Bitcoin (BTC) update……
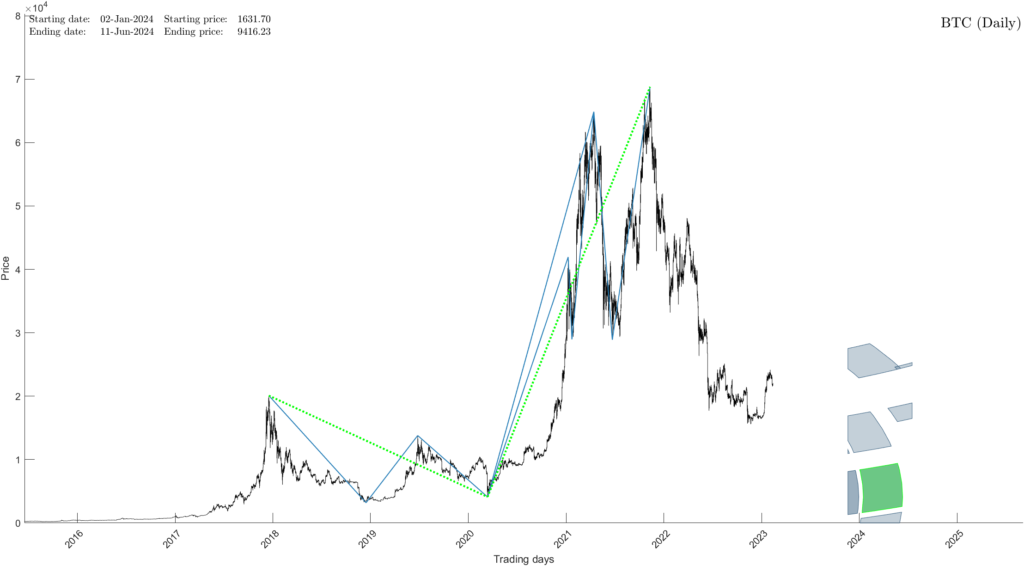
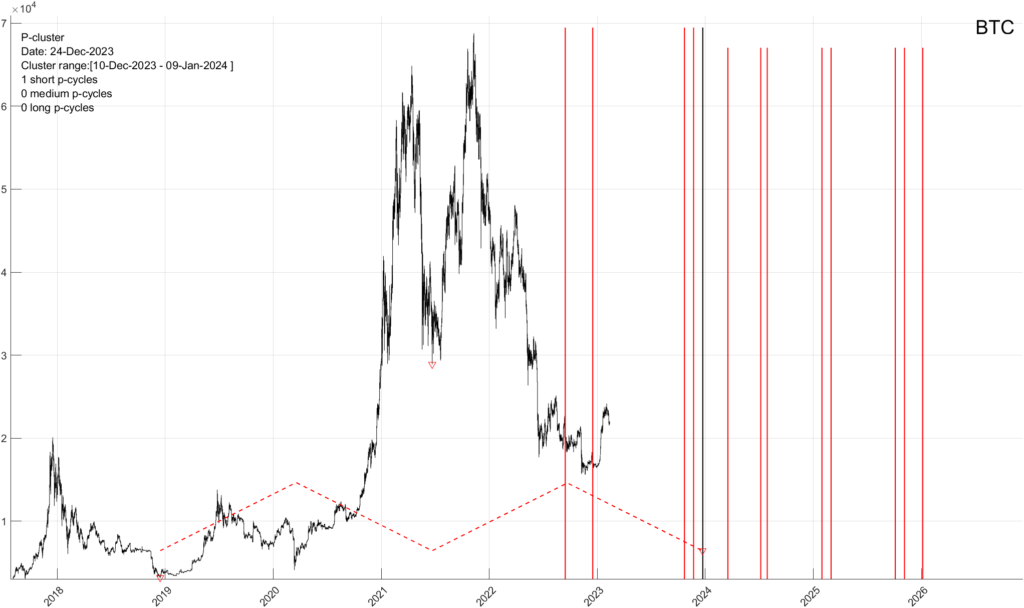
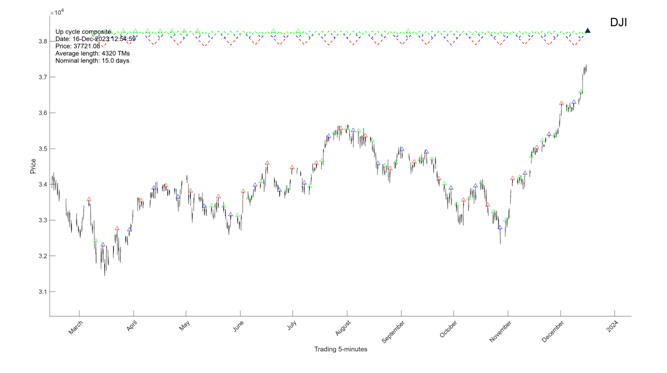
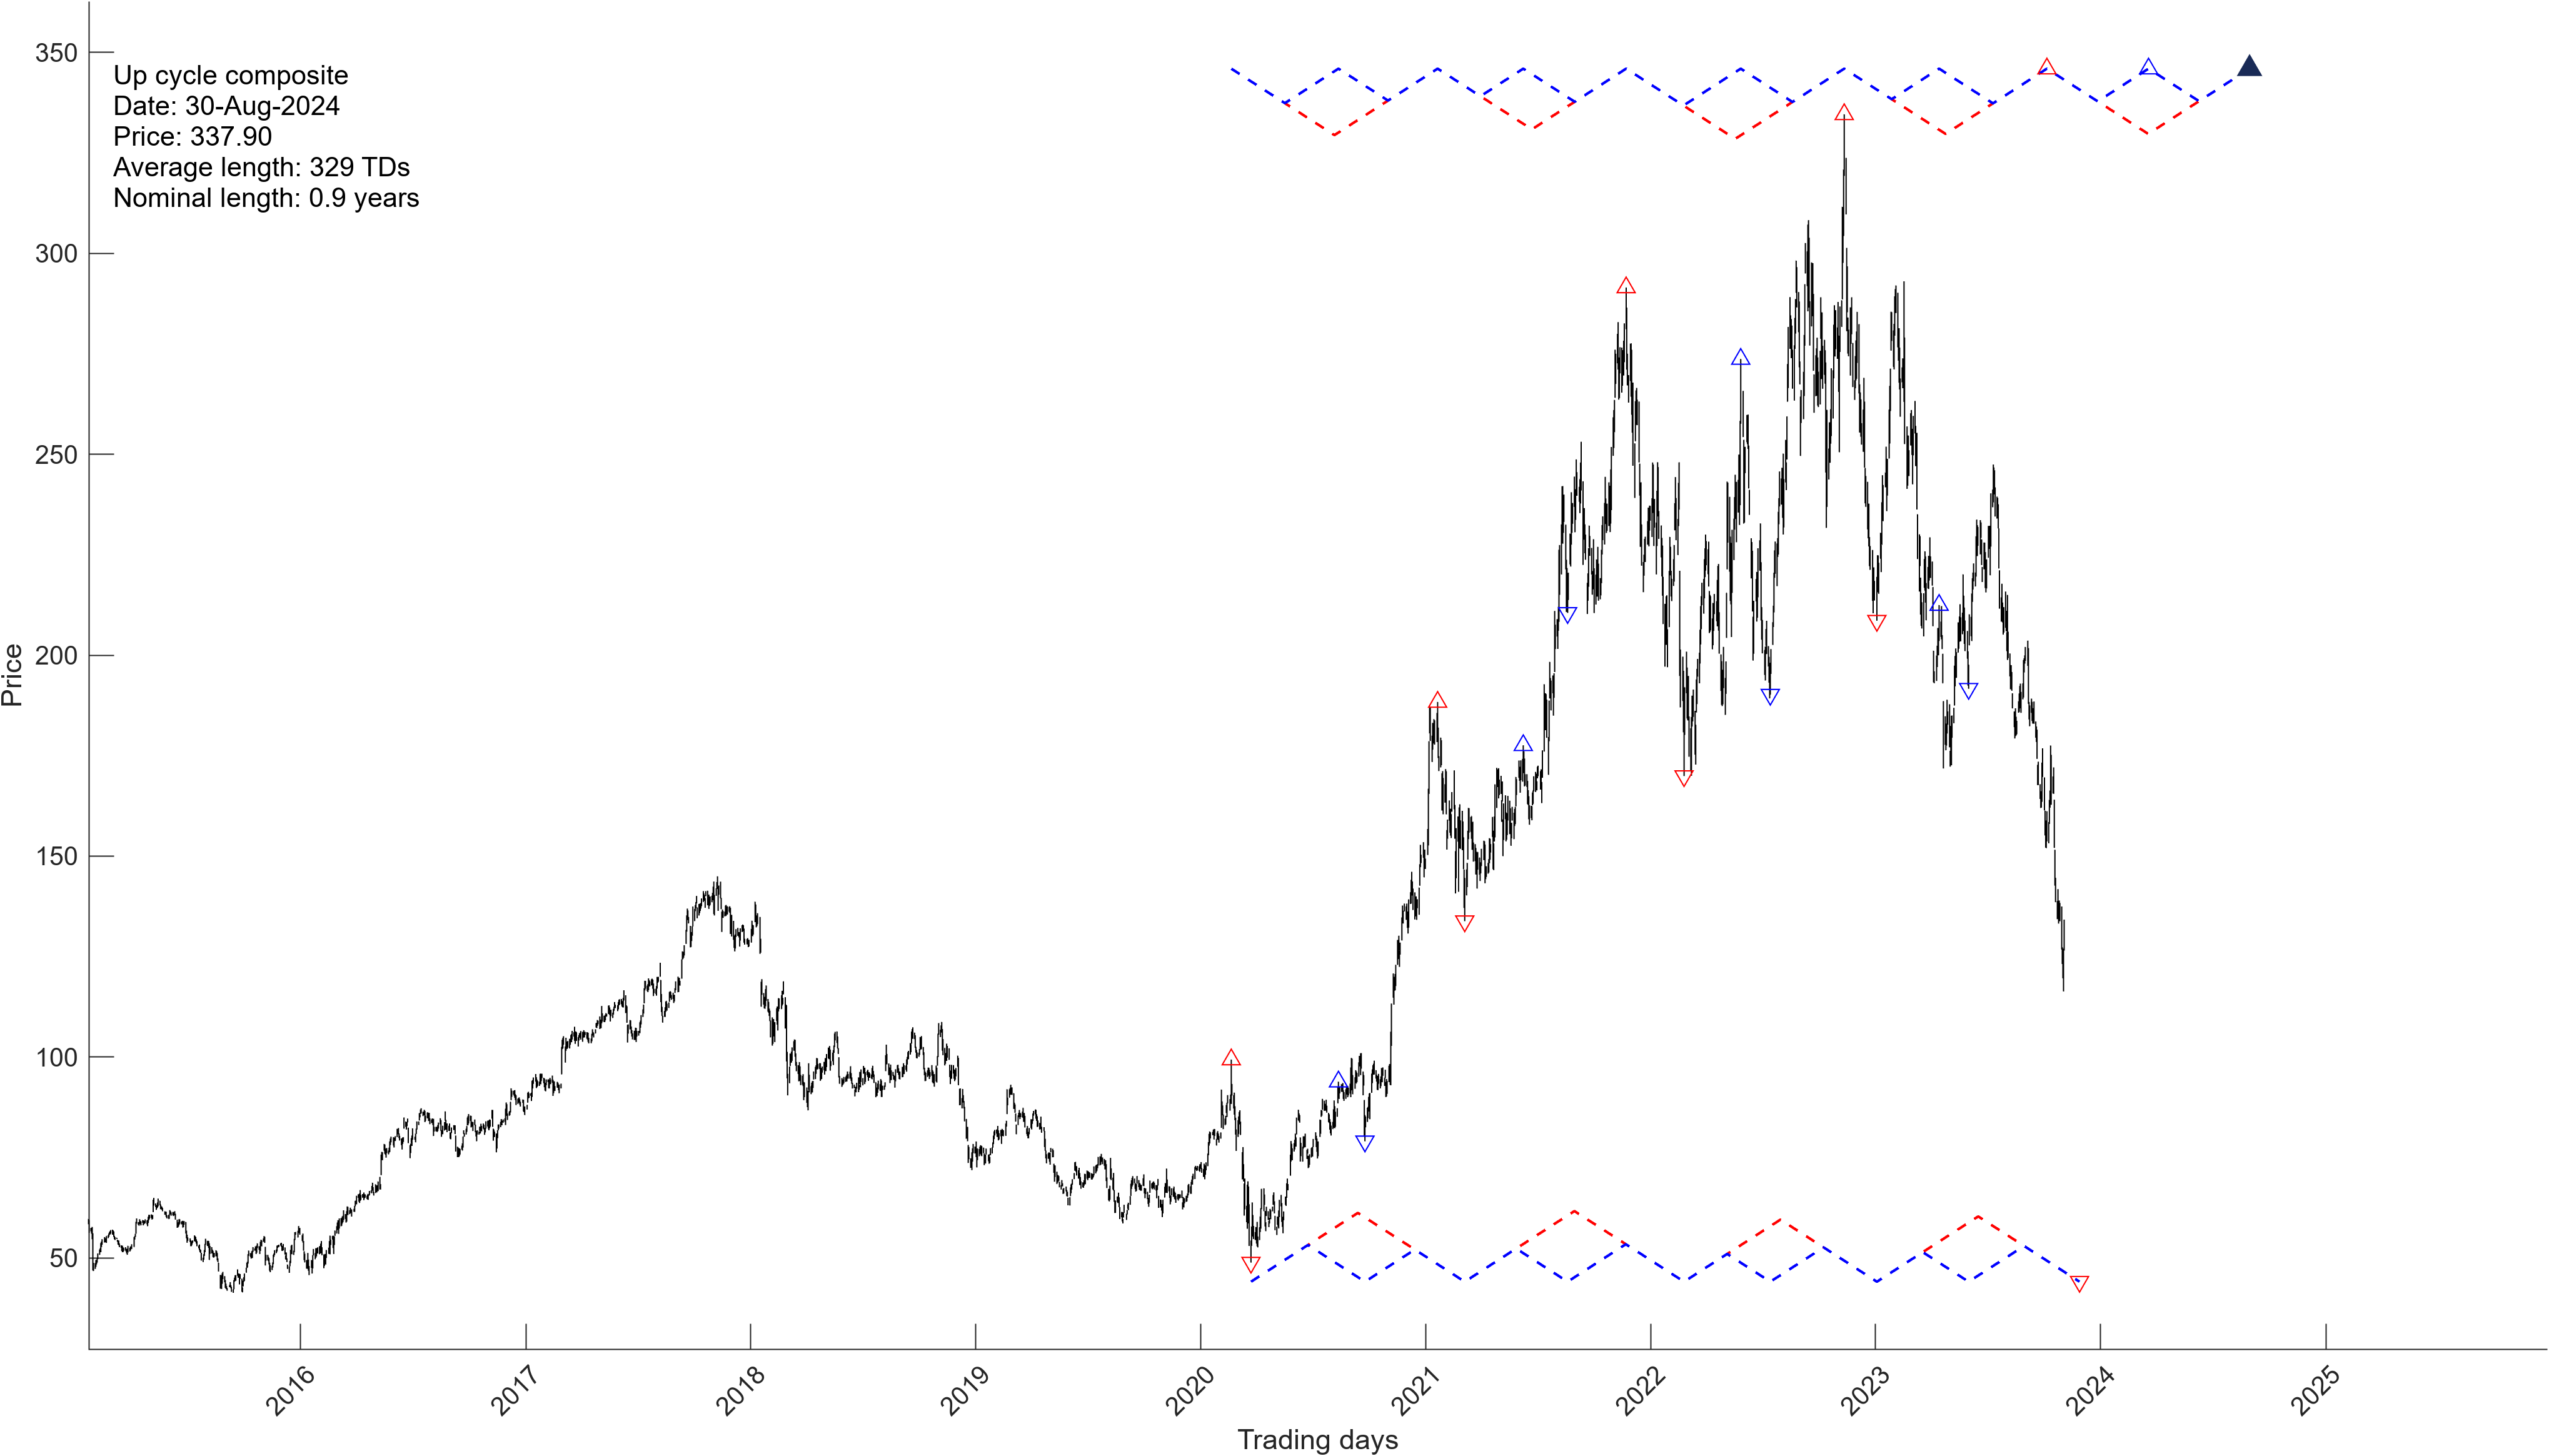
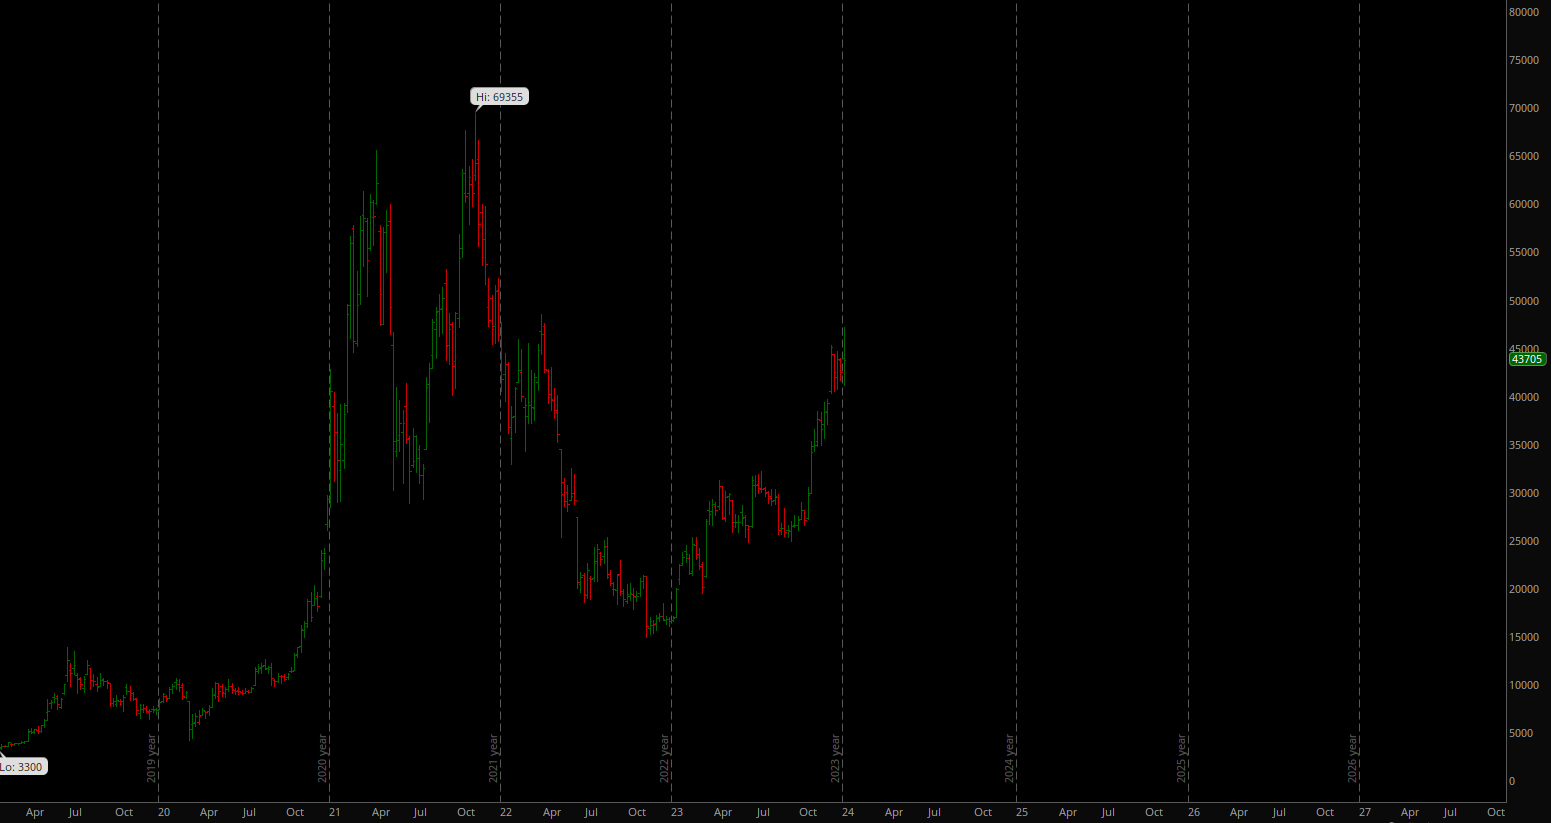
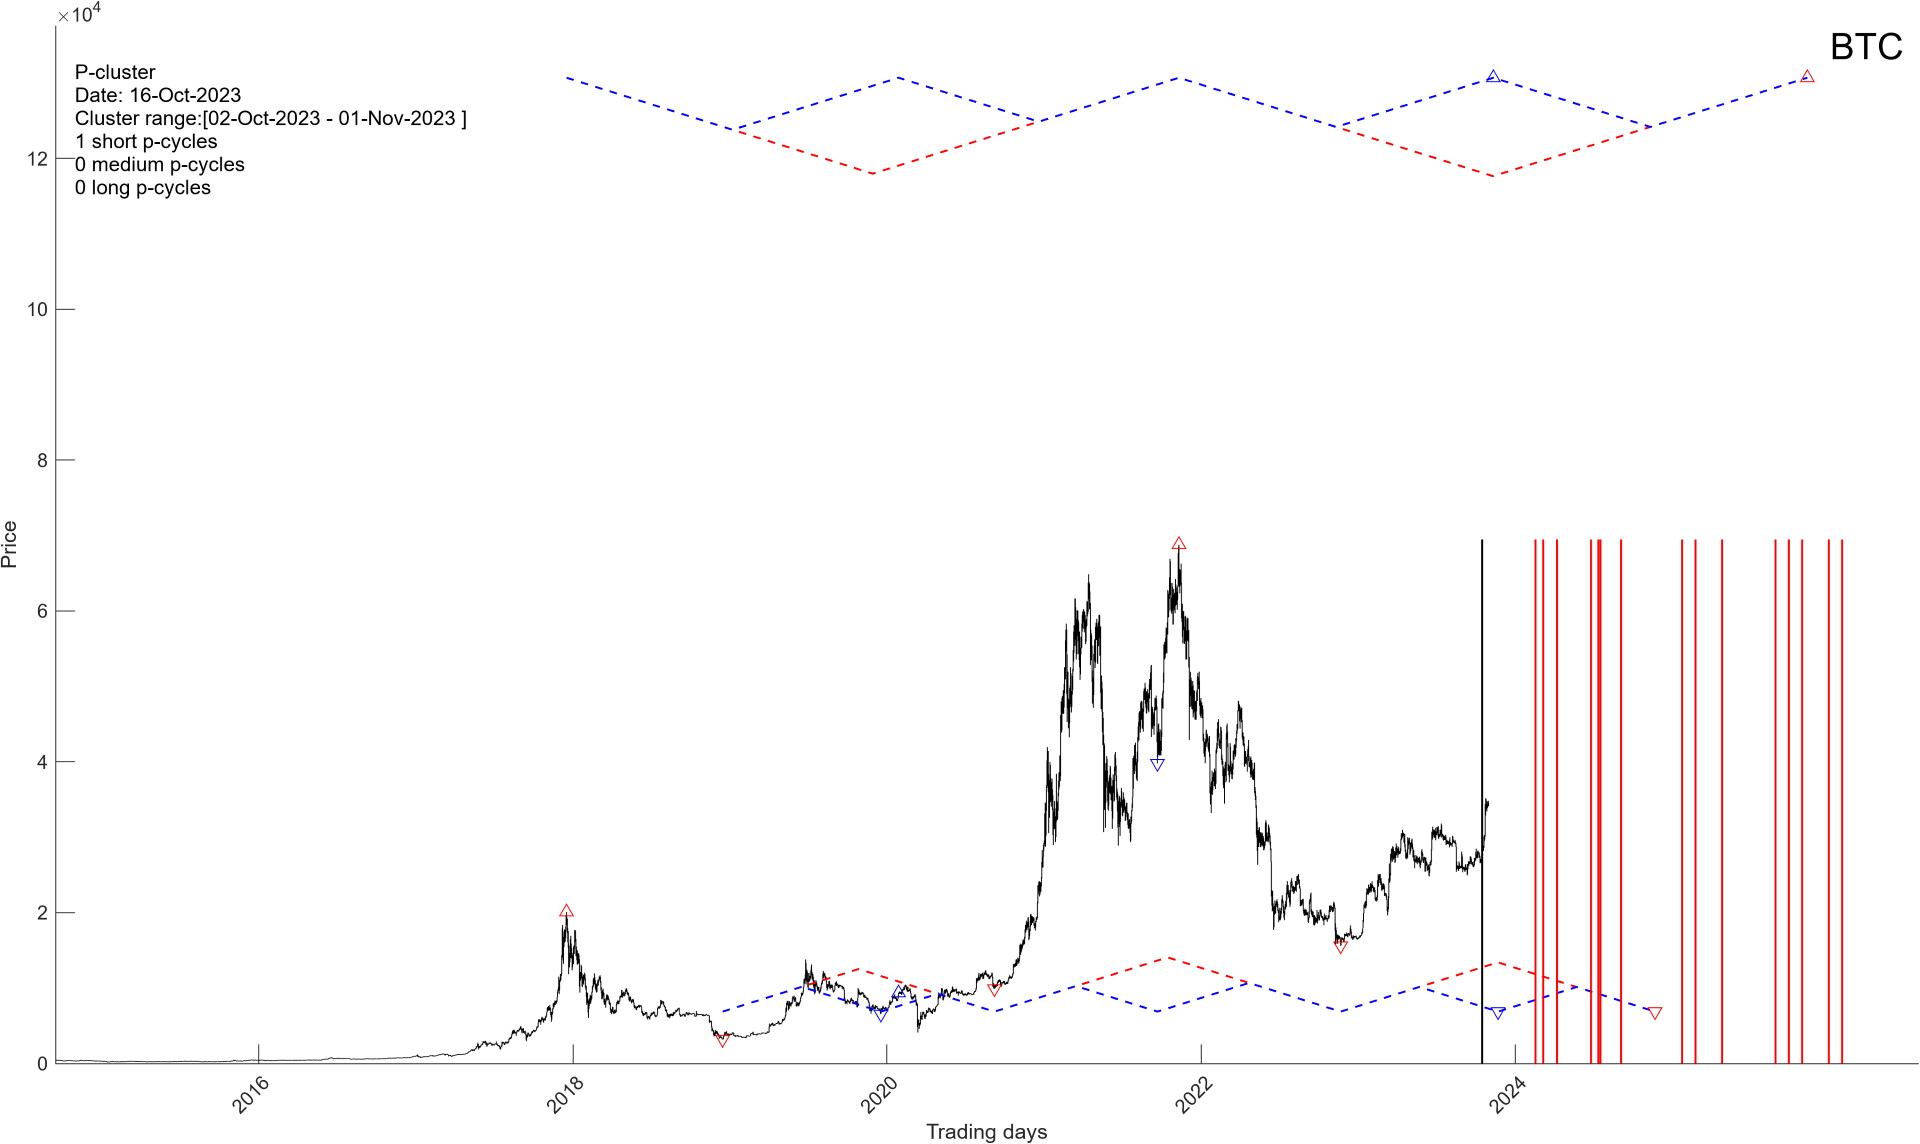
BITCOIN (BTC)
Date of Analysis: October 30th, 2023

Our mathematical and timing analysis for Bitcoin shows the following…….

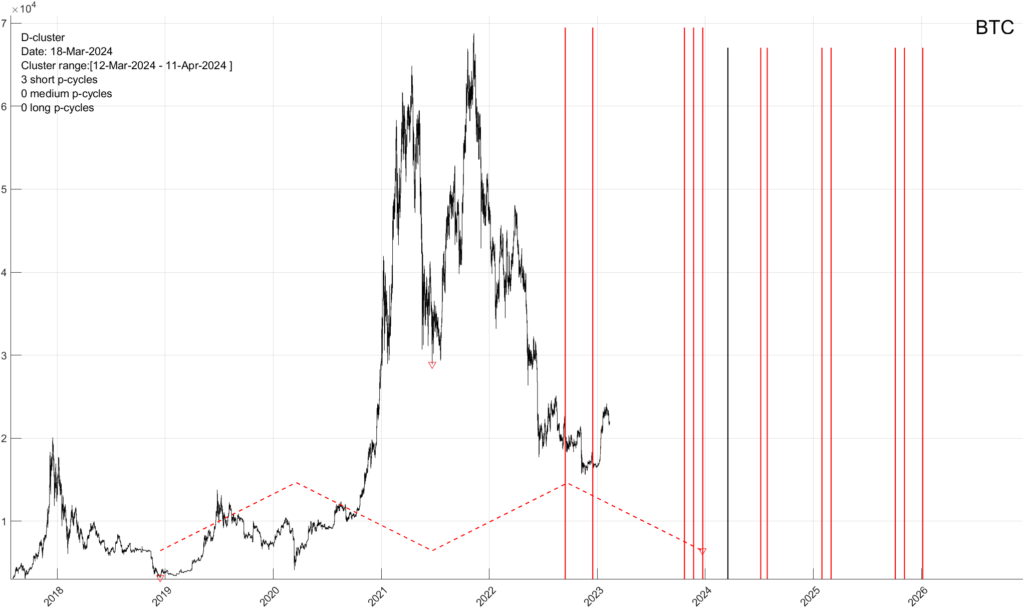
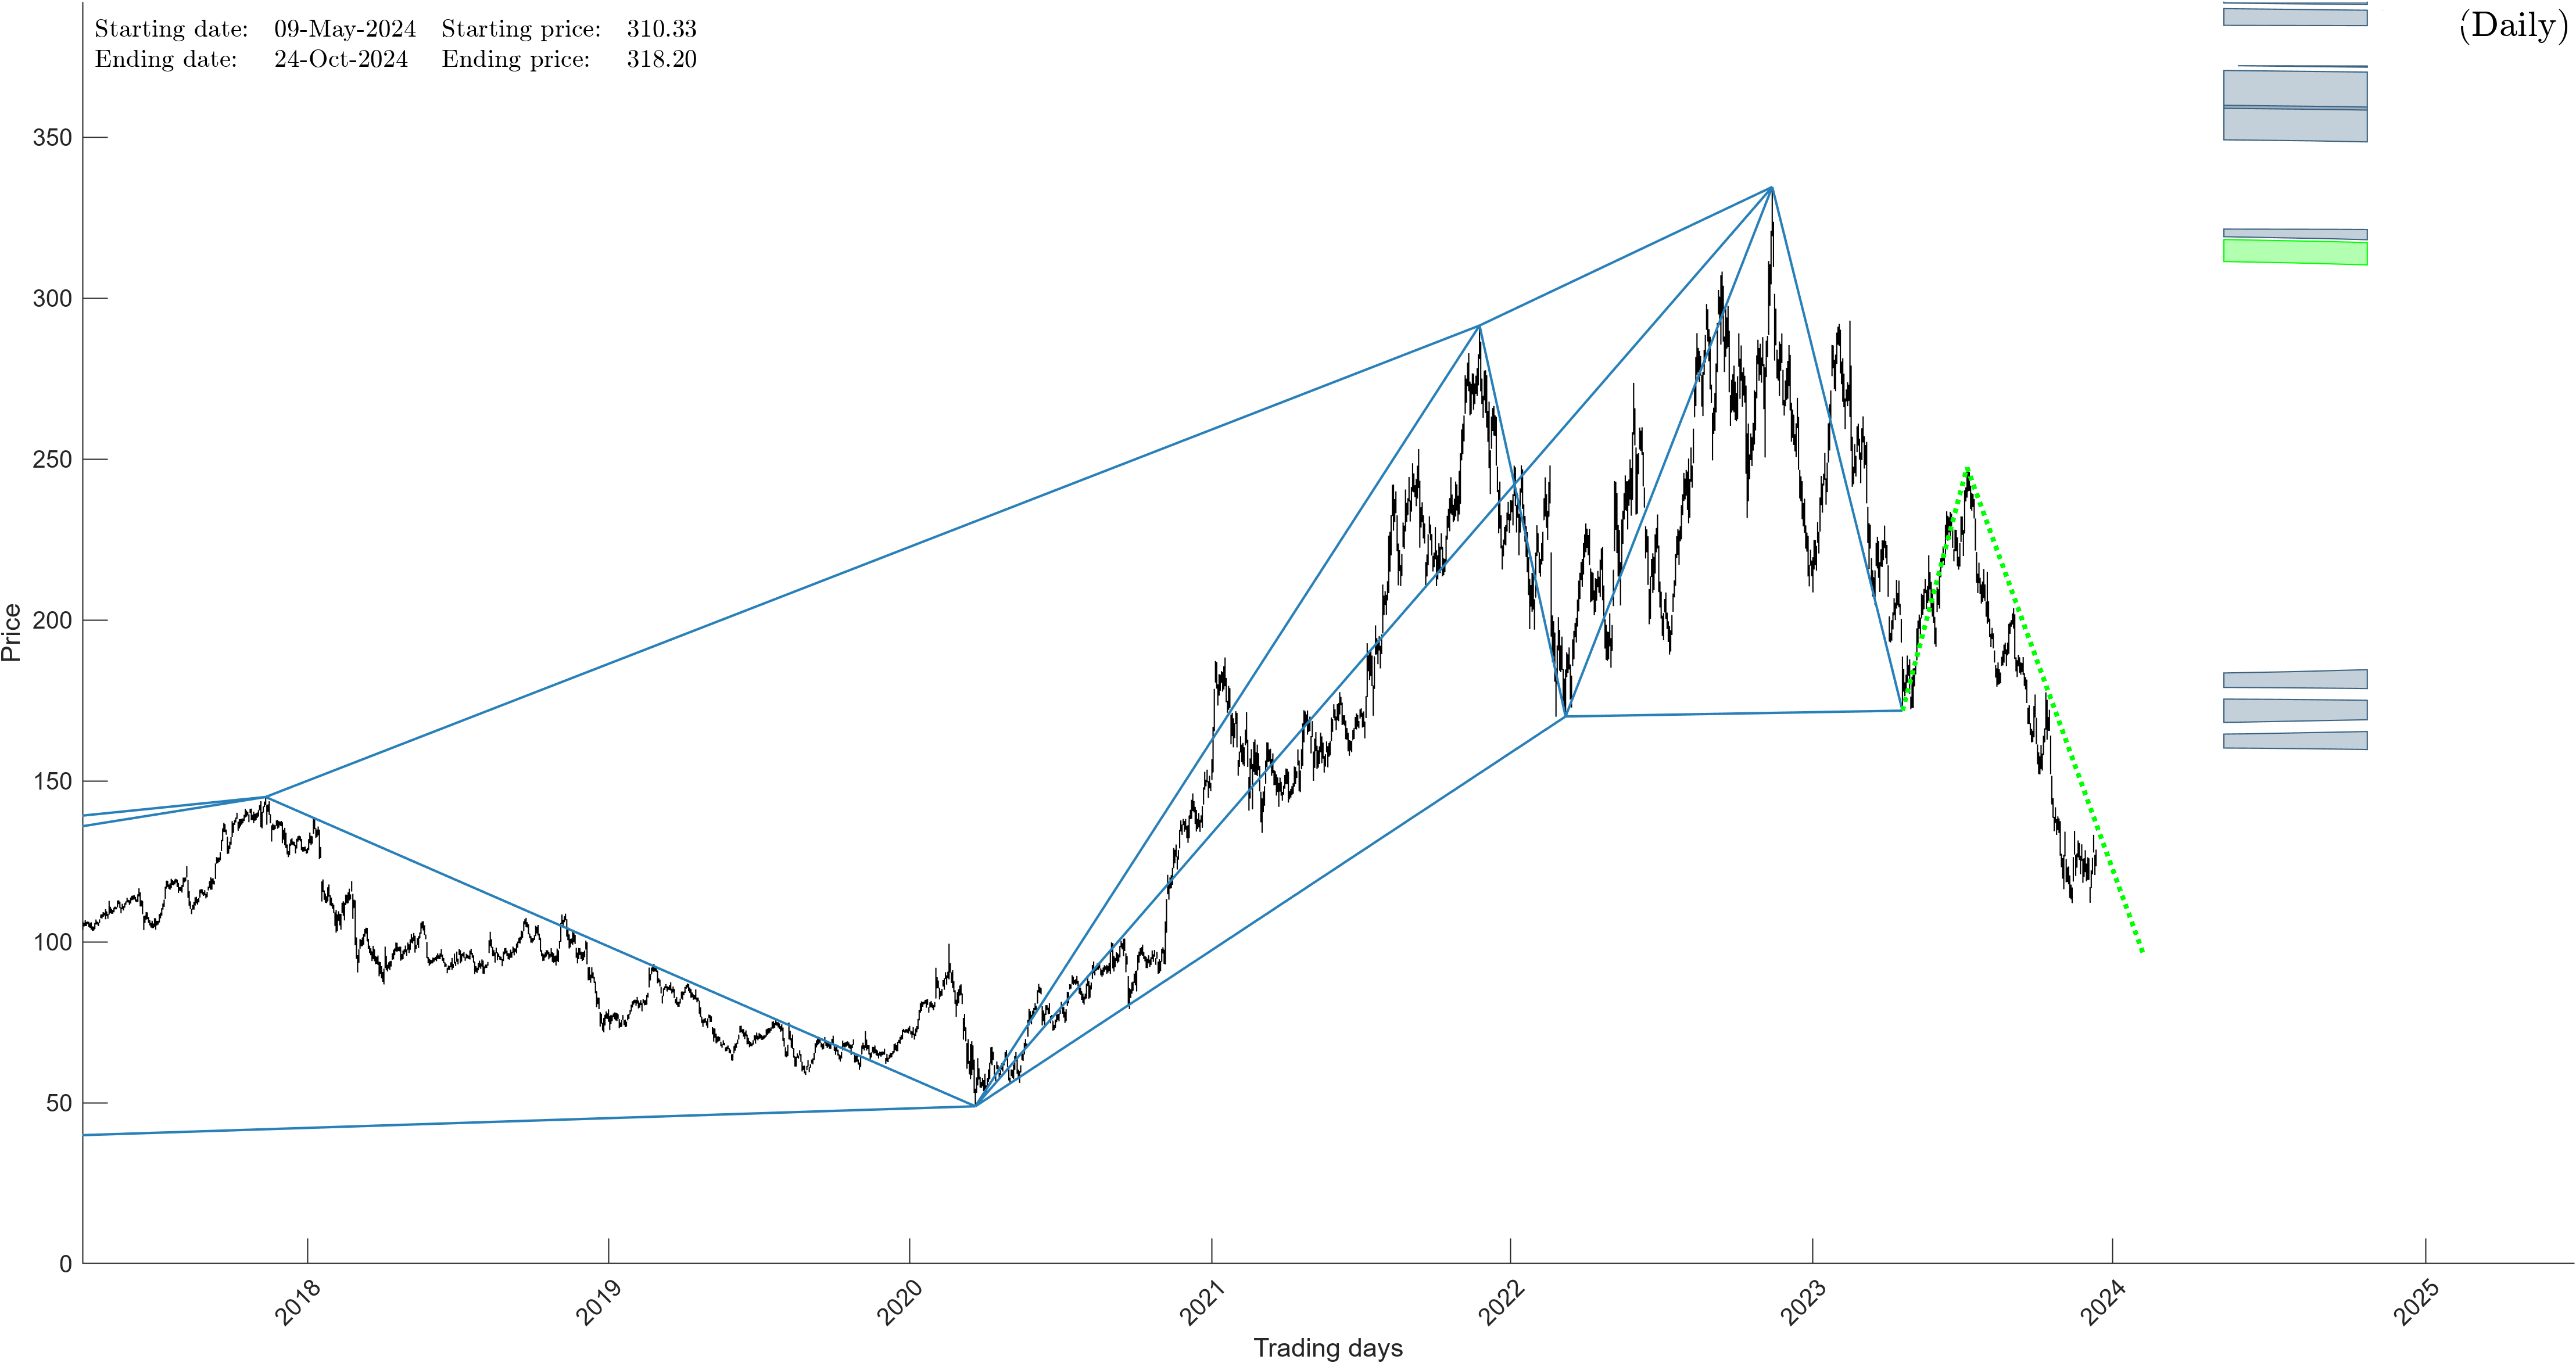
    • Short-term Bitcoin should remain range bound as it seeks out a mid-term top. We currently do not have any good mid-term time/price projections for this completion point. It’s a bit of a mess. 
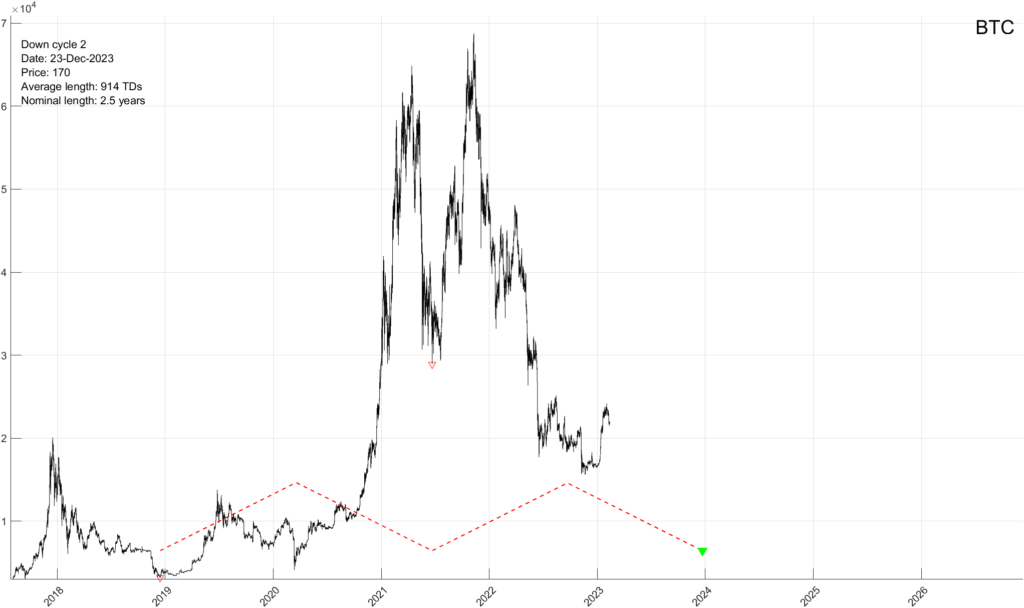
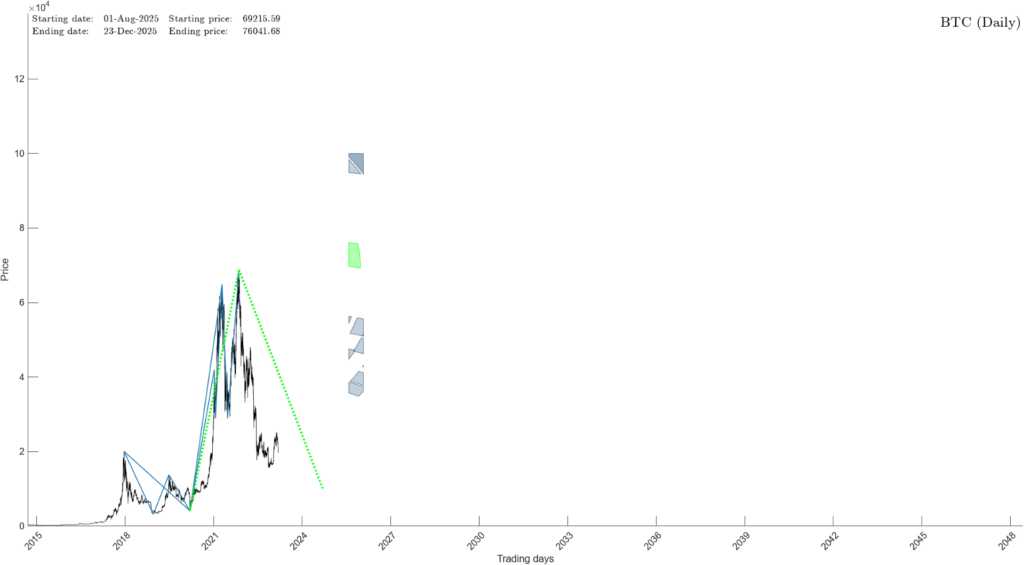
    • Once the mid-term top arrives BTC will decline into a major bottom scheduled to arrive around XXXX of 20XX. 
    • We do have some bottom projection points, with the most likely bottom located at XXXX (+/- 100), but we would need a mid-term top point above to confirm this in full. 
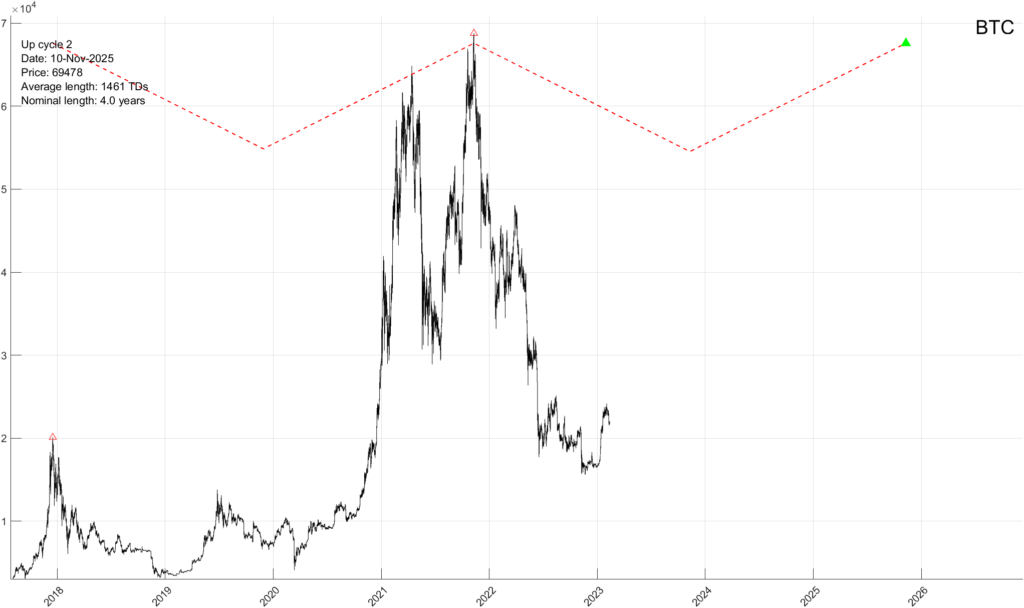
    • Once the bottom arrives Bitcoin will turn into a fast mover and surge to a new all time high by about November of 20XX. This is the move to participate in. 

In summary, expect a range bound Bitcoin until a major bottom arrives around XXXX of 20XX. Then a powerful move higher to a new all time high. A more exact targeting analysis will be available as we approach the junctures above. 

If you would like to see our exact TIME & PRICE targets for Bitcoin’s (BTC) major bottom, as well as our precise turning point “targeting analysis” , please CLICK HERE

Our Recent Apple (AAPL) Forecasts Have Been Perfect – Find Out What Happens Next

Apple Inc (AAPL) – UPDATE
Date: January 3rd, 2024

Thus far, our Apple (AAPL) forecasts have been nearly perfect. Our prior forecast/update called for a $200 price target by September-October of 2023 (see below). And although the top arrived a little bit later (due to time extension), AAPL did hit $199.62 on December 16th. Going forward, our timing and mathematical work for Apple shows the following…..

To See The Rest Of The Forecast, Please Click Here

PRIOR FORECAST

Apple Inc (AAPL) – UPDATE
Date: June 27th, 2023

Our original AAPL forecast (see below) is working out perfectly.  If you recall, we originally predicted AAPL bottom would arrive on October 31st, 2022 at $124. Yet, when the bottom wasn’t reached by that juncture, we quickly shifted our forecast to December 31st, 2022 (+/- 2 trading days).

As you know, the actual bottom arrived on January 3rd at $124.17…….a direct hit. 

This was followed by the following statement (people thought we were crazy)

  • Once the bottom is put in place, Apple stock should rally into April of 2023. Our calculations suggest Apple should reach $208 (+/- $2) by the end of April. I say should not in terms of PRICE, but in terms of TIME. If AAPL doesn’t reach this PRICE target by April, the TIME variable will extend and the stock will need more time to hit the same PRICE target.

Once again, we have to make an adjustment to our original April TIME turning point due to the market’s inability to reach its targets by this juncture.

Yet, the overall forecast remains the same and in force.  

  • AAPL is approaching an important top. This top will arrive on a certain date in September – October of this year.
  • The final price projection is closer to $200 a share because the move is taking longer than the original price of $208 projected.
  • Once the top is put in place AAPL will very quickly move down. It is actually a fast mover to the downside between 2023 top and 2024 bottom. Exciting…..

End Of Day Market Update & Why The US Dollar Will Not Crash – Yet

12/18/2023 – A positive day with the Dow Jones up 1 point (+0.01%) and the Nasdaq up 90 points (+0.61%) 

It is rather entertaining, but today’s top on the NDX has matched its January of 2022 counterpart to the point. No breakout yet. Having said that, it is a little beside the point. As we have mentioned before, we now have numerous confirmation that both the NDX/SPX will see their respective all time highs.

The Dow pushed slightly above its Intraday short-term point of force discussed in our Intraday analysis.  Although, it remains within the margin of error and cannot yet be fully dismissed. Meaning, while it is possible we get a pullback here, that possibility has greatly diminished short-term since we have pushed slightly above this short-term point of force. If we push higher tomorrow, this will be confirmed and the rally will continue.

No other changes to our longer-term weekly and prior daily updates.

The above section is a short excerpt from our Subscriber Analysis. If you would like to see the rest and if you would like to find out exactly when and where the top will arrive, please click on this link 

Now, I found the following article of great interest…….

Visualizing $97 Trillion Of Global Debt In 2023

Country Gross Debt (B) % of World Total Debt to GDP
🇺🇸 U.S. $33,228.9 34.2% 123.3%
🇨🇳 China $14,691.7 15.1% 83.0%
🇯🇵 Japan $10,797.2 11.1% 255.2%
🇬🇧 UK $3,468.7 3.6% 104.1%
🇫🇷 France $3,353.9 3.5% 110.0%
🇮🇹 Italy $3,141.4 3.2% 143.7%
🇮🇳 India $3,056.7 3.1% 81.9%
🇩🇪 Germany $2,919.3 3.0% 65.9%
🇨🇦 Canada $2,253.3 2.3% 106.4%
🇧🇷 Brazil $1,873.7 1.9% 88.1%
🇪🇸 Spain $1,697.5 1.7% 107.3%

I found the above of interest in terms of the US Dollar. Quite a few market participants believe the US Dollar is not worth the paper it is printed on and will soon crash. As accurate as that opinion might be, it flies in the face of our DXY forecast – at least for now. 

What the above data shows is that all major economies are stuck in the same boat and that other currencies are arguably “just as bad”. In other words, the US Dollar cannot crash against other currencies that are suffering from the same problem. And once again – YET.

Our DXY forecast is rather unique in that sense and shows USD movements going forward that no one is anticipating. If you would like to see that forecast, please Click Here and select our MegaCap Section.   

Our Next FAST MOVER Is Ready To Go

Over the years we have been able to figure out a way of identifying Fast Moving stocks. These are stocks that are about to stage powerful directional moves of 50%+ within a compressed time window of 12 months or less. To learn more about our fast movers and the math behind it, please Click Here

Charts below represent our latest find. If you recognize the charts, great. The stock in question is about to bottom and then proceed to surge 200% + over the next 10-12 months. 

If you would like to obtain the exact time/price target for this upcoming bottom as well as our trading parameters, please Click Here

If you would like to find out what the stock market will do next in both price and time, long-term and short-term, please Click Here.  You can also find our MegaCap Stocks Time/Price Projections and our Fast Movers at the same link.